The value of break crops in low rainfall farming systems and which ones perform the best
Author: Michael Moodie (Mallee Sustainable Farming, Mildura) and Nigel Wilhelm (South Australian Research and Development Institute, Waite Research Precinct, Adelaide). | Date: 09 Feb 2016
Background
The agronomic benefits of including break phases in paddock rotations are well known: they can disrupt root disease cycles, fix nitrogen, conserve, provide extra management options to control grass weeds, and diversify income streams. However, over the past 15-20 years, the intensity of cereal crops in low rainfall zone paddock rotations has increased dramatically and it is not uncommon for farmers within the region to have implemented cropping sequences that include five to ten consecutive cereal grain crops. The increased intensity of cereal crops has largely been at the expense of pastures and fallows, and farmers have been reluctant to include broadleaved break crops in rotations dues to the perceived higher risk of growing these crops in the low rainfall zone. GRDC funded research to quantify the yield benefits that break phases provide to subsequent cereal crops in the low rainfall zone and to quantify the impact of break phases on profitability of the long term rotation.
The Low Rainfall Crop Sequencing Project (LRCSP, DAS00119) commenced in 2011 with field trials at five sites across the low rainfall zone of south-eastern Australia. At that point in time, paddock rotations in this region were dominated by intensive cereal cropping, and broadleaved grain crops occupied less than five per cent of the landscape. Moreover, these intensive cereal cropping sequences were declining in productivity due to agronomic constraints such as grass weeds, declining soil nitrogen fertility, and crop diseases. The aim of the project was to test if a one or two year well-managed break phases in low rainfall crop sequences could successfully address agronomic constraints, increase the productivity of subsequent cereal crops, and, most importantly, improve the profitability of the crop sequence when compared to continuous cereal.
In the northern Victorian and South Australian Mallee, the LRCSP motivated many farmers to try broadleaved break crops in paddock rotations for the first time. However, very little localised information was available to support break crop selection and management in this low rainfall farming zone. To address this gap, Mallee Sustainable Farming implemented break crop comparison trials at the Mallee crop sequencing site near Mildura in 2013 and 2014. In 2015 a new project funded by the South Australian Grains Industry Trust (SAGIT) compared broadleaved break crop performance across four soil types in the northern South Australian Mallee.
Methodology
Low rainfall crop sequencing project (LRCSP)
The LRCSP is a collaboration between SARDI and five farming systems groups in the southern region to deliver five crop sequencing trials in the low rainfall zone of south eastern Australia:
- Eyre Peninsula Research Foundation (EPARF). Site location: Minnipa, SA
- Upper North Farming Systems (UNFS). Site location: Appila, SA
- Mallee Sustainable Farming (MSF). Site location: Mildura, Vic
- Birchip Cropping Group (BCG). Site location: Chinkapook, Vic
- Central West Farming Systems (CWFS). Site location: Condobolin, NSW
This paper focuses on the results from the Minnipa, Appila and Mildura sites. Replicated trials were established in paddocks with a long history of intensive cereal cropping. Agronomic constraints such as grass weeds, soil borne disease, and declining soil fertility were constraining cereal crops yields in these paddocks. Each trial consisted of up to 19 unique crop sequences which included both one and two-year break phases in 2011 and/or 2012 followed by wheat in 2013 and 2014 (Table 1). These treatments were selected by the collaborating farming systems groups in consultation with local farmers and advisers. Each trial also maintained a continuous wheat treatment for the four years of the trial as a benchmark to assess the impact of the other crop sequences.
Table 1: Details of the four year rotations implemented at the Mildura, Appila and Minnipa sites.
| Mildura | Ident | Appila | Ident | Minnipa | Ident |
|---|---|---|---|---|---|
| canola-chickpea-w-w | C-CP | canola-field pea-w-w | C-FP | canola-field pea-w-w | C-FP |
| canola-field pea-w-w | C-FP | field pea-canola-w-w | FP-C | field pea-canola-w-w | FP-C |
| canola-bmvetch-w-w | C-V | hmillet-bmvetch-w-w | MT-V | medic-gcanola+pasture-w-w | M-C+P |
| chickpea-canola-w-w | CP-C | medic-hpasture-w-w | M-P | ||
| fallow-canola-w-w | F-C | medic(p)-hpasture-w-w | M(P)-P | hmedic-canola-w-w | M-C |
| fallow-fallow-w-w | F-F | pasture-hoats+vetch-w-w | P-O+V | canola-gmedic-w-w | C-M |
| fallow-field pea-w-w | F-FP | c,hmix1-c,hmix1-w-w | MX1-MX1 | hsulla-gsulla-w-w | S-S |
| a,gmedic-gpasture-w-w | M(H)-P | hcanola+vetch-field pea-w-w | C+V-FP | fallow-fallow-w-w | F-F |
| b,gmedic-gpasture-w-w | M(L)-P | fallow-fallow-w-w | F-F | canola-goats-w-w | C-O |
| field pea-canola-w-w | FP-C | fallow-canola-w-w | F-C | field pea-goats-w-w | FP-O |
| field pea-bmvetch-w-w | FP-V | fallow-lentil-w-w | F-L | hmedic-goats-w-w | M-O |
| bmvetch-canola-w-w | V-C | hvetch-fallow-w-w | V-F | hoats-canola-w-w | O-C |
| bmvetch-field pea-w-w | V-FP | fallow-w-w-w | F-W | hoats-field pea-w-w | O-FP |
| barley-wheat-w-w | B-W | lentil-w-w-w | L-W | hoats-gmedic-w-w | O-M |
| canola-w-w-w | C-W | w-barley-w-w | W-B | hvetch+oats-canola-w-w | V+O-C |
| canola+field pea-w-w-w | C+FP-W | w-hpasture-w-w | W-P | hcanola+field pea-w-w-w | C+FP-W |
| hoats-w-w-w | O-W | w-gmedic-w-w | W-M | field pea-w-w-w | FP-W |
| field pea-w-w-w | FP-W | dwheat(p)-hpasture-w-w | W(P)-P | emedic-w-w-w | M(J)-W |
| fallow-w-w-w | F-W | hoats-w-w-w | O-W | fmedic-w-w-w | M(A)-W |
| w-w-w-w | CONW | w-w-w-w | CONW | w-w-w-w | CONW |
| aLow Sowing Rate (5kg/ha) bHigh Sowing Rate (15kg/ha) Note: Vetch was brown manured |
cMix1: oats+vetch+medic dWheat undersown with medic pod (P)Medic sown as pod |
eJaguar medic harvested for seed fAngel medic harvested for seed |
|||
| hTreatment cut for hay; gTreatment grazed; bmTreatment was brown manured Note: Medic refers to sown medic pasture: Pasture refers to regenerating medic pasture Fallow refers to chemical fallow |
|||||
Throughout each trial, agronomic management was tailored for each individual sequence to help maximise the profitability of that rotation and to correct the agronomic constraints that emerged for that option. For example, nitrogen inputs, varieties, sowing dates or herbicide applications were varied depending on the level and type of agronomic constraints in each rotation.
Each trial was intensively monitored for a range of agronomic parameters. Prior to sowing soil fertility and root disease inoculum was measured in the topsoil while soil nitrogen and soil water were measured throughout the soil profile. Grass weeds populations were also monitored over the course of the trial by measuring weed seed banks and in-crop weed numbers.
Gross margins were calculated for each treatment in each season using the Rural Solutions ‘Farm Gross Margin and Enterprise Planning Guide’ as a base. Costs were calculated using the actual inputs used in the trial and the values provided in the corresponding gross margin guide. Each year gross margins were calculated using the five-year average price stated in the 2015 (Table 2) guide. Treatment grain yields were used for calculating income and 85% of dry matter yield was used for calculating hay yield. For grazing livestock, income was calculated using the dry sheep equivalent (DSE) cereal zone gross margin for a prime lamb enterprise and a nominal stocking rate of 2 DSE per winter grazed hectare, irrespective of pasture production.
Table 2: Enterprise prices used in the calculations of gross margins.
| Enterprise | Price | Notes |
|---|---|---|
| Wheat grain | $271/t | All assumed APW quality |
| Barley grain | $225/t | All assumed feed quality |
| Lentils grain | $628/t | |
| Field Pea grain | $265/t | |
| Chickpea (desi) grain | $414/t | Assumed $50/t below kabuli chickpea price |
| Canola grain | $522/t | |
| Oaten hay | $148/t | |
| Legume hay | $198/t | Assumed $50/t above oaten hay |
| Mixed legume/ non-legume hay | $173/t | Assumed $25/t above oaten hay |
| Livestock (grazing) | $66/ha | Cereal zone prime lamb: $33/DSE/ha x 2 DSE/ha |
Break crop comparison trials
Pulse crop comparison trials were implemented at the Mallee crop sequencing site near Mildura in 2013 and 2014. The trials compared a range of grain break crops by selecting the best adapted variety/s for the region in consultation with agronomists and industry experts. The crops present in the trials were field pea, chickpea, lupins, faba bean and lentils. Both trials were sown into a moist seedbed in early May of each year. Each treatment was inoculated with the specific strain of peat inoculant and were not impacted by weeds, disease, pests, frost or heat shock in either season.
In 2015, a new project funded by the SAGIT commenced to compare broadleaf break crop performance across four soil types in the northern South Australian Mallee. Trials were established at Waikerie and Loxton with two trials implemented at each site on contrasting soil types. At the Waikerie site, one trial was located on a sandy loam and the other on a shallow heavier soil with limestone, while at Loxton trials were located on either a red loam or a deep sand.
Table 3 shows the crop type, variety, target plant population, and seeding rate used for each treatment. Each crop is being managed independently to ensure that it can reach its potential. Agronomic management differences include herbicide choice, fertiliser rates, and fungicide and pesticide applications. In 2015 the Loxton site was sown on 28 April and the Waikerie site on 1 May.
Table 3: Broadleaved crop treatments at Waikerie and Loxton.
| Crop | Variety | Target plant m-2 | Seeding rate kgha-1 |
|---|---|---|---|
| Field Pea | PBA Wharton | 45 | 90 |
| Vetch | Rasina | 60 | 40 |
| Narrow Leaf Lupin | PBA Barlock | 50 | 90 |
| Albus Lupin | Luxor | 35 | 120 |
| Faba Bean | PBA Samira | 20 | 140 |
| Lentil | PBA Hurricane XT | 120 | 50 |
| Chickpea (desi) | PBA Striker | 45 | 100 |
| Chickpea (kabuli) | GenesisTM090 | 35 | 120 |
| Canola | ATR-Stingray | 40 | 2.5 |
Results and discussion
Impact of break crops on subsequent wheat yield
Of the five trials conducted, the Mildura, Appila and Minnipa LRCSP sites were similar in that they had low to moderate populations of grassy weeds. For these trials, including break phases in rotations substantially increased yields of subsequent wheat crops in comparison to continuous wheat (Figures 1–3). At the Mildura site, including a double break phase in 2011 and 2012 resulted in increased wheat production of 0.6–1.6 t/ha over both 2013 and 2014 (Figure 1). This is despite relatively low yields of the continuous wheat treatments, less than 1.5 t/ha in the corresponding seasons. At this site double breaks were more effective than single break phases which was largely due to the rapid re-establishment of brome grass in the second year following a single break.
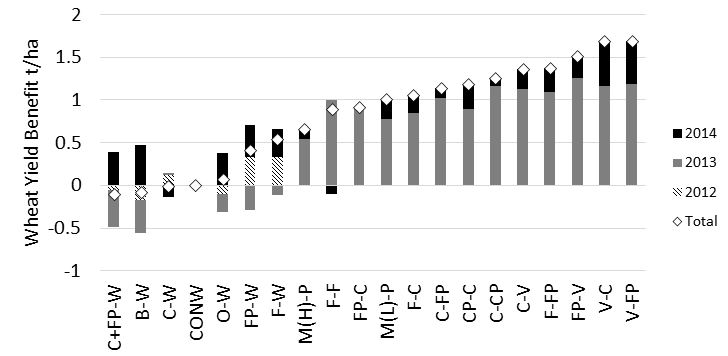
Figure 1. Wheat yield benefit (treatment wheat yield – continuous wheat yield) achieved at the Mildura site following one and two year break phase. Yields of the continuous wheat treatment (CONW) were 0.93, 1.42 and 1.31 t/ha in 2012, 2013 and 2014 respectively. See Table 1 for an explanation of the treatment coding.
At Appila and Minnipa, wheat yield benefits were similar to those at Mildura despite higher rainfall and yield potential at these sites. Continuous wheat yielded 2.79 and 1.31 t/ha at Appila and 1.66 and 3.28t/ha Minnipa in 2013 and 2014 respectively. At Appila, two year break treatments increased subsequent wheat production by 1–2t/ha and were also more effective than one year breaks phases with the exception of the oaten hay–wheat and fallow–wheat (Figure 2).
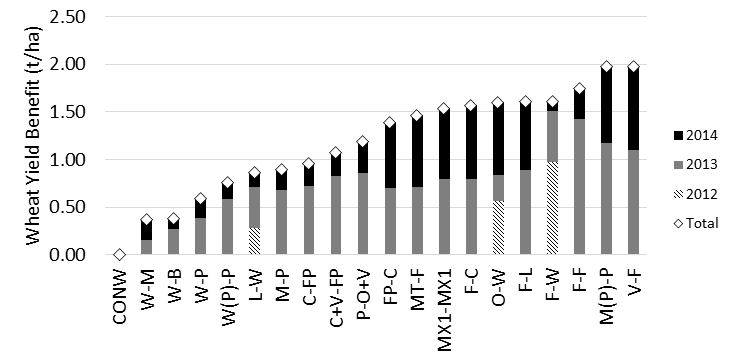
Figure 2. Wheat yield benefit (treatment wheat yield – continuous wheat yield) achieved at the Appila site following one and two year break phase. Yields of the continuous wheat treatment (CONW) were 1.65, 2.79 and 1.41 t/ha in 2012, 2013 and 2014 respectively. See Table 1 for an explanation of the treatment coding.
Wheat yield benefits at Minnipa were generally between of 1–1.4t/ha over the course of the trial, however one year breaks were as effective as two year breaks (Figure 3).
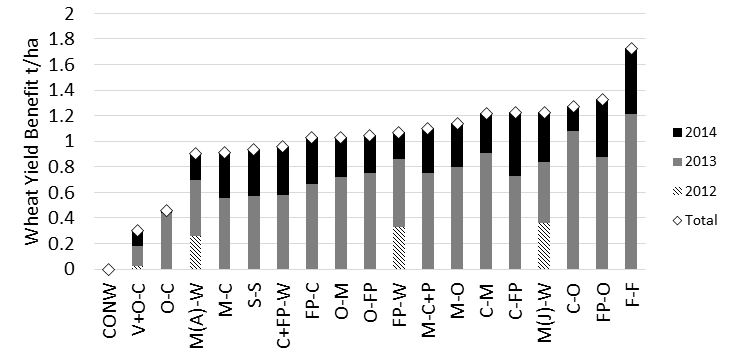
Figure 3. Wheat yield benefit (treatment wheat yield – continuous wheat yield) achieved at the Minnipa site following one and two year break phase. Yields of the continuous wheat treatment (CONW) were 1.70, 1.66 and 3.28 t/ha in 2012, 2013 and 2014 respectively. See Table 1 for an explanation of the treatment coding.
The type of break phase appeared to have little effect on subsequent wheat production as long as the break phase successfully addressed the agronomic constraints present. Analysis was undertaken to quantify the contribution of brome grass, soil nitrogen, rhizoctonia, and soil water management to wheat yield benefits measured at the Mildura site in 2013 and 2014. In 2013, 39% of the yield improvement was due to reduction in brome grass numbers, 38% was due to more soil nitrogen, 19% was due to less rhizoctonia, and 4% was due to more water. Brome grass was the dominant driver of positive break effects in 2014 accounting for an average of 80% of the differences in wheat yield. Higher soil nitrogen levels accounted for a further 18% of the positive break effects in 2014.
Profitability of including break crops in low rainfall rotations
The inclusion of break phases was most profitable at the Mildura and Appila sites, where over half of the rotations with break phases were more profitable than continuous wheat (Table 4). At Mildura, the top five rotations increased gross margin by an average of $230/ha over the four years or approximately $60/ha/year. At Appila, the profit advantages were greater with the top five most profitable crop sequences delivering an average of $370 additional profit or approximately $60/ha/year.
Table 4: Total gross margin (GM) for all years (2011-2014) treatments included in the Mildura, Appila, and Minnipa LRCSP. Total GM ($/ha) is provided for continuous wheat (CONW) with the differential GM ($/ha) (treatment - CONW treatment) shown.
| Mildura |
Appila |
Minnipa | |||
|---|---|---|---|---|---|
| Treatment | GM (2011-14) | Treatment | GM (2011-14) | Treatment | GM (2011-14) |
| CONW | $692 | CONW | $1,034 | CONW | $1,608 |
| FP-V | +$284 | M(P)-P | +$431 | C-FP | $0 |
| C-CP | +$240 | MX1-MX1 | +$417 | FP-C | -$29 |
| FP-W | +$228 | F-C | +$373 | O-M | -$59 |
| C-FP | +$221 | O-W | +$331 | C-O | -$89 |
| CP-C | +$180 | F-L | +$303 | C-M | -$133 |
| F-FP | +$111 | W(P)-P | +$173 | O-FP | -$133 |
| O-W | +$102 | W-B | +$112 | O-C | -$180 |
| C-V | +$82 | V-F | +$98 | C+FP-W | -$184 |
| B-W | +$55 | W-P | +$84 | FP-W | -$202 |
| V-FP | +$27 | F-W | +$77 | FP-O | -$247 |
| FP-C | +$13 | MT-V | +$58 | M-C | -$255 |
| C-W | +$7 | P-O+V | -$23 | M-O | -$307 |
| V-C | -$28 | C+V-FP | -$45 | V+O-C | -$371 |
| M(L)-P | -$53 | FP-C | -$87 | M-C+P | -$394 |
| F-C | -$84 | F-F | -$101 | M(J)-W | -$409 |
| C+FP-W | -$95 | L-W | -$101 | S-S | -$440 |
| M(H)-P | -$108 | M-P | -$106 | F-F | -$550 |
| F-W | -$147 | W-M | -$193 | M(A)-W | -$576 |
| F-F | -$169 | C-FP | -$369 | ||
Key attributes of the most profitable crop sequences at both Mildura and Appila were: having at least one profitable break phase in the rotation, and that the rotation delivered large yield benefits to subsequent wheat crops. At Mildura, field peas, canola, and chickpeas produced good yields and gross margins in the 2011 season. The yield of field pea was 1.8t/ha, canola was 0.7t/ha, and chickpeas was 0.8t/ha, with corresponding gross margins of $258/ha, $185/ha, and $138/ha respectively. Seasonal conditions were poor at Mildura in 2012, however field pea treatments still averaged 1 t/ha, while canola and chickpea both yielded below 0.4 t/ha. Field peas also out-yielded wheat in both seasons, with continuous wheat yielding 1.5t/ha and 0.9t/ha in 2011 and 2012 respectively.
At Appila, profitable gross margins were achieved from crop sequences where crops and pastures were cut for hay. The top producing hay treatments in 2011 and 2012 produced 4–7t/ha of dry matter resulting in profitable gross margins of $350–$500/ha. Continuous wheat produced a profit of $285/ha and $240/ha in 2011 and 2012 respectively. At Appila, broadleaved break crops grown for grain generally performed poorly due to severe frost events impacting grain yield in both 2011 and 2012. The exceptions were canola and lentils producing excellent gross margins of $550/ha and $365/ha in 2012. Both of these treatments followed a chemical fallow in 2011, and both crops are high value grain crops where revenue is boosted by higher prices than other enterprises.
Continuous wheat was the most profitable treatment at Minnipa with a gross margin of $1608/ha over the four years of the trial (Table 4). The profitability of this treatment was boosted by a high wheat yield in 2011 (3.5t/ha) resulting in an extremely profitable gross margin of $540/ha. Therefore, the opportunity cost of not having a wheat crop sown in 2011 was too much for the other rotations to claw back, even though continuous wheat was the least profitable treatment over the 2012-2013 time frame. The top five most profitable rotations at Minnipa from 2013–2014 were $95/ha/year more profitable than continuous wheat.
Comparative break crop performance in the low rainfall Mallee
Recent break crop comparison trials have highlighted the potential for grain legume crops to be productive and profitable in the Northern Victorian and South Australian Mallee (Table 5). Trials were conducted on a similar sandy loam soil type at Mildura (2013 and 2014) and Waikerie (2015). Growing season rainfall for 2013-2015 was 130mm, 132mm (Mildura) and 145mm (Waikerie) which is below average, although stored soil moisture was available in 2014 and 2015. Potential yield limiting factors such as frost, heat, or biological constraints such as pest or disease did not appear to significantly impact these trial sites.
The data in Table 5 shows that field pea and chickpeas performed the best in the northern Mallee region over the past three seasons with an average grain yield of more than 1 t/ha. Lentil yields have also been impressive with an average of 1.2 t/ha, however data is only for two seasons (2014 and 2015) as lentils were affected by herbicide damage following a large rainfall event post sowing in 2013. Faba bean and lupin yields were the lowest across the three seasons, although faba beans produced better yields than expected in this region where long term average wheat yield is 1.4–1.6t/ha.
Table 5. Summary of results from pulse crop comparison trials conducted in the northern Mallee 2013-2015. Data for 2013 and 2014 was from trials conducted at the Mildura LRCSP site and from the Waikerie-Sandy Loam SAGIT trial site in 2015.
| Yield (t/ha) | Gross margins ($/ha) | ||||||
|---|---|---|---|---|---|---|---|
| Price ($/t, 5-year av) | High | Low | Ave | High | Low | Ave | |
| Field pea | 323 | 1.9 | 1.2 | 1.5 | 393 | 187 | 273 |
| Chickpea (kabuli) | 529 | 1.5 | 0.5 | 1.0 | 510 | 31 | 259 |
| Chickpea (desi) | 450 | 1.6 | 0.8 | 1.1 | 452 | 153 | 259 |
| Lentil# | 628 | 1.5 | 0.9 | 1.2 | 688 | 364 | 526 |
| Faba bean | 414 | 1.4 | 0.5 | 0.8 | 415 | 76 | 192 |
| Lupin (narrow) | 265 | 1.1 | 0.5 | 0.9 | 125 | -3 | 77 |
| Lupin (albus) | 265 | 0.9 | 0.3 | 0.6 | 62 | -65 | -3 |
| #2 years of data from 2014 to 2015. The gross margins, including input costs, were calculated using the 2015 Rural Solutions SA Farm Gross Margins Guide. The 5-year average price is calculated from January 2011 to January 2015 (Rural Solutions SA 2015); Input costs for pulse crops are typically similar, at approximately $230 to $255 per hectare. | |||||||
Table 5 also highlights the benefits of high value pulse crops in the low rainfall zone. Despite field peas averaging 1.5t/ha, the average gross margin was similar to chickpeas, which averaged about two thirds of their yield. When calculating gross margins, a relatively conservative figure of $20-30/t was used for freight. In many parts of the northern Mallee region, it is not uncommon for freight costs to be double this figure, therefore high value pulse crops such as chickpeas and lentils may be more attractive to some growers. Faba-beans and lupins are more likely to be attractive to farmers who have an on-farm use such as for livestock.
The data from Table 5 was sourced from trials conducted on the most productive soil type within the northern Mallee region, however a key feature of the Mallee is the extreme variability of soils within each paddock. Therefore, in 2015 a new series of trials were established in the SA Mallee to provide farmers with information about variability of break crop production across common soil types in the region.
Figure 4 provides grain yields of nine break crops across four soil types in 2015. Trials faced extreme environmental conditions in 2015, with frost events affecting the lower lying trial sites at both Waikerie and Loxton, and significant heat events with temperatures reaching above 40 degrees on several occasions in early October. Across all sites, lentils had both the most consistent and the best average grain yield of 0.73t/ha. Field peas averaged 0.64t/ha despite having the highest individual yield at any site of 1.2t/ha at Waikerie on the sandy loam soil type. Field pea yields were particularly affected by frost on the Loxton loam and Waikerie shallow heavy soils. Vetch grain yields were also surprisingly good with 0.63 t/ha while narrow leaf lupins, canola, and faba bean yielded similarly at 0.5–0.53t/ha. The later-maturing crops (chickpeas and albus lupin) performed the worst in 2015 with an average yield of below 0.5t/ha. Very low yields were obtained from these crops on the soils with the lowest water holding capacity at each site: Loxton deep sand and Waikerie shallow heavy.
Figure 4. Comparison of break crop grain yield across four sites in the northern South Australian Mallee in 2015.
Conclusion
The inclusion of break phases in low rainfall crop sequences is a reliable management tool for increasing the yields of subsequent wheat crops in paddocks where agronomic constraints (e.g. grass weeds, declining soil fertility, root disease) are affecting yields of continuous cereals. These wheat yield benefits are commonly 1–2t/ha over two to three seasons flowing the break phase.
Including continuous one and two-year break phases in low rainfall paddock rotations can increase profitability by up to $100/ha/year over maintaining a continuous wheat cropping sequence. Key to increasing profitability is having at least one profitable break crop option which also manages agronomic constraints which are holding back the production of subsequent cereal crops.
Break crop comparison trials have highlighted the potential for grain legume crops to be productive and profitable in the northern Victorian and South Australian Mallee. Field peas, chickpeas and lentils have produced acceptable yields and gross margins in this region over three consecutive seasons.
Acknowledgments
This paper draws on the excellent work by the five collaborating farming systems groups involved in the project: Eyre Peninsula Research Foundation (EPARF), Upper North Farming Systems (UNFS), Mallee Sustainable Farming (MSF); Birchip Cropping Group (BCG) and Central West Farming Systems (CWFS).
Thankyou to the research and technical staff who have worked on the trials: Suzie Holberry, Ian Richter, Peter Telfer and Todd McDonald
Thankyou to Roger Lawes (CSIRO) and Ray Carroll (Rho Environmentrics) who have undertaken data analysis of these trials.
Useful resources
Rural Solutions SA Farm Gross Margin and Enterprise Planning Guide
Further detail on each of these trials can be accessed from each of the participating farming system groups:
Contact details
Michael Moodie
Mallee Sustainable Farming
0448 612 892
GRDC Project Code: DAS00119,
Was this page helpful?
YOUR FEEDBACK