pH mapping and variable rate lime - 50,000 plus hectares of experience
Author: Andrew Whitlock (Precision Agriculture Pty Ltd) | Date: 27 Aug 2015
Take home messages:
- The pH mapping process can deliver immediate lime savings of 20–60 per cent with an average saving of 30 per cent.
- A 10 per cent lime saving is generally required to cover the cost of the process.
Background
Precision Agriculture Pty Ltd is an Australian owned consulting company offering advice, training and products associated with precision farming industries. In 2010 the company purchased a Veris™ soil pH detector, which at that stage was the first in Australia. Since then over 50,000ha of pH mapping has been completed by our three machines.
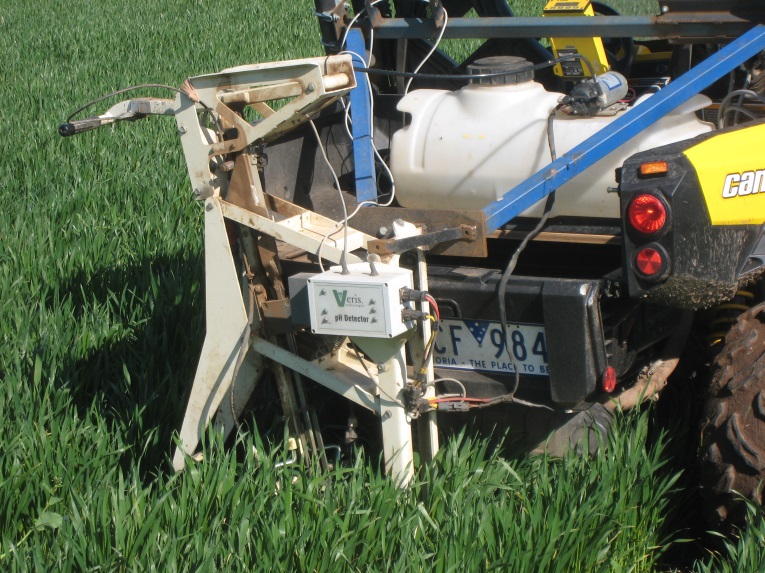
Figure 1: VerisTM soil pH detector.
Soil pH detector and variable rate lime
The pH detector is mounted to the back of an all-terrain vehicle (ATV). It works by taking Global Positioning System (GPS) referenced in-situ soil pH (H2O) measurements in 5–10 seconds at a depth of approximately 7.5cm across fields. In broadacre cropping systems, measurements are taken on a one hectare grid, however in smaller fields the sampling grid is reduced to either a 0.75 or 0.5ha grid. Once completed this data is uploaded to a geographic information systems (GIS) software program to view the field/farm pH map which displays the pH spatial variation and where high, medium and low pH zones exist
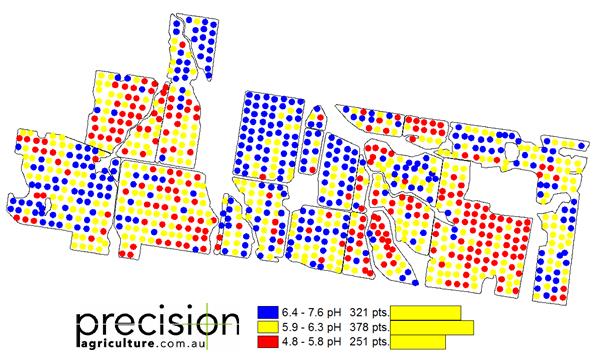
Figure 2: Raw pH point data.
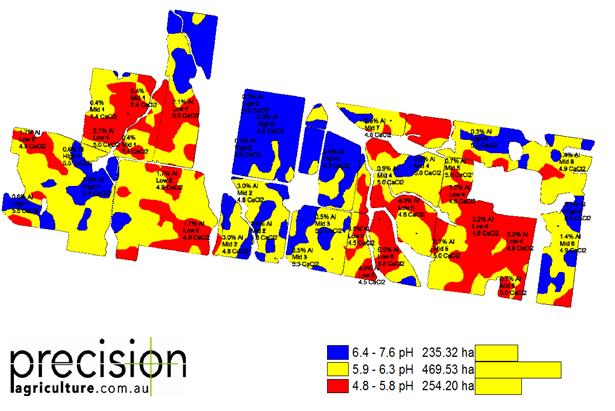
Figure 3: pH zone map with soil test results overlay.
After reviewing the data, soil sampling points are created in the GIS software. These are strategically positioned in the pH zones defined. These points are uploaded to the GPS system for 0-10cm composite soil samples to be taken in the individual pH zones. The soil is tested for pH (H2O) and pH (CaCl2), cation exchange capacity (CEC) and exchangeable aluminium to determine lime rates/lime budgets for the defined pH zones.
Once lime rates are determined, lime prescription maps are created and uploaded to spreader controllers to conduct variable rate lime spreading. Alternatively if the farm doesn’t have variable rate spreading capabilities, a physical map can be provided to enable manual variable rate spreading.
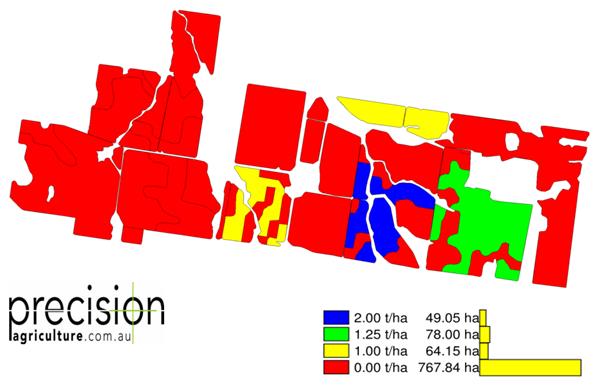
Figure 4: Lime prescription map.
The pH mapping process can deliver immediate lime savings of 20–60 per cent with an average saving of 30 per cent. A 10 per cent lime saving is generally required to cover the cost of the process and we estimate 90 per cent of paddocks we have mapped have warranted variable rate lime. The greatest savings are typically seen on paddocks/farms that are in a ‘lime maintenance’ phase where a large percentage of the paddocks don’t require lime.
The aim of the process is to establish a consistent pH level across the entire paddock in order to provide a platform for good agronomy. Direct pH mapping is the most effective method of defining lime requirements as pH is highly variable and difficult to relate to other layers such as yield and EM38 maps.
Contact details
Andrew Whitlock, andrew@precisionagriculture.com.au
Was this page helpful?
YOUR FEEDBACK