Canola disease update 2015 (NSW)
Author: Kurt Lindbeck, Stephen Marcroft, Angela Van de Wouw, Audrey Leo, Vicki Elliott and Barb Howlett | Date: 17 Feb 2015
Kurt Lindbeck1 , Stephen Marcroft2, Angela Van de Wouw2, 3, Audrey Leo1, Vicki Elliott2 and Barb Howlett3,
1NSW - Department of Primary Industries, Wagga Wagga Agricultural Institute; 2Marcroft Grains Pathology P/L, Grains Innovation Park, Horsham; 3 The University of Melbourne.
GRDC codes: DAN177, UM0051
Keywords: canola, blackleg, disease management, resistance groups, branch infection, sclerotinia stem rot.
Take home messages
- Blackleg monitoring sites indicated a slight decrease in the overall blackleg stem canker levels in 2014 compared to 2013.
- Regional monitoring results for each blackleg resistance group are available on the NVT online website. Consult the Blackleg Management Guide for details of resistance groups.
- Monitoring canola crops for levels of blackleg is an essential tool when making informed decisions about managing the disease.
- Symptoms of stem injury due to blackleg were observed higher in the crop canopy in spring 2014, these symptoms caused yield loss in some instances.
- Sclerotinia stem rot occurred in those districts with a frequent history of the disease. Drier than average conditions in spring kept potential disease levels low.
- Early sown canola crops in districts prone to sclerotinia stem rot are more likely to develop high levels of the disease.
NSW 2014 blackleg severity
Background
Cultivars representing each of the blackleg resistance groups were sown at 32 National Variety Trial sites across Australia (13 sites were located in NSW) and monitored for levels of blackleg development in 2014.
Each site contained a representative cultivar of each of the seven blackleg resistance groups, Groups A, B, C, D, E, F and S. There was no fungicide applied to seed, fertiliser or the growing plot (foliar) at these blackleg monitoring sites. These data indicate which resistance groups have higher levels of disease compared to the national average at each of the regionally based NVT canola yield sites and serve as a monitoring tool of local blackleg pathogen populations.
Overall blackleg severity decreased in most cultivars at blackleg monitoring sites in 2014 in southern NSW (see Table 1) compared with 2013 results. Blackleg severity decreased from 38% average internal infection level in 2013 to 24% in 2014. This was a similar level of infection measured in 2012. The blackleg severity in NSW in 2014 was similar to that measured in South Australia. The decrease in the level of blackleg incidence would be a reflection of the seasonal conditions in southern NSW. Warm autumn and early winter conditions meant that canola plants grew quickly through the seedling growth stage, thereby reaching the 5th leaf stage and escaping susceptibility to stem canker.
Warnings for southern NSW
Despite the overall decrease in the level of stem infection there are some warning signs to be wary of from the data collected. The level of stem infection in Group A and B cultivars was significantly higher than the national average. This is a reflection of the intensity that cultivars from these groups are grown in southern NSW. Isolated reports were also received from growers and advisers, of concerns with the level of blackleg development in some commercial crops of Group A and B cultivars.
In contrast, the level of blackleg in Group D cultivars was much reduced compared to 2013 and reflects the dynamic nature of the blackleg pathogen population. Although the level of disease in the Group D cultivars did not cause any yield loss in 2014 it should be monitored in 2015 so that growers know if it has increased to a dangerous level and can change cultivars prior to the 2016 season.
Use the appropriate management strategy to minimise yield loss
Spores of the blackleg fungus are released from the previous year’s canola stubble, so an increased area of canola results in an increased disease pressure. The most effective blackleg management tool is to keep a 500 m distance from this season’s crop and last year’s canola stubble. However, as more canola is grown this control measure is becoming harder to achieve, particularly in tight wheat/canola rotations.
Blackleg can be minimised by a number of factors including the sowing of cultivars with high blackleg resistance, avoiding last year’s stubble and applying the appropriate fungicides (see 2015 Blackleg Management Guide for details - www.grdc.com.au). An additional method for minimising disease is rotating cultivars with different resistance genes. All canola cultivars are now classified into different resistance groups. Refer to the current Blackleg Management guide (www.grdc.com.au) for each individual cultivar’s group.
Remember to monitor the level of blackleg development in canola crops during the growing season as a basis for selecting appropriate management strategies in the future.
Table 1. Summary of all Australian blackleg monitoring sites.
Cultivars representing each of the resistance groups were sown adjacent to canola National Variety Trial sites across Australia and monitored for levels of blackleg. These data indicate which resistance groups have higher levels of disease compared to the other groups at a particular site.
|
Group |
Comments |
|||||||
|---|---|---|---|---|---|---|---|---|
|
NSW |
A |
B |
C |
D |
E |
F |
S |
|
|
BECKOM |
H |
H |
L |
L |
L |
L |
H |
High blackleg severity in groups A,B and S. |
|
BELLATA |
L |
L |
L |
L |
L |
L |
L |
Low blackleg severity in all groups. |
|
COOTAMUNDRA |
M |
M |
L |
L |
L |
L |
H |
High blackleg severity in group S. Moderate in groups A and B. |
|
CUDAL |
M |
H |
L |
L |
L |
L |
H |
High blackleg severity in groups B and S. Moderate in group A. |
|
GEROGERY |
H |
H |
L |
L |
L |
L |
H |
High blackleg severity in groups A, B and S. |
|
GOULBURN |
M |
L |
L |
L |
L |
L |
L |
Moderate blackleg severity in group A. |
|
GREENETHORPE |
L |
L |
L |
L |
L |
L |
H |
High blackleg severity in group S. |
|
GRENFELL |
M |
H |
L |
L |
L |
L |
H |
High blackleg severity in groups B and S. Moderate in group A. |
|
LOCKHART |
H |
H |
L |
L |
L |
L |
H |
High blackleg severity in groups A, B and S. |
|
MULLALEY |
L |
L |
L |
L |
L |
L |
L |
Low blackleg severity in all groups. |
|
PARKES |
L |
H |
L |
L |
L |
L |
H |
High blackleg severity in groups B and S. |
|
TAMWORTH |
H |
M |
L |
L |
L |
L |
H |
High blackleg severity in groups A and S. Moderate in group B. |
|
WAGGA WAGGA |
M |
H |
L |
L |
L |
L |
H |
High blackleg severity in groups B and S. Moderate in group A. |
|
SA |
A |
B |
C |
D |
E |
F |
S |
|
|
ARTHURTON |
L |
L |
L |
L |
L |
L |
H |
High blackleg severity in group S. |
|
BORDERTOWN |
L |
H |
L |
L |
L |
L |
H |
High blackleg severity in groups B and S. |
|
CUMMINS |
L |
L |
L |
H |
L |
L |
H |
High blackleg severity in groups D and S. |
|
FRANCES |
L |
M |
L |
M |
L |
L |
H |
High blackleg severity in group S. Moderate in groups B and D. |
|
MT HOPE |
L |
H |
L |
M |
L |
L |
L |
High blackleg severity in group B. Moderate in group D. |
|
RIVERTON |
M |
L |
L |
M |
L |
L |
H |
High blackleg severity in group S. Moderate in groups A and D. |
|
SPALDING |
L |
M |
L |
L |
L |
L |
M |
Moderate blackleg severity in groups B and S. |
|
TURRETFIELD |
M |
M |
L |
H |
L |
L |
H |
High blackleg severity in groups D and S. Moderate in groups A and B. |
|
WANILLA |
H |
H |
L |
H |
L |
L |
H |
High blackleg severity in groups A, B, D and S. |
|
YEELANNA |
L |
H |
L |
H |
L |
L |
L |
High blackleg severity in groups B and D. |
|
VIC |
A |
B |
C |
D |
E |
F |
S |
|
|
CHARLTON |
L |
L |
L |
L |
L |
L |
M |
Moderate blackleg severity in group S. |
|
DIGGORA |
M |
H |
L |
L |
L |
L |
H |
High blackleg severity in groups B and S. Moderate in group A. |
|
HAMILTON |
L |
M |
L |
M |
L |
L |
H |
High blackleg severity in group S. Moderate in groups B and D. |
|
KANIVA |
L |
H |
L |
L |
L |
L |
H |
High blackleg severity in groups B and S. |
|
LAKE BOLAC |
H |
M |
L |
L |
L |
L |
L |
High blackleg severity in group A. Moderate in group B. |
|
MINYIP |
L |
L |
L |
L |
L |
L |
M |
Moderate blackleg severity in group S. |
|
WUNGHNU |
L |
H |
L |
L |
L |
L |
H |
High blackleg severity in groups B and S. |
|
YARRAWONGA |
M |
H |
L |
L |
L |
L |
H |
High blackleg severity in groups B and S. Moderate in group A. |
|
WA |
A |
B |
C |
D |
E |
F |
S |
|
|
BADGINGARRA |
L |
H |
L |
L |
L |
L |
L |
High blackleg severity in group B. |
|
CORRIGIN |
L |
H |
L |
L |
L |
L |
L |
High blackleg severity in group B. |
|
GIBSON |
H |
H |
L |
L |
L |
L |
L |
High blackleg severity in groups A and B. |
|
KATANNING |
H |
H |
L |
L |
L |
L |
M |
High blackleg severity in groups A and B. Moderate in group S. |
|
KENDENUP |
L |
H |
L |
L |
L |
L |
M |
High blackleg severity in group B. Moderate in group S. |
|
KOJONUP |
L |
H |
L |
L |
L |
L |
H |
High blackleg severity in groups B and S. |
|
SOUTH STIRLING |
H |
L |
L |
L |
L |
L |
M |
High blackleg severity in group A. Moderate in group S. |
|
WILLIAMS |
L |
H |
L |
L |
L |
L |
H |
High blackleg severity in groups B and S. |
|
L |
Low blackleg severity compared to other groups at that site – continue with current management techniques. |
|
M |
Moderate blackleg severity compared to other groups at that site – monitor crops for disease, see the Blackleg Management Guide. |
|
H |
High blackleg severity compared to other groups at that site – high risk of yield loss if environmental conditions are conducive to high disease severity – see the Blackleg Management Guide. |
Symptoms of blackleg upper branch infection
We normally associate blackleg infection as lesions observed on cotyledons and leaves at the vegetative stage, and later in the season as stem cankers at the crown. In the period between early leaf infection and canker development the fungus grows from the cotyledon/leaf lesion to the crown (junction between the stem and the roots) where it causes a necrosis, blocking the vascular tissue that can cause the plant to lodge and die prematurely.
In recent years we have observed stem infection symptoms later in the growing season. Typically these have been dark necrosis of the pith inside the stem and necrotic lesions on the outside of the stem and branches (Figure 1). In 2014 these symptoms were more widespread and more severe. In some cases these necrotic lesions have caused substantial yield loss.
Causes of stem/branch cankers
It is not entirely clear why we are now observing upper stem/branch infections; however we have isolated the causal fungus and confirmed that it is the blackleg pathogen causing these symptoms.
Anecdotal observations
This type of symptom has been observed in southern NSW in the past, albeit at very low levels. But this year the level of infection appears to have been exasperated by particular environmental influences.
Southern NSW did experience some unusual growing conditions for canola in 2014, with warm autumn and winter temperatures resulting in very rapid establishment and growth of crops. Several frost events also caused injury to early bolting and flowering crops in late July and August, and then drier than average conditions throughout late winter and spring also resulted in crops suffering moisture stress. Plants that are injured or undergoing stress can become more prone to infection by pathogens.
Some symptoms on plants were observed around injury points on the stem, including frost and hail injury, as well as branch junctions where moisture is likely to gather and allow germination and infection by spores. Many plant pathogens are opportunistic and will take advantage of any wounds or ruptures in the epidermis for infection. Infection by the blackleg pathogen can occur when conditions are moist and cool throughout the growing season. Once established, secondary spores spread by rainsplash, can quickly expand the disease within a crop canopy onto any plant tissue including leaves, stems and pods.
Management of stem/branch infection
- Do not be tempted to sow canola early. Follow recommended sowing times for your district and try to ensure stem elongation occurs in the normal flowering window, not in winter when blackleg intensity and risk of frost injury is at its highest.
- Cultivars with effective major gene resistance did not get stem/branch infection. Therefore blackleg resistance groups D, E and F did not get stem/branch canker, even at sites where groups A, B, C and S did get branch cankers.
- Seed dressing fungicides and foliar fungicides applied at the 4-6 leaf growth stage will not protect the stem/branches. It is unclear if later applications of foliar fungicide will protect plants.
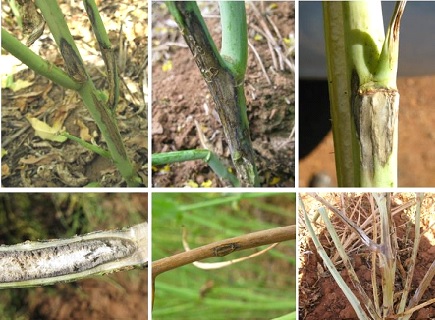
Figure 1. Examples of various blackleg symptoms in the upper canopy of canola plants.
Sclerotinia Stem Rot – 2015 Update
How does the disease develop?
Sclerotinia stem rot has a complex lifecycle compared to many other foliar diseases. There are several key stages that must be synchronised and completed in order for plant infection to occur. Weather conditions must also be suitable for the pathogen at each stage. These stages of development are:
- Soil borne sclerotia are the main source of inoculum each year. Sclerotia soften and germinate in winter once soil has been wet at the surface. This requires continuous wet conditions for about ten days and often not until full ground cover is reached by the developing crop. Most sclerotia will remain viable for up to 3 – 4 years then survival slowly declines.
- Airborne spores of the fungus are released from apothecia (a small, golf tee shaped structure, 5 – 10 mm in diameter) which germinate from sclerotia in the soil.
- Spores of the sclerotinia pathogen cannot infect canola leaves and stems directly. They mainly utilise petals as a food source to germinate, grow and colonise. Whilst petals are the most common food source, other plant parts such as old leaves under the canopy are also prone to infection and colonisation. When the infected petal undergoes senescence, it may become lodged onto a leaf, within a leaf axil or at branch junctions along the stem. If conditions are moist the fungus grows out of the petal and invades healthy plant stem tissue which will result in a stem lesion and production of further sclerotia within the stem which will be returned to the soil after harvest. Sclerotinia is more prevalent in crops with heavy vegetative growth, where air circulation is likely to be limited.
- Sclerotia also have the ability to germinate in the soil, produce mycelium and directly infect canola plants in close proximity, causing a basal infection.
- Weather conditions during flowering play a major role in determining the development of the disease. The presence of moisture during flowering and petal fall will determine if sclerotinia develops. Dry conditions during this time can quickly prevent development of the disease, hence even if flower petals are infected, dry conditions during petal fall will prevent stem infection development.
Research findings in 2014
Commercial canola crops were monitored for the development of sclerotinia stem rot in high sclerotinia risk districts in 2014. These crops were located east of Cootamundra and south of Henty. Consistent with results from 2013 observations within these crops found a very strong relationship between prolonged periods of leaf wetness and stem rot development.
There was potential for high levels of stem rot to develop at several of the disease monitoring sites in 2014. Rapidly developing crops, the presence of apothecia, and high levels of petal infestation by sclerotinia, all indicated that epidemics of the disease were likely. However, drier than average conditions throughout August and spring kept potential stem rot levels low in many districts. Dry conditions within the crop canopy did not allow the pathogen to spread from petals into stems.
Where did the disease occur in 2014?
In 2014 sclerotinia was observed in southern NSW and northern Victoria in those districts with a history of sclerotinia and reliable spring rainfall. These included districts east of Cootamundra and Young, south of Henty, around Corowa and Howlong and districts along the Murray River. Infection levels observed in some crops were as high as 30 – 60%. In other districts, crop infection levels were generally low.
What are the indicators that sclerotinia stem rot could be a problem in 2015?
- Spring rainfall. Epidemics of sclerotinia stem rot generally occur in districts with reliable spring rainfall and long flowering periods for canola.
- Frequency of sclerotinia outbreaks. Use the past frequency of sclerotinia stem rot outbreaks in the district as a guide to the likelihood of a sclerotinia outbreak. Paddocks with a recent history of sclerotinia are a good indicator of potential risk, as well as those paddocks that are adjacent. Also consider the frequency of canola in the paddock. Canola is a very good host for the disease and can quickly build up levels of soil-borne sclerotia.
- Commencement of flowering. The commencement of flowering can determine the severity of a sclerotinia outbreak. Spore release, petal infection and stem infection have a better chance of occurring when conditions are wet for extended periods, especially for more than 48 hours. Canola crops which flower earlier in winter, when conditions are cooler and wetter, are more prone to disease development.
If I had sclerotinia in my canola crop last year, what should I do this season?
The biggest challenge in managing sclerotinia stem rot is deciding whether or not there is a risk of disease development and what will be the potential yield loss. Research in Australia and Canada has shown that the relationship between the presence of the pathogen (as infected petals) and development of sclerotinia stem rot is not very clear due to the strong reliance on moisture for infection and disease development.
Important management options include:
- Sowing canola seed that is free of sclerotia. This applies to growers retaining seed on farm for sowing. Consider grading seed to remove sclerotia that would otherwise be sown with the seed and infect this season’s crop.
- Rotate canola crops. Continual wheat/canola rotations are excellent for building up levels of viable sclerotia in the soil. A 12 month break from canola is not effective at reducing sclerotial survival. Consider other low risk crops such as cereals, field pea or faba bean.
- Follow recommended sowing dates and rates for your district. Do not be tempted to sow crops early if you are located within a sclerotinia prone district. Early flowering crops are more prone to developing sclerotinia stem rot by increasing opportunities for infected petals to lodge in a wet crop canopy. In addition, early sown crops will most likely develop bulky crop canopies which retain moisture and increase the likelihood of infection. Wider row spacings can also help by increasing air flow through the crop canopy to some degree and delaying the onset of canopy closure.
- Consider the use of a foliar fungicide. Weigh up yield potential, disease risk and costs of fungicide application when deciding to apply a foliar fungicide.
- Monitor crops for disease development and identify the type of stem infection. Main stem infections cause the most yield loss and indicate infection events early in the growing season. Lateral branch infections cause lower levels of yield loss and indicate infection events later in the growing season.
Use of foliar fungicides
At this time there are no commercial canola cultivars available on the Australian market with resistance to sclerotinia stem rot. Management of the disease relies on the use of cultural and chemical methods of control. Foliar fungicides should be considered in those districts which are at a high risk of disease development (e.g. districts where the disease frequently occurs, long flowering period and reliable spring rainfall). There are several foliar fungicides currently registered for use in Australia to manage sclerotinia stem rot.
Points to consider when using a foliar fungicide to manage sclerotinia stem rot:
- The most yield loss from sclerotinia occurs from early infection events. Early infection is likely to result in premature ripening of plants that produce little or no yield.
- Plants become susceptible to infection once flowering commences. Research in Australia and Canada has shown that an application of foliar fungicide around the 20% - 30% flowering stage (20% flowering is 14 – 16 flowers on the main stem, 30% flowering is approx. 20 flowers on the main stem) can be effective in reducing the level of sclerotinia stem infection. Most registered products can be applied up to the 50% flowering (full bloom) stage.
- The objective of the fungicide application is to prevent early infection of petals while ensuring that the fungicide also penetrates into the lower crop canopy to protect potential infection sites (such as lower leaves, leaf axils and stems). Timing of fungicide application is critical.
- A foliar fungicide application is most effective when applied before an infection event (e.g. before a rain event during flowering). These fungicides are best applied as protectants and have no curative activity.
- In general, foliar fungicides offer a period of protection of up to three weeks. After this time the protectant activity of the fungicide is compromised.
- Use high water rates and fine droplet sizes for good canopy penetration and coverage.
In 2014 some commercial crops which received an application of foliar fungicide still developed stem rot later in the season. This is not unexpected as the fungicide will have a limited period of protection during a time of rapid plant growth and when the main aim of foliar fungicide application is the prevention of main stem infections, which cause the greatest yield loss. Development of lateral branch infections later in the season is not uncommon, and will result in lower yield loss.
Consult the Sclerotinia Stem Rot in Canola factsheet for further information. This publication is available from the GRDC website.
Contact
Kurt Lindbeck
NSW Department of Primary Industries,
Wagga Wagga Agricultural Institute
02 69 381 608
kurt.lindbeck@dpi.nsw.gov.au
Steve Marcroft
Marcroft Grains Pathology,
Grains Innovation Park
Horsham
03 53 812294
steve@grainspathology.com.au
Was this page helpful?
YOUR FEEDBACK