The effectiveness of nitrogen application for protein 2012 and 2013
Author: Northern Grower Alliance: Richard Daniel, Rachel Norton, Anthony Mitchell, Linda Bailey and Rob Duncan | Date: 06 Mar 2014
![]() Varieties displaying this symbol beside them are protected under the Plant Breeders Rights Act 1994.
Varieties displaying this symbol beside them are protected under the Plant Breeders Rights Act 1994.
;GRDC code: NGA00003: GRDC Grower Solutions for Northern NSW and Southern Qld
Authors
Richard Daniel, Rachel Norton, Anthony Mitchell, Linda Bailey and Rob Duncan, Northern Grower Alliance
Take home messages
- Foliar application of urea solution provided significant increases in grain protein compared to urea applied by streambar or spread, in a series of eleven trials during 2012 and 2013.
- The level of protein benefit was NOT sufficient to generate a net benefit in any trial.
- Timing differences were less clear, with best results generally from application during late head emergence through to the early milk stage.
- The highest level of nitrogen recovery in grain protein was 37% in 2012 and 28% in 2013.
- Grain grade price differentials of at least $20-40/t are necessary to warrant foliar application for protein accumulation unless nitrogen recovery can be increased dramatically.
- Assessment of residual soil nitrogen showed total grain and soil recovery from Spread urea was >85% at Weemelah in 2013, despite generally dry conditions following application.
- Application of spread urea at planting provided the most consistent and highest level of grain protein across the dryland sites.
- Targeting nitrogen budgets to maximise yield for soil moisture availability is expected to be more profitable than trying to manipulate protein with late nitrogen application.
A frequent issue across the northern region in both 2010 and 2011 was the harvest of wheat at yields well above expectation but with low to very low grain protein levels, not infrequently under 10%. This of course resulted in downgrading at receival and consequently reduced economic returns. Although low protein was evident in a wide range of varieties, EGA Gregory ![]() was frequently of concern.
was frequently of concern.
There were a large combination of factors causing the low protein achievement but a clear message from industry was the need to determine whether late application of nitrogen for protein manipulation was an effective management option under northern conditions.
This paper reports on trials conducted in 2012 and 2013, primarily to evaluate the impact of late nitrogen strategies on protein accumulation and to indicate the likelihood of economic benefit.
Primary Aims
- How effective and economic are late applications of nitrogen for grain protein achievement?
- Is there an optimal method or timing?
What was done?
A series of eleven application method and timing trials were conducted in southern Qld and northern NSW during the two seasons, with nearly all sites under dryland conditions:
2012 - Inglestone and Bowenville Qld; Tulloona, Croppa Creek, Bellata and Walgett NSW
2013 - Brookstead (irrigated) and Pilton Qld; Weemelah, Tulloona and Narrabri (supplementary irrigation) NSW
All sites evaluated a combination of application methods and timings with urea applied at a standard rate of 40kg N/ha (~87kg urea/ha). This rate was chosen to maximise the likelihood of achieving measureable differences in grain protein. This rate is at the upper end of commercially applied in-crop rates. Three application methods were used:
- Spread - urea simply spread by hand
- Streambar – urea applied in an aqueous solution using BFS streamer bars in 2012 and Chafer streambars in 2013 (Promax 22% urea solution used in 2012 and Ranger 24% in 2013)
- Foliar – urea applied in an aqueous solution using AIXR nozzles in 2012 and TTJ03 nozzles in 2013
All sites had a minimum of four ‘late’ application timings. These timings commenced at ~ full flag leaf emergence (GS39) and then at ~10-14 day intervals. The last timing was generally during dough development (~GS83-87). Table 1 details the level of crop available nitrogen (soil level plus grower fertiliser program) together with the crop growth stages when additional nitrogen was applied. Multiple timings were conducted in an attempt to generate a timing response ‘curve’ for protein accumulation with an expectation that applications ~7-10 days either side of flowering may result in the highest protein content. Yield responses to nitrogen applied at these timings are generally negligible.
Seven of the eleven sites were planted with small plot equipment. At these sites (Bellata and Walgett in 2012 and all sites in 2013) ‘early’ application of spread urea at 40kg N/ha was also evaluated. All these sites evaluated 40 kg N/ha as spread urea applied at planting (IBS), applied at jointing (GS30) or split evenly between the two timings. The remaining four trials in 2012 were conducted in commercially grown crops. All trials investigated the impact of additional nitrogen under conditions where yield and nitrogen supply were believed to be reasonably matched rather than targeting nitrogen deficient situations.
| Year | Site | Crop available nitrogen* kg N/ha |
Mean crop growth stage at application | ||||
|---|---|---|---|---|---|---|---|
| Timing 1 | Timing 2 | Timing 3 | Timing 4 | Timing 5 | |||
| 2012 | Inglestone | Not tested | GS39 | GS49 | GS63 | GS76 | GS84 |
| Bowenville | Not tested | GS41 | GS51 | GS74 | GS78 | GS86 | |
| Tulloona | Not tested | GS39 | GS51 | GS55 | GS65 | GS73 | |
| Croppa Creek | Not tested | GS45 | GS59 | GS67 | GS74 | GS85 | |
| Bellata | 160 (0-90cm) | GS41 | GS51 | GS69 | GS83 | - | |
| Walgett | 70 (0-90cm) | GS39 | GS61 | GS69 | GS83 | - | |
| 2013 | Brookstead | 277 (0-90cm) | GS47 | GS61 | GS73 | GS82 | - |
| Pilton | 147 (0-90cm) | GS39 | GS57 | GS61 | GS85 | - | |
| Weemelah | 84 (0-60cm) | GS39 | GS60 | GS71 | GS77 | - | |
| Tulloona | 129 (0-60cm) | GS39-41 | GS60 | GS71-73 | GS77-83 | - | |
| Narrabri | 141 (0-60cm) | GS39 | GS45 | GS65 | GS73 | - | |
Brookstead double-cropped in cotton stubble with soil mineral N of 16 kg/ha, received 111 kg N/ha at planting and 150 kg N/ha top-dressed as urea ~10 days prior to GS30. Yield target at planting 6-7t/ha.
GS39 - full flag leaf emergence, GS49 - first awns visible, GS59 - head fully emerged, GS69 - anthesis complete, GS77 - late milk, GS87 - hard dough
Wheat varieties evaluated
EGA Gregory![]() was evaluated for nitrogen response at nine of the eleven sites. Suntop
was evaluated for nitrogen response at nine of the eleven sites. Suntop![]() was evaluated at the two irrigated sites in 2013 (Brookstead and Narrabri).
was evaluated at the two irrigated sites in 2013 (Brookstead and Narrabri).
Rainfall
Rainfall quantity and timing at each site, together with any irrigation, is shown in Table 2. Low levels of rainfall were recorded at most sites during August to October in both years. Irrigations at the Brookstead site were well timed following nitrogen application and were expected to provide nearly ‘ideal conditions’ for incorporation and uptake of Timing 1, 2 and 3 applications.
| Year | Site | Timing 1 | Timing 2 | Timing 3 | Timing 4 | Timing 5 | Total rainfall |
|---|---|---|---|---|---|---|---|
| 2012 | Inglestone | 8 mm, +8 days |
no rain | 5 mm, +7 days |
no rain | 8 mm, +4 days |
21 mm |
| Bowenville | 10 mm, +3 days |
no rain | no rain | 41 mm, +4 days |
no rain | 51 mm | |
| Tulloona | 2 mm, +11 days |
no rain | no rain | 9 mm, +9 days |
4 mm, +5 days |
15 mm | |
| Croppa Creek | 19 mm, +15 days |
no rain | 5 mm, +3 days |
15 mm, +6 days |
no rain | 39 mm | |
| Bellata | no rain | 1 mm, +11 days |
5 mm, +4 days |
16 mm, +3 days |
N/A | 21 mm | |
| Walgett | 11 mm, +8 days |
no rain | 2 mm, +2 days |
no rain | N/A | 12 mm | |
| 2013 | Brookstead | 38 mm, +8 days 30 mm, 30 mm, |
7 mm, +9 days 30 mm, 30 mm, |
3 mm, +6 days 30 mm, |
1 mm, +3 days |
N/A | 65 mm rainfall
150 mm irrigation |
| Pilton | 10 mm, +8 days |
2 mm, +13 days |
5 mm, +2 days |
10 mm, +10 days |
N/A | 34 mm | |
| Weemelah | no rain | 19 mm, +7 days |
8 mm, +8 days |
no rain | N/A | 27 mm/td> | |
| Tulloona | no rain | 22 mm, +6 days |
8 mm, +7 days |
no rain | N/A | 29 mm | |
| Narrabri | no rain | 19 mm, +5 days |
6 mm, +7 days 30 mm, |
no rain | N/A | 25 mm
30 mm irrigation |
E.g. at the Inglestone site, 8 mm of rain were recorded 8 days after Timing 1, there was no rain between Timing 2 and 3 with 5 mm received 7 days after Timing 3.
Site characteristisation – yield and protein
Figure 1 shows the yield and protein levels of untreated grain at each site. Yields ranged from ~2 to 5t/ha in both years but with the majority of sites >3t/ha. Protein levels were low to very low in 2012, ranging from 8.8 to 11.8% with increased levels in 2013, ranging from 11.2 to 14.3%.
Figure 1. Yield and protein content of untreated grain at individual sites
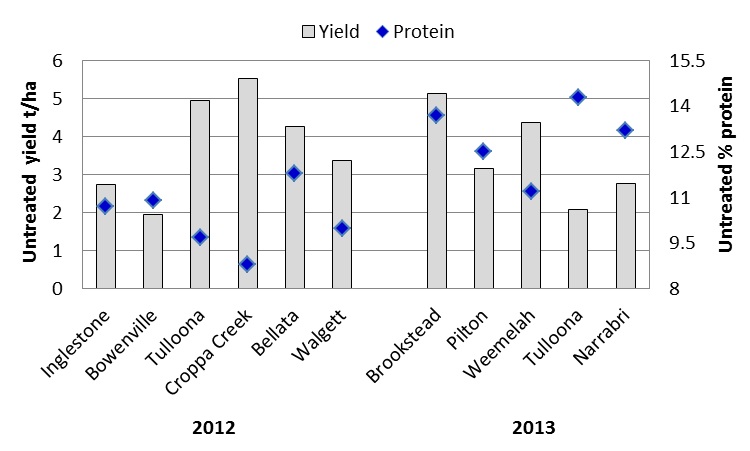
Text description for figure 1. In 2012, results show Inglestone untreated yield ~2.75t/ha and ~10% untreated % protein; Bowenville untreated yield ~2t/ha and ~11% untreated % protein; Tulloona untreated yield ~5t/ha and ~9.5% untreated % protein; Croppa Creek untreated yield ~5.5/ha and ~9% untreated % protein; Bellata untreated yield ~4.25/ha and ~11.5% untreated % protein; Walgett untreated yield ~3.25/ha and ~10% untreated % protein. In 2013, results show Brookstead untreated yield ~5t/ha and ~13.5% untreated % protein; Pilton untreated yield ~12t/ha and ~12.5% untreated % protein; Weemelah untreated yield ~4.25t/ha and ~11.5% untreated % protein; Tulloona untreated yield ~2t/ha and ~14% untreated % protein; Narrabri untreated yield ~2.75t/ha and ~13% untreated % protein.
Late season nitrogen application - key results
Leaf scorch
The only treatment that caused any noticeable leaf burn or scorch was urea applied as an aqueous solution through a conventional nozzle (Foliar treatment). However the level of damage was not concerning at any site or application timing in this series of trials (the only concerning level of leaf scorch occurred in a separate trial in 2013 with UAN application at 40 kg N/ha)
Yield
There was a significant impact on yield recorded in only one of the eleven trials. At Weemelah 2013, the application at ~GS60 resulted in a significant yield benefit compared to both the GS39 and GS77 timings. Although statistically significant, the absolute level of yield benefit was only ~100 kg/ha. The GS60 application received a 19mm rainfall event, seven days after application.
Protein
All sites were analysed individually with an overall analysis also conducted for both years. Figures 2 and 3 show the comparison of the three applications methods (across all timings) and the comparison of timings (across all application methods) over both years.
Test weight and screenings
There was no clear impact from nitrogen application method or timing on test weight or screening level in any trial.
Figure 2. Mean % protein from addition of 40 kg N/ha, six sites in 2012. Treatments that share the same letter within the groups of methods or timings are not significantly different at p=0.05. Broken line indicates the mean % protein of untreated control (no additional nitrogen).
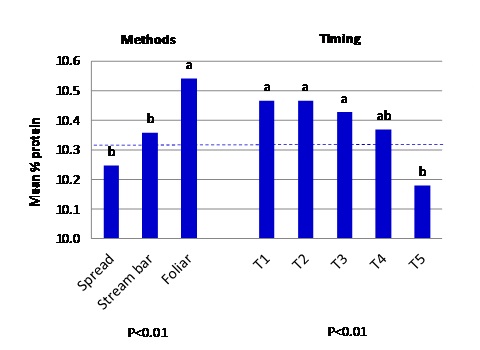
Text description for figure 2. 2012, for P<0.01 the mean % protein results for the methods group were: spread=~10.25%, stream bar=~10.35% and Foliar=~10.55%. Spread and Stream bar results are not significantly different at p=0.05. For the timing group and P<0.01 the mean % protein results were: T1=~10.45%; T2=~10.45%, T3=~10.425%, T4=~10.55% and T5=~10.175%. At p=0.05; T1, T2, T3 and T4 results are not significantly different; T4 and T5 are not significantly different. Overall the mean % protein of untreated control was ~10.325%.
Figure 3. Mean % protein from addition of 40 kg N/ha, five sites in 2013. Treatments that share the same letter within the groups of methods or timings are not significantly different at p=0.05. Broken line indicates the mean % protein of untreated control (no additional nitrogen).
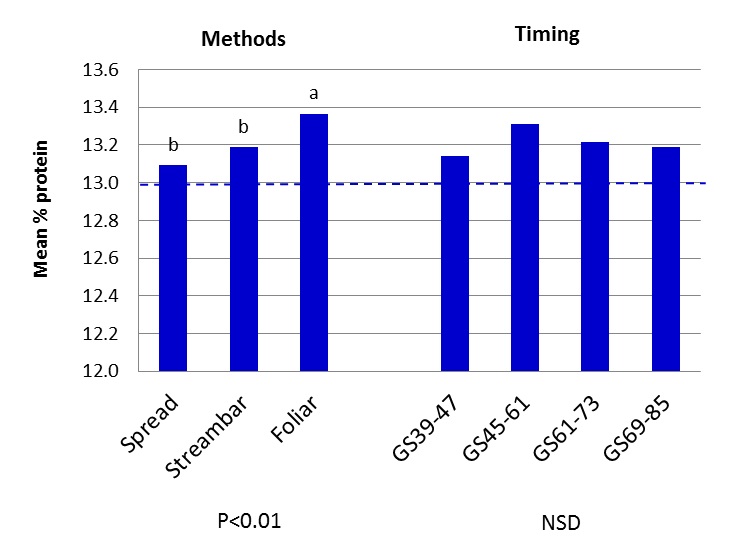
Text description for figure 3. 2013, for P<0.01 the mean % protein results for the methods group were: spread=~13.1%, stream bar=~13.19% and Foliar=~13.35%. Spread and Stream bar results are not significantly different at p=0.05. For the timing group and NSD the mean % protein results were: GS39-47=~13.1%; GS45-61=~13.3%, GS61-73=~13.2%, GS69-85=~13.19%. Overall the mean % protein of untreated control was ~13.0%.
In both years, foliar application resulted in a significant increase in protein compared to either spread or streambar for late season application timings. Foliar application resulted in significant benefits at two individual sites in both 2012 and 2013.
The largest protein benefit in 2012 was obtained at Tulloona using foliar application at GS51 (1.2% but NSD). In 2013 the largest benefit was obtained at Weemelah using Foliar application at GS71 (0.8%, signif).
Nitrogen recovery in grain
The nitrogen recovery in grain was calculated for all treatments (yield t/ha x protein % x 1.75). Figures 4 and 5 show the comparison of the three applications methods (across all timings) and the comparison of timings (across all application methods) over both years.
Figure 4. Mean nitrogen recovery in grain from addition of 40 kg N/ha, six sites 2012. Treatments that share the same letter within the groups of methods or timings are not significantly different at p=0.05 Broken line indicates the mean nitrogen recovery in grain of untreated control (no additional nitrogen)
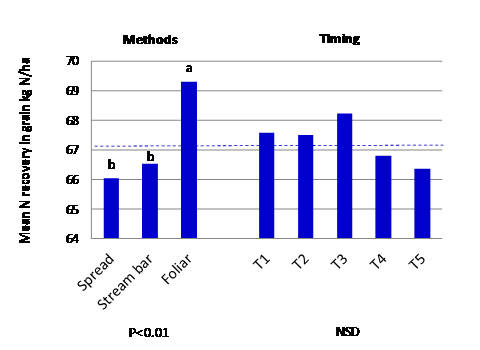
Text description for figure 4. 2012, for P<0.01 the mean nitrogen recovery in grain for the methods group were: spread=~66kg N/ha, stream bar=~66.5kg N/ha and Foliar=~69.25kg N/ha. Spread and Stream bar results are not significantly different at p=0.05. For the timing group and NSD the nitrogen recovery in grain results were: T1=~67.5kg N/ha; T2=~67.45kg N/ha, T3=~68.25kg N/ha, T4=~66.75kg N/ha and T5=~66.4kg N/ha. Overall the mean nitrogen recovery in grain of untreated control was ~67.1kg N/ha.
Figure 5. Mean nitrogen recovery in grain from addition of 40 kg N/ha, five sites 2013. Treatments that share the same letter within the groups of methods or timings are not significantly different at p=0.05 Broken line indicates the mean nitrogen recovery in grain of untreated control (no additional nitrogen)
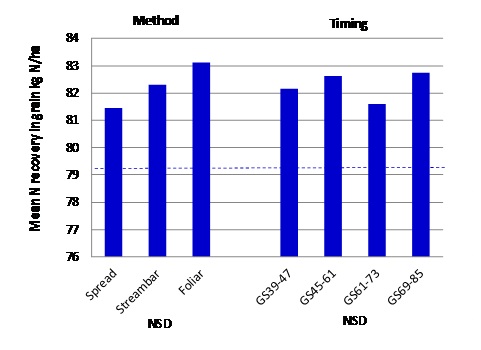
Text description for figure 5. 2013, for NSD the mean nitrogen recovery in grain for the methods group were: spread=~81.5kg N/ha, stream bar=~82.25kg N/ha and Foliar=~83.1kg N/ha. For the timing group the mean nitrogen recovery in grain results were: GS39-47=~82.1kg N/ha; GS45-61=~82.5kg N/ha, GS61-73=~81.5kg N/ha, GS69-85=~82.6kg N/ha. Overall the mean nitrogen recovery in grain of untreated control was ~79.2kg N/ha.
Overall in 2012, foliar application resulted in a significant increase in nitrogen recovery in grain compared to either spread or streambar but still only recovered a mean of ~3 kg N/ha from the 40 kg N/ha applied. In 2013 there was no significant benefit overall from foliar application compared to the other methods although there was a non-significant trend to foliar recovering an extra 4 kg N/ha compared to the untreated control. Foliar application resulted in significant benefits at three of six individual sites in 2012 but only one of five in 2013.
The largest nitrogen recovery in grain benefit in 2012 was obtained at Croppa Creek using foliar application at GS45 (15 kg N/ha, signif). In 2013 the largest benefit was obtained at Weemelah using Foliar application at GS60 (9 kg N/ha, signif). The efficiency of conversion of applied nitrogen to harvested protein was disappointing in both seasons. The mean of the highest recovery treatments in each trial in 2012 was 21% (range 6 to 37%) and also 21% in 2013 (range 12 to 28%).
How effective was early season application of Spread urea?
Application of the equivalent amount of spread urea at planting or GS30 (or split between the two timings) was evaluated at six sites. The spread urea at planting was incorporated by sowing (IBS). The mean response to spread urea at all timings is shown in Figures 6 and 7.
Figure 6. Mean % protein from addition of 40 kg N/ha Spread urea, applied at varied crop stages, two trials 2012. Broken line indicates the mean % protein of untreated control (no additional nitrogen), IBS=incorporated by sowing operation
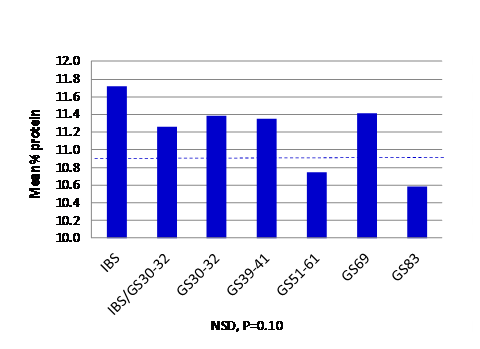
Text description for figure 6. 2012, for NSD, P=0.10 the mean % protein results for Spread urea were: IBS=~11.7%, IBS/GS30-32=~11.25%, GS30-32=~11.39%, GS39-41=~11.35%, GS51-61=~10.75%, GS69=~11.4% and GS83=~10.59%. Overall the mean % protein of untreated control was ~10.9%.
Figure 7. Mean % protein from addition of 40 kg N/ha Spread as urea, applied at varied crop stages, five trials 2013. Treatments that share the same letter are not significantly different at p=0.05. Broken line indicates the mean % protein of untreated control (no additional nitrogen), IBS=incorporated by sowing operation.
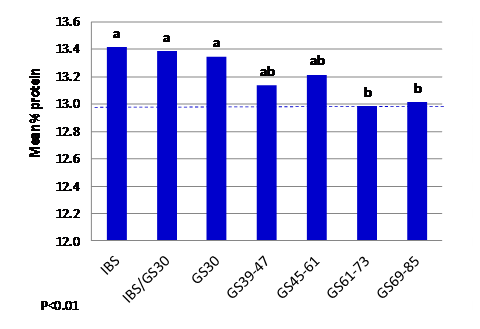
Text description for figure 7. 2013, for P<0.01 the mean % protein results for Spread urea were: IBS=~13.4%, IBS/GS30-32=~13.39%, GS30-32=~11.39%, GS30=~13.35%, GS39-47=~13.1%, GS45-61=~13.2%, GS61-73=~12.95% and GS69-85=~13.0%. Overall the mean % protein of untreated control was ~12.95%.
The early application of spread urea resulted in equivalent or higher protein levels than spread applications later in the season. Across all dryland sites, urea spread and incorporated by sowing resulted in either the highest or second highest protein level of all treatments.
Did treatments perform better under irrigation?
The trial at Brookstead was planted on the 19th June with flowering commencing the 3rd week of September. It received five 30 mm irrigations during the crop development from GS47 to GS73 (over a period of 31 days). In addition it received 38 mm of rain during head emergence. Figures 8, 9 and 10 show the impact of nitrogen application on protein and nitrogen recovery, together with the protein impact from spread urea.
Figure 8. % protein from addition of 40 kg N/ha under irrigation, Brookstead 2013. Treatments that share the same letter within the groups of methods or timings are not significantly different at p=0.05 Broken line indicates the mean % protein of untreated control (no additional nitrogen)
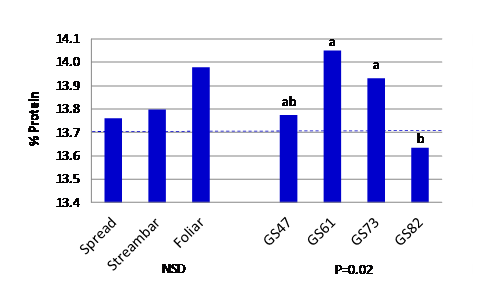
Text description for figure 8. 2013, % protein results (NSD) were: spread=~13.75%, stream bar=~13.8% and Foliar=~13.975%. % protein results (P=0.02) results were: GS47=~13.75%; GS61=~14.05%, GS73=~13.925%, GS82=~13.625%. Results for GS61 and GS73 are not significantly different at p=0.05. Overall the mean % protein of untreated control was ~13.7%.
Figure 9. Nitrogen recovery in grain from addition of 40 kg N/ha under irrigation, Brookstead 2013. Treatments that share the same letter within the groups of methods or timings are not significantly different at p=0.05 Broken line indicates the mean nitrogen recovery in grain of untreated control (no additional nitrogen)
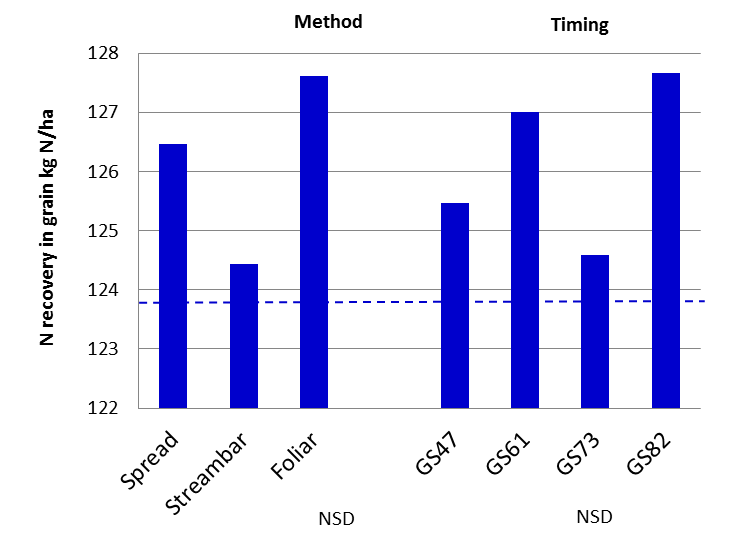
Text description for figure 9. 2013, for NSD the mean nitrogen recovery in grain for the methods group were: spread=~126.5kg N/ha, stream bar=~124.5kg N/ha and Foliar=~127.5kg N/ha.
For the timing group the mean nitrogen recovery in grain results were: GS47=~125.5kg N/ha; GS61=~127kg N/ha, GS73=~124.5kg N/ha, GS82=~127.5kg N/ha. Overall the mean nitrogen recovery in grain of untreated control was ~123.75kg N/ha.
Figure 10.Nitrogen recovery in grain from addition of 40 kg N/ha spread as urea applied at varied crop stages, Brookstead 2013. Treatments that share the same letter are not significantly different at p=0.05. Broken line indicates the mean nitrogen recovery in grain of untreated control (no additional nitrogen), IBS=Incorporated By Sowing operation.
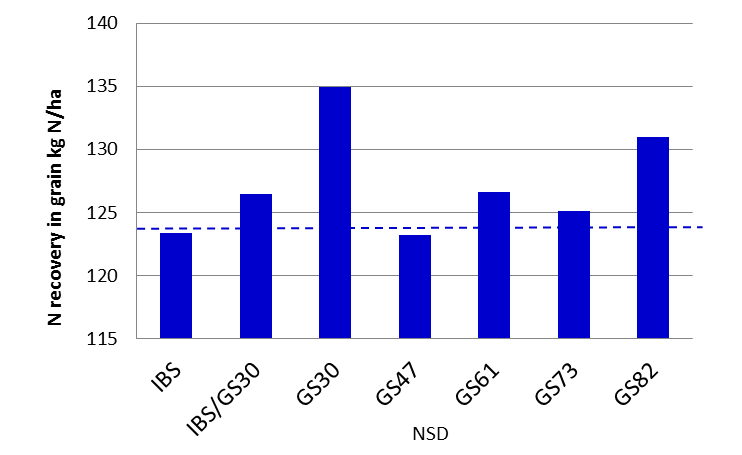
Text description for figure 10. 2013, for NSD the mean nitrogen recovery in grain results were: IBS=~123kg N/ha; IBS/GS30=~126kg N/ha, GS30=~135kg N/ha, GS47=~122kg N/ha, GS61=~127kg N/ha, GS73=~125kg N/ha and GS82=~131kg N/ha. Overall the mean nitrogen recovery in grain of untreated control was ~128kg N/ha.
The results at the irrigated site were very disappointing with the best treatment only increasing grain protein in Suntop by 0.5% with the highest level of actual nitrogen grain recovery only 28%. The poor grain recovery may have been influenced by the high background nitrogen (13.7% protein in the untreated), however three other varieties achieved 15-16% protein in the same trial with no additional nitrogen application.
Was the remainder of the late applied nitrogen lost?
At the Weemelah site there was sufficient rain post- harvest to sample for nitrogen to a soil depth of 30cm in early December. The soil was dry below this depth and it was considered unlikely that nitrogen would have moved any deeper by this stage. Soil samples were taken from the untreated and all methods of application at Timing 2 (GS60) and Timing 4 (GS77). Timing 2 was selected as this was the most effective application with 19mm of rain received 7 days after application. Timing 4 had the lowest level of impact and only experienced a total of 11mm of rain in the six weeks following application with a single rain event occurring 15 days after application. Figure 11 shows the level of grain and soil recovery of nitrogen expressed as a % of the total applied.
Figure 11. % nitrogen grain and soil recovery for late application methods at GS60 and GS77, Weemelah 2013. Treatments that share the same letter are not significantly different at p=0.05.

Text description for figure 11. 2013, % nitrogen recovery results for Spread: GS60 (soil recovery ~83%, grain recovery ~9%) and GS77 (soil recovery ~85%, grain recovery 0%); for Streambar: GS60 (soil recovery ~50%, grain recovery ~27%) and GS77 (soil recovery ~22%, grain recovery 7%); for Foliar: GS60 (soil recovery ~75%, grain recovery ~20%) and GS77 (soil recovery ~20%, grain recovery ~11%). Streambar and Foliar results are not significantly different at p=0.05.
IBS=~123kg N/ha; IBS/GS30=~126kg N/ha, GS30=~135kg N/ha, GS47=~122kg N/ha, GS61=~127kg N/ha, GS73=~125kg N/ha and GS82=~131kg N/ha. Overall the mean nitrogen recovery in grain of untreated control was ~128kg N/ha.Although the nitrogen grain recovery from spread urea was significantly poorer than the foliar application, there were very high levels of recovery of soil nitrogen from spread applications for both timings. This indicated that ‘losses’ from these applications were low despite the absence of follow- up rain for at least 7 days following either application. No assessment was made of the amount of nitrogen captured in leaf and stubble material. The partial nitrogen recovery (grain and soil) from streambar and foliar application was significantly lower than from spread urea but the remaining nitrogen may have been lost by volatilisation, captured in plant material or most probably a combination of both.
Economics
Economic comparisons were conducted on all individual treatments where there was a significant difference in either yield or protein content compared to the untreated. Table 3 shows the highest net benefit treatments from the four sites where significant yield or protein differences occurred.
| Site | Treatment | Receival grade | Gross benefit | Fertiliser and application cost | Net benefit |
|---|---|---|---|---|---|
| Croppa Creek 2012 | Foliar GS45 | No change ASW | $69/ha | $84/ha | -$15/ha |
| Weemelah 2013 | Foliar GS60 | APW to H2 (+$9/t) |
$77/ha | $84/ha | -$7/ha |
| Tullona 2013 | Foliar GS71-73 | No change HPS1 | $79/ha | $84/ha | -$5/ha |
| Narrabri 2013 | Foliar GS69+ | No change HPS1 | $27/ha | $84/ha | -$57/ha |
Granular urea $552/t ($48/ha @ 40 kg N), Urea solution $0.46/L ($76/ha @ 40 kg N/ha)
Application costs: spread $25/ha, foliar $8/ha
Grain prices: 2012 ASW $237, 2013 HPS1 $251, APW $256, H2 $265
Although there was a small but significant increase in protein from foliar application, late nitrogen application did not provide a net economic benefit in any of these eleven trials.
Table 4 shows the grain price differential needed to generate a return on investment of 1 ($1 net benefit for every $1 spent), under a range of nitrogen recovery in grain efficiencies and varying protein increase targets.
| % protein increase required / targeted | % nitrogen recovery in grain | ||
|---|---|---|---|
| 20% | 40% | 60% | |
| 0.5% | $20/t | $12/t | $9/t |
| 1.0% | $36/t | $20/t | $14/t |
| 2.0% | $70/t | $36/t | $25/t |
Urea solution $7.90/L ($1.90 kg N/ha)
Application cost: foliar $8/ha
Assuming 5t/ha yield (grain price differentials will increase by ~$2-3/t at 3t/h yields
The data from these two ‘unfavourable’ years only resulted in mean nitrogen recovery in grain of ~20%. Under these conditions, a grain price differential of at least $36/t would have been needed if a 1% increase in protein was required and the grower was content with a $1 net benefit for every $1 spent. For late nitrogen application to be a more viable consideration, consistent and high % nitrogen recovery in grain (40-60%) combined with grain price differentials of at least $10-20/t would be needed.
Discussion
1. Method comparison
With generally low levels of rainfall in both years, it was not surprising that spread and streambar application were ineffective in increasing protein. For these methods to provide a benefit, nitrogen must be both successfully incorporated into the soil but also reach a depth where roots are actively foraging. These approaches appear much more suited to early season application or use in years with frequent rainfall during spring.
Foliar application resulted in significant protein increases compared to the spread and streambar methods. This strongly suggest that leaf uptake, in late season application, is capable of significantly increasing grain protein levels. However the magnitude of impact was generally disappointing. The highest recovery from any foliar treatment in 2012 was 15 kg N/ha (mean across all sites 6 kg N/ha, range 0 to 15 kg N/ha). In 2013 the highest recovery from any foliar treatment in 2012 was 11 kg N/ha (mean across all sites 7 kg N/ha, range 4 to 11 kg N/ha).
2. Timing comparison
The impact from application timing was less apparent than expected. The clearest result was that application at late milk to mid dough resulted in significantly lower protein than from early applications. This was significant in all four trials where significant timing differences occurred. The data from these trials was inconclusive in determining an optimal growth stage for application although the highest protein result was achieved from application during late head emergence to early milk at seven of the eleven sites.
3. Nitrogen recovery
The efficiency of conversion of applied nitrogen to protein was disappointing in both seasons. The highest level of recovery of any treatment was 37% in 2012 and 28% in 2013 with ~20% nitrogen recovery more realistic across all sites. The level of recovery in 2012 was particularly disappointing as grain protein levels in the untreated were below 12% in all trials. Under these nitrogen limited situations, the recovery was expected to be much higher.
4.Spread urea
Urea applied at planting (IBS) generally provided the highest protein result of all Spread applications. Although early application of additional nitrogen can cause canopy management issues, these results (in years with erratic or low spring rainfall) support the need to get nitrogen on early. In-crop applications are likely to have more benefit in seasons with more frequent and reliable spring rainfall.
5.Irrigated results
The pattern of results for method and timing of application was similar to the overall pattern at dryland sites but the protein and nitrogen recovery in grain levels were extremely disappointing. The best individual treatment result was a recovery of 28% but the mean of all treatments was only 8%. There is no explanation for the lower efficiencies recorded in this trial.
Conclusions
This extensive set of trials was hampered by the low rainfall experienced during the springs of 2012 and 2013, however it clearly showed that:
- Significant increases in protein can be gained by late nitrogen application
- The level of increase however was not sufficient to deliver economic benefits
- Foliar was clearly the most effective method of application
- Timing differences were less clear but generally supported application between late head emergence and early milk stages when targeting protein accumulation
- Although late application of spread urea was, as expected, the least effective method, the results from soil coring at two trials indicated a high level of recovery in the 0-30cm samples (one trial not presented in this paper). This supported recent results from Graeme Schwenke, NSW DPI, indicating nitrogen volatilisation from urea application in-crop may not be as high as previously considered.
These results suggest that trying to increase wheat protein with late nitrogen application is unlikely to be a very effective management tool in areas where spring rainfall is highly erratic. Unless nitrogen in grain recovery levels can be increased dramatically, grain price differentials of ~$20-40/t are probably necessary before even considering this type of approach. Supply of nitrogen requirements either prior to or at planting, or as a top up during early crop growth stages would appear a much more reliable and effective strategy. Economic benefits from nitrogen application targeting yield potential are likely to be far easier to achieve than when targeting protein increases.
Contact details
Richard Daniel
Northern Grower Alliance
Ph: 07 4639 5344![]() 07 4639 5344
07 4639 5344
Email: richard.daniel@nga.org.au
Acknowledgements
Our thanks to the large number of growers and agronomists involved in these trials, to David McRae, Yara Nipro for the provision of fertiliser samples and to Pacific Seeds and AGT for seed requirements. Thanks also to Graeme Schwenke for edits and comments.
![]() Varieties displaying this symbol beside them are protected under the Plant Breeders Rights Act 1994.
Varieties displaying this symbol beside them are protected under the Plant Breeders Rights Act 1994.
GRDC Project Code: NGA00003,
Was this page helpful?
YOUR FEEDBACK