How nematodes reduce yield
Author: JPM Whish, JP Thompson, TG Clewett, JL Lawrence and J Wood | Date: 04 Mar 2014
GRDC code: CES 00055
![]() Varieties displaying this symbol beside them are protected under the Plant Breeders Rights Act 1994.
Varieties displaying this symbol beside them are protected under the Plant Breeders Rights Act 1994.
Authors
- JPM Whish, CSIRO Ecosystem Sciences, 203 Tor St, Toowoomba, QLD 4350, Australia
- JP Thompso, Agri-Science Queensland, Department of Agriculture, Fisheries and Forestry, Leslie Research Centre, PO Box 2282, Toowoomba, Qld 4350, Australia
- TG Clewett, Agri-Science Queensland, Department of Agriculture, Fisheries and Forestry, Leslie Research Centre, PO Box 2282, Toowoomba, Qld 4350, Australia
- JL Lawrence, CSIRO Ecosystem Sciences, 203 Tor St, Toowoomba, QLD 4350, Australia
- J Wood, Agri-Science Queensland, Department of Agriculture, Fisheries and Forestry, Leslie Research Centre, PO Box 2282, Toowoomba, Qld 4350, Australia
Take home message
- Nematodes reduce yields in intolerant wheat cultivars
- Nematodes reduce the amount of water available for plant growth
- Nematodes impose early stress that reduces yield potential despite the availability of water and nutrients
- Maintaining a low nematode population improves crop yields
Introduction
Pratylenchus thornei is a major pathogen of wheat crops in the northern grain region of Eastern Australia with an estimated annual yield loss of $38 million. Damaged crops show symptoms of water and nutrient stress that suggest water and nutrient uptake is significantly affected. In order to understand the mechanisms involved in reducing water uptake and consequently plant yield, detailed measurements of water extraction and leaf area were conducted on a range of wheat cultivars with differing levels of tolerance and resistance to P. thornei.
This study is part of a larger project that aims to better understand the growth, development and mechanisms with which P. thornei reduces the yields of susceptible crops in the northern grains region. The hope is by fully understanding the mechanisms with which this microscopic pathogen can reduce yields, better management strategies can be developed to reduce its impact within intolerant crops and across the rotation.
Nematodes reduce yields in intolerant wheat cultivars
The final yields from three separate experiments highlighted the differences in each cultivar’s tolerance to nematodes, with the yields from each cultivar generally corresponding to the cultivars tolerance rating, EGA Wylie![]() (MT) ≥ QT8447 (T-MT) >EGA Gregory
(MT) ≥ QT8447 (T-MT) >EGA Gregory![]() (MT) > Kennedy
(MT) > Kennedy![]() (MI) > Strzelecki
(MI) > Strzelecki![]() (I-VI). Strzelecki
(I-VI). Strzelecki![]() the most intolerant cultivar had significantly (P<0.05) lower yield when grown under a high nematode pressure compared to all other cultivars at the Formatin site and an equally low yield to Kennedy
the most intolerant cultivar had significantly (P<0.05) lower yield when grown under a high nematode pressure compared to all other cultivars at the Formatin site and an equally low yield to Kennedy![]() at the Yallaroi site (Table 1). When a low population of nematodes was present at the start of the season, no yield difference was observed between any of the cultivars at either the Yallaroi or Formartin sites (Table 1).
at the Yallaroi site (Table 1). When a low population of nematodes was present at the start of the season, no yield difference was observed between any of the cultivars at either the Yallaroi or Formartin sites (Table 1).
|
Experiment |
Cultivar and treatment |
Mean Initial Population (P. thornei /kg, 0-0.9 m) |
Yield (kg/ha) |
WUE (mm/kg) |
Unused soil water (mm) |
Max LAI (m/m) |
|---|---|---|---|---|---|---|
| Formartin 2011 |
QT8447, high |
1,740 a |
5,557 a |
10.8 a |
252 b |
5.8 a |
|
Wylie |
2,032 a |
5,174 a |
10.4 a |
285 b |
4.4 b |
|
|
Kennedy |
1,931 a |
4,352 b |
11.0 a |
387 a |
3.2 bc |
|
|
Strzelecki |
2,262 a |
3,725 c |
9.7 ab |
418 a |
2.2 c |
|
|
Kennedy |
53 b |
4,542 b |
8.4 b |
232 b |
3.5 d |
|
| Formartin 2012 |
QT8447, high |
5,339 a |
3,269 a |
9.3 ab |
77 b |
3.1 a |
|
Wylie |
5,712 a |
3,423 a |
9.9 a |
78 b |
3.0 a |
|
|
Gregory |
5,339 a |
3,107 ab |
9.7 a |
83 b |
2.6 a |
|
|
Kennedy |
6,593 a |
2,840 b |
8.7 ab |
97 b |
2.6 ab |
|
|
Strzelecki |
7,945 a |
2,188 c |
7.8 b |
122 a |
1.7 b |
|
| Formartin 2012 |
QT8447, low |
23 a |
3,730 a |
10.6 a |
81 b |
3.3 a |
|
Wylie |
18 a |
3,350 a |
9.6 a |
78 b |
2.9 a |
|
|
Gregory |
77 a |
3,529 a |
10.4 a |
80 b |
2.9 a |
|
|
Kennedy |
104 a |
3,107 a |
9.6 a |
107 a |
2.4 a |
|
|
Strzelecki |
98 a |
3,396 a |
10.2 a |
92 ab |
3.1 a |
|
| Yallaroi 2012 |
QT8447, high |
2,546 a |
3,330 a |
10.4 a |
70 a |
2.2 a† |
|
Wylie |
5,686 a |
3,037 a |
10.7 a |
81 a |
2.1 a† |
|
|
Kennedy |
1,322 a |
1,423 b |
5.6 b |
118 b |
1.3 b† |
|
|
Strzelecki |
2,642 a |
1,149 b |
4.2 b |
116 b |
1.0 b† |
|
|
QT8447, low |
150 b |
2,956 a |
9.6 a |
46 a |
2.3 a† |
|
|
Wylie |
90 b |
2,959 a |
10.0 a |
51 a |
2.2 a† |
|
|
Kennedy |
318 b |
2,650 a |
9.9 a |
47 a |
1.8 a† |
|
|
Strzelecki |
314 b |
2,419 a |
9.3 a |
63 a |
2.3 a† |
Following harvest the volume of plant available soil water remaining in the root zone was negatively correlated with the yield data. Those cultivars (Strzelecki![]() and Kennedy
and Kennedy![]() ) that had the lowest yields left the greatest quantities of soil water (Table 1). Comparing the unused water from the low and high treatments explains some of the yield difference and is supported by the low water use efficiency results recorded in the most intolerant cultivars (Strzelecki
) that had the lowest yields left the greatest quantities of soil water (Table 1). Comparing the unused water from the low and high treatments explains some of the yield difference and is supported by the low water use efficiency results recorded in the most intolerant cultivars (Strzelecki![]() and Kennedy
and Kennedy![]() ).
).
Nematodes reduce the amount of water available for plant growth
An important characteristic of a soil is the maximum amount of water available for plant growth. This quantity of water is termed the plant available water capacity (PAWC) and is defined as the difference between the (wet) drained upper limit (DUL, the upper water storage limit for a soil after drainage has practically ceased) and the (dry) crop lower limit. The plant available water capacity for Strzelecki![]() differed depending on the population of P. thornei present (Figure 1). In the high P. thornei treatment water extraction at depth was reduced compared to the low P. thornei treatment. At the low P. thornei site there was no significant difference between the plant available water capacity of any of the varieties (Strzelecki
differed depending on the population of P. thornei present (Figure 1). In the high P. thornei treatment water extraction at depth was reduced compared to the low P. thornei treatment. At the low P. thornei site there was no significant difference between the plant available water capacity of any of the varieties (Strzelecki![]() QT8447, EGA Wylie
QT8447, EGA Wylie![]() and EGA Gregory
and EGA Gregory![]() ). The plant available water capacity of Kennedy
). The plant available water capacity of Kennedy![]() was also reduced at the high P. thornei sites, but not to the same extent as Strzelecki
was also reduced at the high P. thornei sites, but not to the same extent as Strzelecki![]() .
.
Figure 1. Plant available water for Strzelecki![]() wheat at Yallaroi (a) and Formartin (b) in 2012. The drained upper limit is represented by the dashed line (— —), and the crop lower limit for the low P. thornei treatment is the solid line (—), the dotted line represents the crop lower limit in the high P. thornei treatment (····). The dot dashed line is the moderately tolerant cultivar QT8447 at the high population and is not significantly different to Strzelecki
wheat at Yallaroi (a) and Formartin (b) in 2012. The drained upper limit is represented by the dashed line (— —), and the crop lower limit for the low P. thornei treatment is the solid line (—), the dotted line represents the crop lower limit in the high P. thornei treatment (····). The dot dashed line is the moderately tolerant cultivar QT8447 at the high population and is not significantly different to Strzelecki![]() on the low population (— · —). The hatching represents the plant available water capacity between the lower limit and drained upper limit.
on the low population (— · —). The hatching represents the plant available water capacity between the lower limit and drained upper limit.
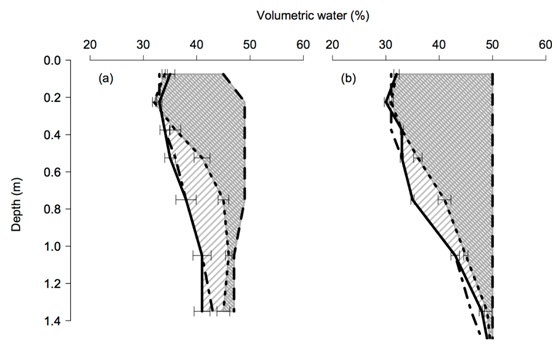
Figure 1 text description
The following are approximates:
The Plant available water capacity of the high P. thornei treatment was significantly less (PAWC Formartin 147 mm Yallaroi 95 mm) than the low treatment (PAWC Formartin 180 mm, Yallaroi 151 mm). Standard errors of the Strzelecki![]() crop LL are presented.
crop LL are presented.
Nematodes impose early stress that reduces yield potential despite the availability of water and nutrients
The leaf area of each cultivar was compared at its maximum leaf area; the results mirror the final yield with the more intolerant cultivars producing significantly less leaf than the more tolerant cultivars (Table 1). Like the yield data, when the cultivars were grown at a low P. thornei population there was no significant difference in maximum leaf area.The cultivar QT8447 (T-MT) produced the highest yield in all but one experiment, and had the highest leaf area index in all experiments. In contrast Strzelecki![]() (I-VI), produced the lowest yield and lowest leaf area index in all the high P. thornei treatments. Comparing change over time for these cultivars, the point where P. thornei affects the growth and development of the intolerant cultivar Strzelecki
(I-VI), produced the lowest yield and lowest leaf area index in all the high P. thornei treatments. Comparing change over time for these cultivars, the point where P. thornei affects the growth and development of the intolerant cultivar Strzelecki![]() can be identified (Figure 2a, b). In both years, the leaf area of the Strzelecki
can be identified (Figure 2a, b). In both years, the leaf area of the Strzelecki![]() plants began to be limited early in the season, suggesting that above ground growth was being restricted by the supply of resources (water and nutrients) at this time.
plants began to be limited early in the season, suggesting that above ground growth was being restricted by the supply of resources (water and nutrients) at this time.
Figure 2. Leaf area index over time for wheat cultivars Strzelecki![]() (open triangles) and QT8447 (solid diamonds) in 2011 (a) and 2012 (b).
(open triangles) and QT8447 (solid diamonds) in 2011 (a) and 2012 (b).
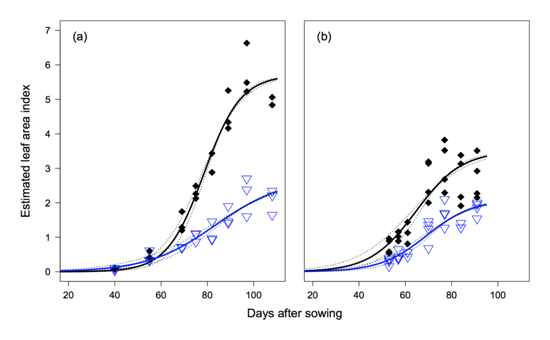
Figure 2 text description
The following are approximates:
In 2011, Figure (a) at 100 days after sowing shows a leaf area index of 2 for Strzelecki and 5.5 for QT8447. In 2012, Figure (b) at 100 days after sowing shows a leaf area index of 2 for Strzelecki and 3.5 for QT8447.
Comparing the contrasting years of 2011 and 2012 at the Formartin site, the shapes of the leaf area development curves (Figure 2) and the final yields (Table 1) show 2011 to have a higher yield potential. However, the relative yield loss from the Strzelecki![]() cultivar compared to QT8447 was similar (67% in 2011 and 66% in 2012). This consistent rate of yield loss means the financial cost of planting into a high nematode population is greater in high yield potential years. The Yallaroi site was planted earlier in a milder environment giving the opportunity for longer seasonal growth and a higher yield potential. In this environment with below average rainfall, yield loss between the Strzelecki
cultivar compared to QT8447 was similar (67% in 2011 and 66% in 2012). This consistent rate of yield loss means the financial cost of planting into a high nematode population is greater in high yield potential years. The Yallaroi site was planted earlier in a milder environment giving the opportunity for longer seasonal growth and a higher yield potential. In this environment with below average rainfall, yield loss between the Strzelecki![]() treatments planted on the high and low P. thornei strips was 53%.
treatments planted on the high and low P. thornei strips was 53%.
These results suggest high populations of P. thornei reduce wheat yields in intolerant cultivars by reducing the supply of resources from the root to the shoots. Other mechanisms such as toxic effects to shoots were not disproven, but are considered unlikely. The penetration of the root system by P. thornei appears to restrict uptake early in the season, and as a result of this restriction the above-ground development (figure 2) of the crop is retarded. A consequence of retarding crop development is a reduced carbon supply; lower water demand and a change in the plant yield potential.
A smaller canopy demands fewer resources from the soil, this accentuates the delayed use of water from the soil resulting from damage to the root system by the nematode population.
The rate of extraction by the different wheat cultivars from each soil layer, varied in accordance to nematode tolerance. In 2011 water extraction was limited to the surface layers by good regular rainfall. However, a clear difference can be seen between the tolerant line QT8447 (MR-MS) and the intolerant cultivar Strzelecki![]() (VS) in the 0-0.3 m layer (Figure 3a). Only the two most extreme cultivars are presented. The demand for water by Strzelecki
(VS) in the 0-0.3 m layer (Figure 3a). Only the two most extreme cultivars are presented. The demand for water by Strzelecki![]() was significantly lower than QT8447 and water was only extracted down to the 0.3-0.6 m layer late in the season and none from the 0.6-0.9 m layer.
was significantly lower than QT8447 and water was only extracted down to the 0.3-0.6 m layer late in the season and none from the 0.6-0.9 m layer.
Figure 3. Water content over time in 2011 and 2012 for QT8447 (closed diamonds) and Strzelecki![]() (open triangles) across three depth layers 0-0.3 m (a), 0.3-0.6 m (b) and 0.6-0.9 m (c). Data are presented on a log scale, log volumetric water = m* das + b
(open triangles) across three depth layers 0-0.3 m (a), 0.3-0.6 m (b) and 0.6-0.9 m (c). Data are presented on a log scale, log volumetric water = m* das + b
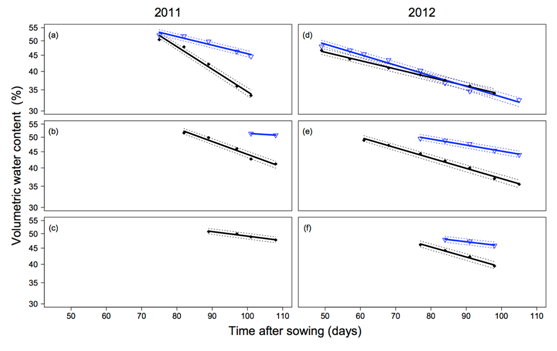
Figure 3 text description
The following are approximates:
- Figure (a) shows at 75 days both Strzelecki and QT8447 have 53% water content. At 100 days Strzelecki has 45% and QT8447 has 34%.
- Figure (b) shows Strzelecki at 100 days with 53%, and at 110 days 52%. At 82 days QT8447 has 53% and at 110 days 42%.
- Figure (c) shows QT8447 at 90 days with 53%, and at 110 days 49%.
- Figure (d) shows Strzelecki at 50 days with 50%, and at 105 days 33%. At 50 days QT8447 has 50% and at 105 days 35%.
- Figure (e) shows Strzelecki at 77 days with 50%, and at 105 days 45%. At 60 days QT8447 has 47% and at 100 days 37%. Figure (f) shows Strzelecki at 84 days with 48%, and at 100 days 45%. At 77 days QT8447 has 45% and at 100 days 40%.
In 2012, the season was drier and there was no difference in extraction between any of the cultivars from the low nematode trial (0 to 0.9 m). No difference in extraction was observed in the 0-0.3 m layer for the high nematode treatment (Figure 3d). However, extraction between Strzelecki![]() and QT8447 was significantly different in the 0.3-0.6 m and the 0.6-0.9 m layers.
and QT8447 was significantly different in the 0.3-0.6 m and the 0.6-0.9 m layers.
The extraction front velocity of a cultivar will determine the the time at which roots commenced extracting water from each depth. In 2011 Strzelecki![]() had a significantly lower (P ≤ 0.05) extraction velocity of 8 mm/day compared to QT8447 and the other cultivars with an extraction velocity of 15 mm/day (Figure 4). Similar results were experienced in 2012. However, the extraction velocity in this drier year was greater for all cultivars (Figure 4). Strzelecki
had a significantly lower (P ≤ 0.05) extraction velocity of 8 mm/day compared to QT8447 and the other cultivars with an extraction velocity of 15 mm/day (Figure 4). Similar results were experienced in 2012. However, the extraction velocity in this drier year was greater for all cultivars (Figure 4). Strzelecki![]() differed significantly from the other cultivars (P ≤ 0.05), but there was no difference in extraction between any of the other cultivars grown on either high or low nematode populations.
differed significantly from the other cultivars (P ≤ 0.05), but there was no difference in extraction between any of the other cultivars grown on either high or low nematode populations.
Figure 4. Days after sowing when soil water extraction commenced at different depths for the high nematode Formatin site in 2011 (a) and 2012 (b). The slope of the line represents the extraction front velocity (EFV) and the x axis intercept represents the date of arrival of the extraction front at a given depth. QT8447 (Solid diamond) Strzelecki![]() (Open triangles)
(Open triangles)
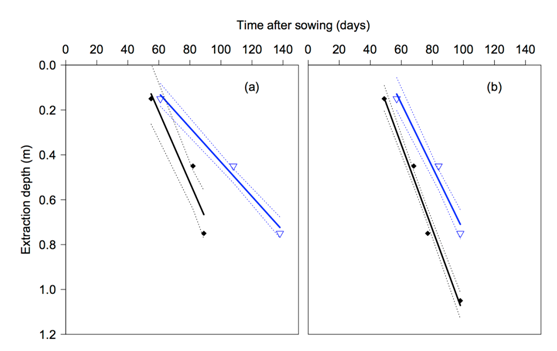
Figure 4 text description
The following are approximates:
Figure (a) 2011 shows Strzelecki at 60 days with an extraction depth of .1mm, and at 140 days 0.75mm. At 55 days QT8447 has 0.1mm and at 90 days 0.75mm. Figure (b) 2012 shows Strzelecki at 58 days with an extraction depth of 0.1mm, and at 100 days 0.75mm. At 48 days QT8447 has 0.1mm and at 100 days 1.1mm.
For soil water extraction to take place roots must be present. Root presence was measured in 2012 at the Yallaroi and Formartin sites. No significant differences were observed between any of the cultivars at either the high or low nematode sites. Overall the root count results were in contrast to the water extraction, yield and leaf area data. This suggests that nematodes impede the function of the root system more than reducing the volume of roots.
Maintaining a low nematode population improves crop yields
No difference in yield, water extraction, or leaf area was observed between any of the cultivars when planted on low nematode populations (less than 2000/kg, live counting method, 4000/kg predictaB DNA method), despite the populations increasing above the threshold before the end of the season.
What does this mean for management?
Plant tolerant cultivars
P. thornei damages plants roots and impedes their ability to take up water and nitrogen, this damage unlikely to be offset by the addition of fertiliser, irrigation or rain so will most likely reduce yield in intolerant cultivars. If you have nematodes plant tolerant varieties.
Include resistant cultivars or non host crops in the rotation
Tolerant varieties limit yield loss, but do not stop the nematode populations from increasing. Planting resistant cultivars, or non-host crops (like sorghum) in the rotation is the best way to reduce and maintain a low nematode population.
Early planting can help
Nematode reproduction is slowed under cold conditions so establishing crops early can reduce the severity of yield loss, because resources are not limited early in the crops development.
Future research
Current work is focusing on understanding how nematode population changes during the season and after the crop is harvested. The aim is to combine the population work and the crop impact work within a simulation model that is linked to APSIM. With this model it is hoped to help predict how different management strategies will affect the nematode populations.
Acknowledgements
We gratefully acknowledge contributions to this investigation by the following people: Alex Gwynne, Neil Huth, Neil Robinson, Jason Sheedy and Richard Daniel. Financial support from the Australian Grains Research and Development Corporation; Commonwealth Scientific and Industrial Research Organisation, Sustainable Agricultural Flagship and the Queensland Department of Agriculture, Fisheries and Forestry is duly acknowledged.
Contact details
Jeremy Whish
CSIRO
Ph: 07 4688 1419![]() 07 4688 1419
07 4688 1419
Fx: 07 4688 1193
Email: Jeremy.Whish@csiro.au
Reviewed by
Peter Carberry
GRDC Project Code: CES 00055,
Was this page helpful?
YOUR FEEDBACK