New and potential malting barley variety update and agronomic developments
Author: Rick Graham, Ian Menz, Nick Moody and Neroli Graham | Date: 11 Feb 2014
Rick Graham1, Ian Menz1, Nick Moody1 and Neroli Graham1
1NSW DPI Condobolin
Take home messages
- Malting accreditation typically takes two to three years to complete, it does not guarantee varietal uptake, market demand or price premiums. The agronomic adaptability and potential of a variety to achieve malt specifications will influence its adoption.
- Time of sowing (TOS) trials help to determine how a new variety compares in maturity and yield against benchmark varieties, enabling growers to better select combinations of sowing time and variety. Of the newer varieties Fathom, La Trobe and Skipper exhibited good yield potential, with the malt varieties Commander, and Scope CL and the food variety Hindmarsh performing consistently within the TOS trial at Condobolin in 2012.
- Variety specific guidelines in terms of nitrogen (N) management may be necessary for some varieties in order to maximise yield potential and increase the probability of achieving grain quality parameters. Preliminary results from trials looking at N and seed rate response, highlighted the yield and quality potential of some of the new and potential malt varieties, with varieties such as Compass and La Trobe showing good adaptability particularly in low to medium rainfall zones. Initial findings also indicated that Commander and potentially Compass may be less N responsive in terms of grain protein concentration (GPC) whilst Bass and Flinders may be more GPC responsive.
Background
The Australian barley industry is going through a period of transition, as breeding companies bring on line their next generation of malting varieties. Since 2012 six new barley varieties have received malting accreditation from Barley Australia, with a further five potential releases in the next two years, that could be grown in NSW. Due to marketing and logistical restrictions around varietal purity and segregation limitations, it is apparent that not all newly accredited malt or ‘potential malt’ varieties will be widely adopted. The malting barley industry (maltsters, brewers and marketers) would also prefer some rationalisation of the number of malting varieties. The question facing growers is which of these new malting and or food/feed varieties should I grow?
Growers need to consider both agronomic merit and market potential when making a decision to adopt a new malting variety, as the successful uptake of a variety will ultimately depend on its agronomic performance and market demand. Although market acceptance drives the successful commercialisation of a variety, poor agronomic performance limits its adoption and long-term viability. The agronomic response of a variety to management inputs (e.g. time of sowing, nitrogen fertiliser and seeding rate) particularly in terms of the probability of achieving malting specifications, will for example, affect likely adoption (Paynter et al. 2013). Likewise, varietal adaptability in terms of maintaining yield potential and grain quality receival specifications across a range of agro-ecological zones or environments will also impact on variety adoption and uptake. This paper aims to (i) provide an update on new malting, potential malt and feed barley varieties (ii) outline the potential agronomic and market fit of these varieties and (iii) present preliminary research findings and observations related to Genotype (G) x Environment (E) x Management (M) information on varieties, to assist with the development of variety specific management guidelines.
Malting barley variety update
Since 2012 six new malting barley varieties have been accredited by Barley Australia. There are also a number of cultivars currently undergoing Barley Australia malting and brewing accreditation that may become available to growers in the next two years. This commercial accreditation process typically takes two to three years to complete. Details of the process and lines undergoing evaluation can be found on the Barley Australia website; www.barleyaustralia.com.au. A list of recently accredited malting varieties and cultivars currently undergoing Barley Australia evaluation and their targeted accreditation dates are shown in Tables 1 and 2. This does not include niche malting quality, proprietary varieties such as SouthernStar and Charger, that are grown under closed loop contracts. Although it should be noted that VT Admiral; a new malting barley developed by the University of Adelaide and Joe Whites Malting (JWM) and grown under production contracts to supply JWM, is undergoing Barley Australia accreditation.
Table 1. Summary of malting varieties recently accreditated by Barley Australia
|
Variety |
Accredited |
Tested as |
Fermentability profile |
Notes |
|---|---|---|---|---|
|
Bass |
2012 |
WABAR2315 |
High |
Market Development |
|
Navigator |
2013 |
WI4262 |
Low |
Domestic malt |
|
GrangeR |
2013 |
SMBA09-3353 |
Medium |
Market Development |
|
Henley |
2013 |
NSL97-5547 |
Medium-High |
Withdrawn due to risk of blue aleurone |
|
Scope CL |
2013 |
VBHT0805 |
High |
Derived from Buloke, Imidazolinone tolerant line |
|
Westminster |
2013 |
GS5033 |
Medium-High |
Domestic and Export Malt |
Table 2. Summary of varieties undergoing malting accreditation by Barley Australia
|
Variety |
Tested as |
Year 1 status |
Year 2 status |
Target accreditation date |
Fermentability profile |
Notes |
|---|---|---|---|---|---|---|
|
Macquarie |
TI677 |
Complete |
2013 |
2014 |
Low |
Domestic, sugar adjunct |
|
Wimmera |
VB0432 |
Complete |
2013 |
2014 |
High |
Export, starch adjunct |
|
SY Rattler |
SYN0937-3 |
2013 |
|
|
Low |
Held over, domestic malt |
|
Admiral |
WI4259 |
Complete |
2013 |
2014 |
High |
Under licence to JWM |
|
Flinders |
WABAR2537 |
2013 |
|
|
Medium-High |
Export, starch adjunct |
|
La Trobe |
IGB1101 |
Complete |
2014 |
2015 |
High |
Export, starch adjunct |
|
Skipper |
WI4446 |
2013 |
|
2015 |
Medium |
Export malt, Shochu |
|
Litmus |
WABAR2625 |
2014 |
|
2016 |
|
Export, acid tolerant line |
|
Compass |
WI4593 |
2013 |
|
2015 |
Medium |
Domestic, export similar to Commander |
It is important to note that malting accreditation does not necessarily guarantee varietal adoption or market uptake. Completion of Stage 1 of the accreditation process also does not imply that a variety will meet or comply with the requirements for Stage 2. The ‘Food’ accredited variety Hindmarsh being a recent example.
Following the accreditation of a variety, there is a period of market development during which there may be a lack of clear market signals and uncertainty in market demand. During this market development or transition phase, unless there is an established niche or defined market, the expectation should be to deliver the newly accredited malting variety as feed, until there are clearer segregation, pricing and market demand signals (GIWA Barley Council, 2013). If the expectation is to deliver a malting variety for a premium, growers should refer to the Barley Australia list of ‘Preferred Varieties’ and or liaise with their preferred grain acquirer regarding market demand. GrainCorp for example, have published a list of preferred malting varieties by zones for the coming 2014/15 season.
Past experience has shown that once markets have been established, varieties with a wide agro-ecological fit or broad adaptation have achieved rapid adoption. The period from 2010 to 2013, for example can be characterised by a significant change in barley varietal sowings in southern Australia, and in particular the rapid adoption of the malting varieties Buloke and Commander and the food variety Hindmarsh. Buloke, accredited as a malting variety in 2008 now represents approximately 28% of sowings in central and southern NSW and around 10% in Victoria. Likewise in South Australia, Buloke is estimated to be around 10% of the area sown to barley. Commander released in 2009 as an accredited malt variety is now acknowledged as a dominant variety with estimates placing it at 15% of plantings in South Australia, and central and southern NSW and at 10% in Victoria. Hindmarsh which was given a food classification in 2011 has achieved widespread adoption, estimated at 50% of plantings in Victoria, 17% in South Australia and 20% in central and southern NSW.
Table 3. Grain yield (t/ha) for main season across sites analysis from 2008 to 2012 when compared to Gairdner.
|
|
North East |
North West |
South East |
South West |
||||
|---|---|---|---|---|---|---|---|---|
|
Variety |
Percent of Gairdner (%) |
Trial number |
Percent of Gairdner (%) |
Trial number |
Percent of Gairdner (%) |
Trial number |
Percent of Gairdner (%) |
Trial number |
|
Bass |
100 |
13 |
100 |
20 |
100 |
7 |
105 |
14 |
|
Baudin |
92 |
7 |
94 |
15 |
96 |
9 |
96 |
18 |
|
Buloke |
101 |
12 |
99 |
20 |
101 |
9 |
109 |
18 |
|
Commander |
107 |
16 |
107 |
25 |
107 |
9 |
110 |
18 |
|
Compass |
|
|
113 |
5 |
|
|
120 |
4 |
|
Fairview |
109 |
3 |
|
|
102 |
6 |
105 |
4 |
|
Fathom |
109 |
8 |
105 |
15 |
106 |
6 |
118 |
12 |
|
Fitzroy |
100 |
16 |
102 |
25 |
|
|
106 |
4 |
|
Flagship |
102 |
11 |
99 |
15 |
99 |
7 |
106 |
14 |
|
Flinders |
104 |
8 |
100 |
15 |
102 |
6 |
111 |
12 |
|
Gairdner |
100 |
16 |
100 |
25 |
100 |
9 |
100 |
18 |
|
GrangeR |
116 |
8 |
105 |
10 |
108 |
6 |
114 |
8 |
|
Grimmett |
96 |
16 |
93 |
25 |
|
|
|
|
|
Grout |
101 |
16 |
100 |
25 |
99 |
5 |
109 |
6 |
|
Henley |
107 |
12 |
105 |
15 |
105 |
8 |
111 |
10 |
|
Hindmarsh |
106 |
16 |
102 |
25 |
105 |
9 |
119 |
18 |
|
La Trobe |
103 |
5 |
101 |
10 |
107 |
4 |
116 |
8 |
|
Mackay |
106 |
12 |
102 |
25 |
|
|
|
|
|
Macquarie |
102 |
16 |
105 |
10 |
102 |
9 |
|
|
|
Navigator |
96 |
14 |
|
|
99 |
7 |
|
|
|
Oxford |
110 |
12 |
109 |
20 |
108 |
9 |
108 |
14 |
|
Schooner |
94 |
15 |
90 |
25 |
91 |
9 |
98 |
18 |
|
Scope CL |
102 |
12 |
99 |
20 |
101 |
8 |
109 |
14 |
|
Shepherd |
105 |
16 |
102 |
25 |
101 |
9 |
107 |
18 |
|
Skipper |
107 |
10 |
104 |
15 |
104 |
6 |
116 |
10 |
|
Tulla |
|
|
|
|
101 |
4 |
101 |
10 |
|
Urambie |
104 |
16 |
103 |
20 |
102 |
9 |
107 |
14 |
|
Westminster |
103 |
16 |
106 |
3 |
101 |
8 |
|
|
|
Wimmera |
105 |
12 |
102 |
15 |
103 |
9 |
|
|
|
Gairdner(t/ha) |
3.86 |
|
3.71 |
|
3.77 |
|
2.74 |
|
Data is sourced from the National Variety Trials; additional grain yield/quality information on varieties is available from the National Variety website at www.nvtonline.com.au
Apart from market signals there is also a need to consider the agronomic potential and or adaptation of these varieties. NVT trialling has shown that the new and potential malt varieties have yield and or grain quality advantages over current standard varieties and rival dedicated feed barley varieties. It is also important to note that some of these varieties perform very similarly agronomically in terms of G x E x M interactions and grain quality parameters, which will assist in the development of variety specific guidelines. Examples of this include Buloke and Scope CL, Hindmarsh and La Trobe and to some extent also Commander and Compass (higher yielding, targeted at low to medium rainfall zones).
Management of Barley and Barley Cultivars for the Southern Region
Management of Barley and Barley Cultivars for the Southern Region project (DAN00173); a GRDC co-funded collaborative tri-state project led by NSWDPI and including the research partners Birchip Cropping Group (BCG) and South Australian Research and Development Institute (SARDI), has been established to develop management advice and improved agronomic practices for new barley varieties. Recent research has included evaluation around agronomic fit of varieties, G x E x M responses related to time of sowing, nitrogen management and seeding rate, and weed competitiveness of varieties. Some preliminary findings from 2012 and 2013 are presented in this paper.
Time of sowing and new varieties
Time of sowing (TOS) is a major determinant of crop yield and grain quality parameters. In combination with variety, it determines timing of developmental stages and the likelihood of environmental stresses at key developmental stages, such as flowering (Fettell 2011).Varietal responses to TOS trials help to determine how a new variety compares in maturity and yield with benchmark varieties, enabling growers to better select combinations of sowing time and variety. TOS yield results for Condobolin in 2012 (Table 4), with excellent pre-sowing soil moisture (210 mm rainfall February-March) and decile 5 growing season rainfall (April to October) of 176.8 mm, showed that delayed time of sowing resulted in reduced yield potential. The decline in yield was more pronounced between TOS 2 and TOS 3. Averaged across all varieties, yield decreased by 1.53t/ha or approximately 0.5t/ha per week. It is however, important to note the response or interaction of varieties to time of sowing and to consider varietal maturity as a risk management option. That is, grain yield results showed a significant interaction (P<0.01) between variety and TOS, indicating that varieties ranked differently in response to TOS. Importantly newer varieties showed significant improvements in yield and quality parameters.
Table 4. Grain yield (t/ha) for individual varieties when sown on 7th May, 29th May and 20th June 2012 at Condobolin in 2012.
|
Variety |
|
Grain Yield (t/ha) |
|
|---|---|---|---|
|
|
7th May 2012 |
29th May 2012 |
20th June 2012 |
|
Bass |
4.75 |
3.65 |
2.13 |
|
Buloke |
4.13 |
3.93 |
2.34 |
|
Commander |
5.28 |
3.77 |
2.46 |
|
Fathom |
5.22 |
4.40 |
2.59 |
|
Fleet |
5.29 |
4.15 |
2.55 |
|
Flinders |
4.25 |
3.13 |
2.27 |
|
Gairdner |
3.85 |
3.62 |
2.09 |
|
GrangeR |
4.36 |
3.68 |
1.70 |
|
Henley |
3.44 |
4.19 |
2.23 |
|
Hindmarsh |
5.31 |
4.03 |
3.23 |
|
La Trobe |
4.44 |
4.67 |
2.61 |
|
Navigator |
3.50 |
3.49 |
2.17 |
|
Oxford |
3.74 |
2.94 |
1.67 |
|
Schooner |
4.03 |
3.58 |
1.79 |
|
Scope CL |
4.69 |
3.72 |
2.84 |
|
Shepherd |
3.60 |
3.61 |
2.36 |
|
Skipper |
5.04 |
4.28 |
2.17 |
|
Urambie |
4.06 |
3.81 |
2.28 |
|
Westminster |
3.36 |
3.66 |
1.68 |
|
Wimmera |
3.73 |
3.51 |
2.11 |
|
Mean |
4.30 |
3.79 |
2.26 |
|
LSD TOS (P=0.05) |
0.31 |
|
|
|
LSD TOS x Variety (P=0.05) |
0.75 |
|
|
Of the newer varieties Fathom, La Trobe and Skipper maintained yield potential (Table 5), with the malt varieties Commander, and Scope CL and the food variety Hindmarsh also performing consistently. Apart from yield, mean grain quality parameters averaged across the three TOS highlighted the agronomic weakness and potential of varieties. Gairdner, for example showed its agronomic issues around grain size (retentions) and to a lesser extent screenings in this environment, one of the reasons for its decline. During this transition phase where there is no dominant replacement variety, malsters are utilising a range of varieties, as Gairdner is being superseded, in order to meet their specific customers’ needs (Malteurop, pers. Comm).
Table 5. Mean predicted varietal values for grain yield (t/ha), retention (%), screenings (%), test weight (kg/hl) and thousand grain weight (g) averaged across sowing times, Condobolin in 2012
|
Variety |
Grain Yield (t/ha) |
Retention (%) |
Screenings (%) |
Test weight (kg/hl) |
Thousand grain weight (g) |
|---|---|---|---|---|---|
|
Bass |
3.51 |
92.2 |
1.3 |
69.5 |
41.8 |
|
Buloke |
3.47 |
73.7 |
2.1 |
68.0 |
43.6 |
|
Commander |
3.84 |
88.7 |
1.7 |
67.7 |
40.1 |
|
Fathom |
4.07 |
89.3 |
1.5 |
67.2 |
45.0 |
|
Flinders |
3.21 |
79.6 |
2.0 |
67.0 |
36.8 |
|
Gairdner |
3.19 |
59.5 |
3.5 |
68.6 |
39.8 |
|
GrangeR |
3.25 |
76.8 |
3.2 |
68.5 |
38.5 |
|
Hindmarsh |
4.19 |
89.0 |
1.2 |
67.0 |
39.5 |
|
La Trobe |
3.90 |
85.1 |
2.0 |
69.5 |
39.6 |
|
Navigator |
3.05 |
85.1 |
1.6 |
69.4 |
38.2 |
|
Schooner |
3.13 |
72.9 |
2.6 |
68.6 |
38.9 |
|
Scope CL |
3.75 |
85.6 |
1.3 |
69.3 |
44.7 |
|
Skipper |
3.83 |
86.3 |
1.6 |
68.7 |
40.2 |
|
Westminster |
2.90 |
79.9 |
2.1 |
69.3 |
39.8 |
|
Wimmera |
3.12 |
85.5 |
2.0 |
68.8 |
39.6 |
|
Mean |
3.45 |
78.9 |
2.6 |
68.3 |
40.4 |
|
LSD (P=0.05) |
0.43 |
6.01 |
1.14 |
0.44 |
1.06 |
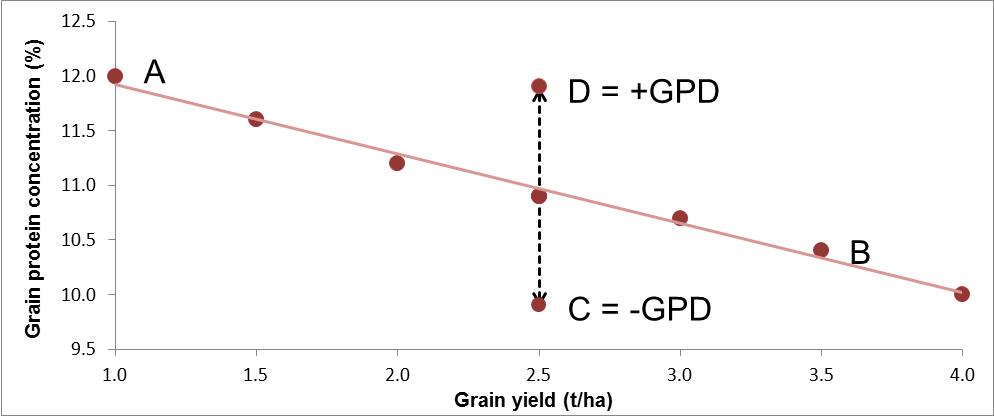
Figure 1. Grain Protein Deviation (GPD) – illustrating varieties expressing either a negative (C) or (D) positive GPD (Paynter and van Burgel 2014).
Nitrogen management in barley
To achieve malt specifications, growers in southern Australia need to meet strict industry grain protein concentrations of between 9.0 to 12.0% (dry basis). A question often asked by growers is, how do barley varieties differ in their GPC and response to nitrogen (N) management? Recent studies by Porker and Wheeler (2013) and Paynter and van Burgel (2014) incorporating South Australian and Western Australia NVT data sets respectively, were able to show that varieties do differ in GPC. Looking at grain protein deviation, defined as the deviation from the regression line for grain yield and GPC (Figure 1) both groups were able to show that Buloke, and Commander, achieved a lower GPC for a given yield level. Whilst, varieties such as Flinders, and Bass, may be high grain protein accumulators (Figure 2).
Table 6. Predicted mean varietal values for yield (t/ha), protein (%), screenings (%), retention (%), test weight (kg/hl) and thousand gain weight (g) from across site analysis.
|
Variety |
Yield (t/ha) |
Protein (%) |
Screenings (%) |
Retention (%) |
Test Weight (kg/hl) |
Thousand Grain Weight (g) |
|---|---|---|---|---|---|---|
|
Bass |
4.15 |
11.14 |
0.56 |
92.36 |
70.17 |
43.08 |
|
Buloke |
4.12 |
10.82 |
1.07 |
81.34 |
68.50 |
46.71 |
|
Commander |
4.19 |
10.54 |
1.72 |
87.75 |
67.01 |
41.63 |
|
Flinders |
4.11 |
11.15 |
1.09 |
89.98 |
69.51 |
42.52 |
|
GrangeR |
4.20 |
10.56 |
1.03 |
90.22 |
69.02 |
41.92 |
|
La Trobe |
4.64 |
10.33 |
0.90 |
91.16 |
69.36 |
41.84 |
|
Skipper |
4.11 |
11.01 |
0.68 |
93.81 |
68.94 |
43.78 |
|
Wimmera |
4.00 |
11.16 |
1.18 |
89.82 |
68.71 |
40.73 |
|
LSD (P=0.05) |
0.16 |
0.31 |
0.72 |
4.71 |
0.50 |
0.84 |
Graham et al. (2013) in a collaborative trial series, involving the GRDC funded Management of Barley and Barley Cultivars in Western Australia (DAW00224) and the Management of Barley and Barley Cultivars for the Southern Region (DAN00173) projects, initiated to compare yield and quality responses of potential malt varieties likely to be grown nationally, under a range of management practices, also observed that varieties did appear to differ in their GPC response to applied N. In the study, eight varieties, selected with a national rather than a regional focus, were sown across five locations (Walebing, Katanning and Gibson from WA, and Condobolin and Parkes from NSW). The varieties selected were Bass, Flinders, GrangeR, La Trobe, Skipper and Wimmera, with Buloke and Commander included as controls. At each site, varieties were sown with factorial combinations of three seed rates (targeting 75, 150 and 300 plants/m2) and three N fertiliser rates (0, 30 and 90 kg N/ha). Grain yield and quality parameters were measured using commercial receival methods, with differences between varieties observed. Results from this trial summarised in Table 6 showed that on limited data, varieties appeared to differ in their GPC response to applied N, Commander being less responsive and Bass more responsive. La Trobe on the other hand appeared to follow the classic yield dilution response or negative correlation between grain yield and GPC; following the regression line it also exhibited a significant yield advantage over the other cultivars. Overall, Bass exhibited a significantly higher test weight than Commander, while both Bass and Skipper achieved better grain size, lower screenings and higher retentions.
Table 7. Predicted varietal values for grain yield (t/ha), grain protein (%), retention (%), screenings (%), test weight (kg/hl) and thousand grain weight (g) for the Barley National Trial conducted at Parkes in 2013, across all treatments
|
Variety |
Grain Yield (t/ha) |
Grain Protein (%) |
Retention (%) |
Screenings (%) |
Hectolitre weight (kg/hl) |
Thousand grain weight (g) |
|---|---|---|---|---|---|---|
|
Bass |
3.72 |
13.9 |
97.9 |
0.3 |
71.9 |
49.0 |
|
Buloke |
4.09 |
12.7 |
94.6 |
0.6 |
71.9 |
52.8 |
|
Commander |
4.62 |
11.4 |
96.7 |
0.7 |
71.1 |
49.4 |
|
Compass |
4.77 |
11.1 |
98.3 |
0.3 |
70.5 |
51.6 |
|
GrangeR |
4.35 |
12.2 |
96.0 |
0.5 |
71.7 |
47.8 |
|
La Trobe |
4.59 |
12.1 |
96.3 |
0.6 |
72.8 |
46.4 |
|
Skipper |
4.36 |
13.1 |
98.0 |
0.3 |
72.1 |
49.2 |
|
Wimmera |
3.90 |
12.0 |
93.9 |
0.7 |
66.1 |
44.8 |
|
Mean |
4.30 |
12.3 |
96.5 |
0.5 |
71.0 |
48.9 |
|
LSD (P=0.05) |
0.26 |
0.37 |
1.32 |
0.19 |
0.45 |
0.79 |
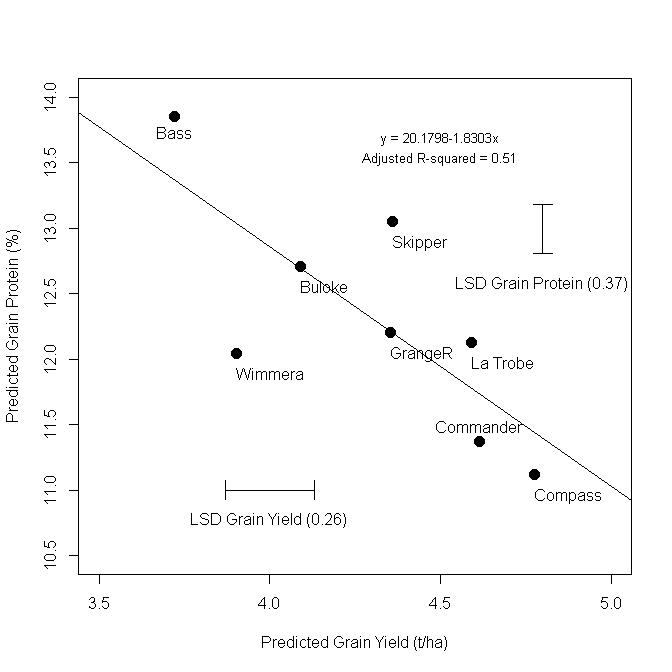
Figure 2. Linear relationship between predicted grain yield (t/ha) and grain protein (%) for eight varieties grown at Parkes 2013.
In 2013 the collaborative trial series (also referred to as the Barley National Trial) was repeated at both Parkes and Condobolin. The Parkes trial was sown on 31st May, and had a relatively high starting mineral N value of 112kg/ha (0-60cm). Despite this, both Compass and Commander were both within GPC specifications, and appeared to perform similarly in terms of yield and grain quality parameters, both showing that they may be less protein responsive than varieties such as Bass. It was interesting to note that at Condobolin (data not shown) with a late sowing (21st June) Compass (76.5%) was able to achieve the Grain Testing Australia quality retention standards whereas Commander (67.5%) was outside malt specifications.
Preliminary results from these trials have highlighted the yield and quality potential of some of the new and potential malt varieties, with varieties such as Compass and La Trobe, showing good adaptability particularly in low to medium rainfall zones. These trials have provided valuable environment by management information (G x E x M) for all varieties tested, helping to develop management guidelines so as to enhance adoption and agronomic potential. It is already apparent that variety specific guidelines in terms of N management may be necessary for some varieties in order to maximise yield potential and increase the probability of achieving grain quality specifications. Initial findings have indicated that Commander and potentially Compass may be less N responsive in terms of GPC whilst Bass and potentially Flinders may be more GP responsive.
References
Fettell N. (2011) ‘Sowing times critical to maximise barley yields’. Farming Ahead April 2011 No. 231 pp 64-66 www.farmingahead.com.au
GIWA Barley Council (2013) ‘Western Australian Malting Barley Varietal Recommendations for the 2014/15 Harvest, 26 August, 2013
Graham R, Paynter B, Fettell N, Gardner M, Porker K, Hills A, Malik R, Craig S, Moody N, Graham N (2013) Yield and quality responses of potential malting barley varieties of national significance. Proceedings of 16th Australian Barley Technical Symposium, 8-11 September 2013, Melbourne, Victoria.
Paynter B, van Burgel A (2014) Barley cultivars differ in their protein concentration. GRDC Crop Updates, Perth February, 2014 pp. 4 in press
Paynter B, Hills A, Malik R, McLarty A (2013) Sensitivity of Barley Varieties to Crop Management. GRDC Crop Updates, Perth 25-26 February, 2013. pp. 4
Porker K, Wheeler R (2013) Managing grain protein; variety specific responses to nitrogen. Proceedings of 16th Australian Barley Technical Symposium, 8-11 September 2013, Melbourne, Victoria.
Acknowledgements
The contributions of Daryl Reardon, Katrina Thomas and Linda Brangwin are gratefully acknowledged for their technical support in conducting these trials. Dr Neil Fettell is also acknowledged for his contribution to this project.
Contact details
Rick Graham
NSW Department of Primary Industries
Condobolin Agricultural Research Station, PO Box 300, Condobolin NSW 2877
02 6895 1009
GRDC Project Code: DAN00173,
Was this page helpful?
YOUR FEEDBACK