Modelling gross margins and potential nitrogen exports from cropland in south eastern Australia
Author: David Nash, Penny Riffkin, Robert Harris, Alan Blackburn, Cam Nicholson and Mark McDonald | Date: 26 Jul 2013
David Nasha, Penny Riffkinb, Robert Harrisb, Alan Blackburnc, Cam Nicholsond and Mark McDonalde.,
a Victorian Department of Environment and Primary Industries, Ellinbank; b Victorian Department of Environment and Primary Industries, Hamilton; c Alan Blackburn and Associates Consulting, Geelong; d Nicon Rural Services, Queenscliff; e Southern Farming Systems, Newtown; current address: Marjeny Rural, Meredith.
Project codes: Grains Research and Development Corporation (DAV00059); Victorian Department of Environment and Primary Industries (CMI 100127)
Keywords: nitrogen, exports, cropping, south-eastern Australia, wheat, APSIM, Bayesian Network, gross margins
Take home messages:
- Is fertiliser the only thing to consider?: Plants take up nutrients from soil water, and therefore, nutrients are exported from all plant production systems into drainage. The extra water used by a well grown crop can reduce drainage volumes and reduce nitrogen exports, even if fertiliser is used to achieve that extra growth.
- What is the optimum fertiliser nitrogen application rate at planting?: The lowest upfront application of nitrogen that facilitates reasonable crop establishment and yield potential minimises nitrogen exports, minimises sunk costs (i.e. costs which cannot be recovered) in the case of an adverse season, and allows the farmer the flexibility to adjust their fertiliser strategy, and therefore, potential gross margins in response to seasonal conditions.
- Can I run a successful business and still be environmentally responsible? In many cases the lowest nitrogen exports are likely to be associated with the highest gross margins. Farmers who aim to maximize their gross margins, compared to simply maximizing yields, appear to be simultaneously lowering the risk of nitrogen exports.
Introduction
Nitrogen (N) and phosphorus (P) exported from cropping land can adversely affect receiving waters (European Union, 2000; Granlund et al., 2005; USEPA, 1996). As a result, cropping systems have been developed that increase grower earnings and reduce environmental impacts, compared to previous systems (Cannell and Hawes, 1994; Di Pietro, 2001). In south-eastern Australia extensive grazing land is being converted to broad-acre, high rainfall (>550 mm) cropping. This land use change has most likely increased N exports to surface waters from both conventional and raised–bed cropping systems (Johnston, 2006) and reduced tourism revenues (Read Sturgess and Associates, 1999). However, the most appropriate way of mitigating N exports from high rainfall cropping remains unclear.
High rainfall cropping systems generally embrace minimal or no tillage and retention of plant residues to reduce soil structural degradation and minimise the export of sediment bound nutrients (Holland, 2004). Consequently, nutrients such as N, that may be exported dissolved in water (i.e. nitrate), often comprise a larger proportion of total exports when compared with systems using deep cultivation (>250 mm) (Kimmell et al., 2001). The higher proportions of dissolved nutrients from conservation tillage systems may be the result of better soil structure and improved infiltration, the accumulation of nutrients in surface soil (Mathers and Nash, 2009; Sharpley and Smith, 1994; Vu et al., 2009) and less adsorption of dissolved nutrients in transit (Sharpley, 1980).
Bayesian Networks are a technology, based on well-established rules of conditional probability, that can be used to investigate nutrient exports. Nash et al. (2010) developed a Bayesian Network for comparing dissolved N exports from high rainfall cropping. The network combined farmer experience (collected at workshops) and experimental data into a conceptually sound model that links key management decisions to N exports (and the associated uncertainty).
In this study we use a slightly modified Bayesian Network (Nash et al., 2010), the APSIM (Keating et al., 2003) crop production model, and gross margin analyses to investigate N export risk, crop yields and gross margins of wheat crops in the Dunkeld region of south-eastern Australia. Our aim was to develop economically and environmentally sound recommendations for managing N fertilisers.
Materials and Methods
The study area was located at Dunkeld (142o34'E, 37o65’S) in south-eastern Australia. Dunkeld receives >620 mm of rainfall in most years with highest falls in late winter and early spring. Mean monthly maximum and mean monthly minimum temperatures are highest in summer (i.e. >26oC in February) and lowest in winter. Soil profiles in the area are characterised by a fine sandy/silty clay loam to 250 mm overlying a heavy clay.
The crop/fertiliser management strategies we tested were selected in consultation with farmers from the region. The attributes of three wheat varieties commonly grown in the Dunkeld region were used for the simulations. The varieties were Silverstar![]() (a short season wheat), Chara
(a short season wheat), Chara![]() (a wheat variety with a mid-length growing season) and Mackellar
(a wheat variety with a mid-length growing season) and Mackellar![]() (a long season variety). These varieties have approximate growing seasons of 195, 220 and 250 days, respectively. The simulations were undertaken using three levels of soil N at sowing and ten fertiliser management strategies which encompassed the full range of N fertiliser management strategies (Table 1) that might be expected in this region. Low, Medium and High N at sowing corresponded to <50, 50-100 and >100 kg of inorganic N per hectare (0-600 mm sampling depth). Seasonal N fertiliser application rates were 10, 35, 60 and 110 kg N/ha and fertiliser was assumed to be applied at: (i) sowing (minimum 10 kg N/ha); (ii) at first node stage, 84, 100 and 122 days after sowing for Silverstar
(a long season variety). These varieties have approximate growing seasons of 195, 220 and 250 days, respectively. The simulations were undertaken using three levels of soil N at sowing and ten fertiliser management strategies which encompassed the full range of N fertiliser management strategies (Table 1) that might be expected in this region. Low, Medium and High N at sowing corresponded to <50, 50-100 and >100 kg of inorganic N per hectare (0-600 mm sampling depth). Seasonal N fertiliser application rates were 10, 35, 60 and 110 kg N/ha and fertiliser was assumed to be applied at: (i) sowing (minimum 10 kg N/ha); (ii) at first node stage, 84, 100 and 122 days after sowing for Silverstar![]() , Chara
, Chara![]() and Mackellar
and Mackellar![]() , respectively; or (iii) at fully emerged flag leaf stage 130, 150 and 180 days after sowing, the latter being Growth Stages 31 and 39 (GS31 and GS39), respectively (Zadoks et al., 1974). Aside from the 10 kg N/ha applied at sowing all applications were multiples of either 25 kg N/ha or 50 kg N/ha.
, respectively; or (iii) at fully emerged flag leaf stage 130, 150 and 180 days after sowing, the latter being Growth Stages 31 and 39 (GS31 and GS39), respectively (Zadoks et al., 1974). Aside from the 10 kg N/ha applied at sowing all applications were multiples of either 25 kg N/ha or 50 kg N/ha.
Table 1. Fertiliser management strategies used to compare economic and environmental attributes of wheat crops in the Dunkeld region.
|
Abbreviated Management Strategy |
Fertiliser Application at Sowing (kg N/ha) |
Fertiliser Application at GS31a (kg N/ha) |
Fertiliser Application at GS39a (kg N/ha) |
Total Fertiliser Application Rate (kg N/ha) |
|---|---|---|---|---|
|
D0 0Na |
10 |
0 |
0 |
10 |
|
D0 25N |
35 |
0 |
0 |
35 |
|
D0 50N |
60 |
0 |
0 |
60 |
|
D0 100N |
110 |
0 |
0 |
110 |
|
GS31 25N |
10 |
25 |
0 |
35 |
|
GS31 50N |
10 |
50 |
0 |
60 |
|
GS31 100N |
10 |
100 |
0 |
110 |
|
GS39 25N |
10 |
0 |
25 |
35 |
|
GS39 50N |
10 |
0 |
50 |
60 |
|
GS39 100N |
10 |
0 |
100 |
110 |
|
D0 25N GS31 25N |
35 |
25 |
0 |
60 |
|
D0 50N GS31 50N |
60 |
50 |
0 |
110 |
|
GS31 25N GS39 25N |
10 |
25 |
25 |
60 |
|
GS31 50N GS39 50N |
10 |
50 |
50 |
110 |
a D0 = Sowing, GS31 = Growth Stage 31, GS39= Growth Stage 39 (Zadoks et al., 1974), XXN=kg N/ha applied
Bayesian Network
The Bayesian Network used in this study is presented in Figure 1. The network development process and basic structure are described elsewhere (McDowell et al., 2009; Nash et al., 2010). It was an annual model and applied at the “field scale” where a field is defined as an area with similar physical attributes (i.e. soil type, slope) that is treated by the land manager as a single management unit.
Where possible, the network was developed using experimental data. However, in the absence of such information, expert opinions were used to populate the conditional probability tables that underpin the network structure (i.e. given one set of conditions, what is the chance of another condition occurring). Five types of nodes (variables) were used:
- Site Variables were the physical attributes of the site in question and over which the manager has little or no control (i.e. inherent soil properties);
- Year Variables depended on chance events, most often rainfall characteristics, and changed annually;
- Management Variables were those which were under land manager control, most notably Crop Type, Fertiliser Type at Sowing, Fertiliser Rate at Sowing etc.;
- Intermediate Variables were defined as factors that combine the effects of Site, Year and Management Variables to describe aspects of N exports; and
- The Outcome Variable (Dissolved N Load Factor) describes the range of N exports that may be expected from fields (i.e. paddocks) at Dunkeld (Figure 1).
The network had six main components: two transport factors (a) Surface Drainage and (b) Sub-Surface Drainage; and four source factors: (c) Soil; (d) Plant; (e) Sowing Fertiliser; and (f) Within Season Fertiliser. Using the NETICA® (Norsys Software Corp., Vancouver, Canada) software the “State” descriptor (i.e. range of possible outcomes) for each “Node” (i.e. box) and the probabilities of each State are represented both numerically and by the horizontal column graph. For continuous distributions, the mean (i.e. estimated average) is presented below the column graph along with the standard deviation (Figure 1).
Crop yield modelling
The APSIM model (Keating et al., 2003) is a crop model used in many regions of Australia. In this study crop yields were estimated in the absence of frost damage, water-logging, crop disease and competition from weeds and it was assumed that N was the limiting nutrient (i.e. phosphorus, potassium, sulphur and trace elements were not limiting). It was also assumed that none of the wheats were grazed. Crop production was modelled assuming similar sowing conditions each year for 120 years using climate data from 1889 to 2008. For each simulation run (i.e. year of climate data), initial soil water, soil mineral N (NO3- and NH4+) for the respective high, medium and low soil N scenarios and surface organic matter were reset to the initial values. The sowing dates were assumed to be June 15, May 15 and April 1 for Silverstar![]() , Chara
, Chara![]() and Mackellar
and Mackellar![]() , respectively. The crop spacing was assumed to be 150 mm, crop sowing depth 25 mm and the crop density 200 plants/m2. It was assumed that the wheat crop followed a canola crop which left a non-standing residue of 1000 kg/ha with a C:N ratio of 80.
, respectively. The crop spacing was assumed to be 150 mm, crop sowing depth 25 mm and the crop density 200 plants/m2. It was assumed that the wheat crop followed a canola crop which left a non-standing residue of 1000 kg/ha with a C:N ratio of 80.
Gross margin analyses
The input costs used for the gross margin analyses are presented in Table 2. The gross margin analyses assumed that the same inputs were required for each wheat variety. There may be some differences in herbicide and fungicide use between varieties when they are used in the field depending on the climatic conditions, which affect fungal infestations, and potential competition from weeds. For example, a short-season variety such as Silverstar![]() is sown later so spraying can be delayed and the need for fungicide is related to breeding. Nitrogen fertiliser costs were based on a urea price of $700/t. Since urea is 46% N the assumed N price was $1522/t.
is sown later so spraying can be delayed and the need for fungicide is related to breeding. Nitrogen fertiliser costs were based on a urea price of $700/t. Since urea is 46% N the assumed N price was $1522/t.
The wheat prices used in these analyses depended on the variety. Mackellar![]() is a ‘red’ wheat and therefore used for animal feed, whereas Silverstar
is a ‘red’ wheat and therefore used for animal feed, whereas Silverstar![]() and Chara
and Chara![]() are potentially bread wheats. However, when grown in the Dunkeld region Silverstar
are potentially bread wheats. However, when grown in the Dunkeld region Silverstar![]() and Chara
and Chara![]() do not always achieve the necessary quality standards and are sometimes sold as feed wheat. Consequently a $20 /t premium was assumed for Silverstar
do not always achieve the necessary quality standards and are sometimes sold as feed wheat. Consequently a $20 /t premium was assumed for Silverstar![]() and Chara
and Chara![]() ($220 /t) and a wheat price of $200 /t was assumed for Mackellar
($220 /t) and a wheat price of $200 /t was assumed for Mackellar![]() .
.
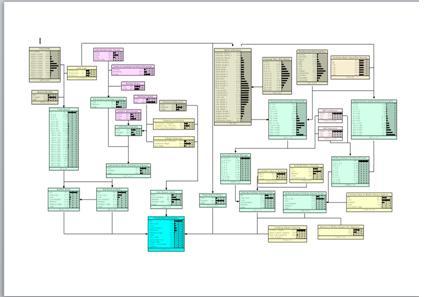
Figure 1. Bayesian Network used to estimate the impact of various management strategies on nitrogen exports from high rainfall cropping in south-eastern Australia.
Summary of results
Yields
- Estimated yields increased (P<0.001) from 3222 to 4329, 5002 and 5716 kg/ha as N applications increased from 10 to 35, 60 and 110 kg N/ha.
- Estimated yields increased from 3840 to 5107 and 6010 kg/ha for low, medium and high initial soil N, respectively.
- Overall, the modelling suggested that irrespective of fertiliser application rates, crops grown on soils with higher initial N concentrations are generally higher yielding.
Gross Margins
- The outcomes of gross margins were similar to those for yields with a slight variation primarily due to the wheat prices.
- The overall gross margin was $522/ha.
- Gross margins increased with fertiliser application rate from 264 to 444, 539 and 602 $/ha for the 10, 35, 60 and 110 kg N/ha application rates
- The gross margins for low, medium and high initial soil N were 297, 546 and 723 $/ha respectively.
- The gross margins for Silverstar
 , Chara and Mackellar were 526, 608 and 431 $/ha, respectively.
N Export Risk
- The mean Dissolved N load Factor (i.e. the estimated N exports) was 2.1, with Silverstar, Chara and Mackellar having 2.3, 1.7 and 2.4, respectively.
- The Dissolved N Load Factor decreased with increasing initial soil fertility (4.0, 2.0 and 0.4 for the low, medium and high initial soil N respectively).
- The Dissolved N Load Factor decreased with increasing applied N (4.4, 3.2, 2.2 and 1.0 for 10, 35, 60 and 110 Kg N/ha, respectively), presumably reflecting the importance of transport factors (i.e. the factors affecting the amount of water exported from a paddock).
These results imply that the reductions in drainage volumes from improved crop growth, which are linearly related to N exports at constant N concentrations, have a greater impact on N exports than the increased N concentrations resulting from the additional fertiliser N applications used to achieve that extra growth.
Discussion
An important question in the context of these findings is: How much do the assumptions underlying the APSIM modelling affect the estimates of environmental risk through the transport factor and also gross margins? There was no general trend relating estimated crop yield to annual rainfall. However, frost damage, crop diseases, water-logging and weeds are four factors affecting yield that were not considered in the APSIM modelling. Frost damage occurs late in the season, affects grain set and affects good and poor crops equally. It follows that yields estimated by APSIM would overestimate gross margins but not necessarily plant water use where it is the vegetative growth of the crop, rather than simply grain yield, which is best correlated with water use. Similarly, crop diseases would also be expected to adversely affect both good and poor crops in the Dunkeld region. However, the impact of disease on the Dissolved N Load Factor and potential yield would depend on the particular pathogen. Some pathogens only affect the plant at grain filling. It follows crop diseases are likely to have a bigger effect on gross margins than the estimated plant water use and therein a limited effect on the Dissolved N load Factor.
Water-logging and competition from weeds on the other hand are two factors that indirectly affect yield through impaired vegetative growth. In the case of weed competition, potential crop yield from APSIM probably provides a better estimate of total plant water use (i.e. weeds and crop) and therefore N export risk, than an actual crop yield. However, the effects of weed competition are likely to be more acute in poor crops suggesting the APSIM data will overestimate the yield used for gross margin analyses at lower fertiliser application rates. The extent to which water-logging adversely affects crop growth and ultimately yield depends on when it occurs. Water-logging can kill sections of the crop and as a result of de-nitrification, water-logged crops commonly suffer from N deficiency (Mark McDonald, personal communication, March 2010). It is common practice in the Dunkeld region for farmers to apply N to previously water-logged fields to stimulate plant growth, plant water use, and ultimately, achieve profitable yields. This implies that while water-logging would lead to overestimation of crop water use and gross margins, that overestimation will be greatest for the low initial N status soils and treatments where most N is applied at sowing.
Fertiliser recommendations
Recommendations for fertiliser management based on the data collected during this study are presented in Table 2. While in many cases the lowest N export risks were associated with the highest gross margins, to assist interpretation, the Gross Margin divided by the Dissolved N Load Factor was used to develop a “Sustainability Rating” which incorporated environmental and economic elements ($/unit of Environmental Impact). In general the recommendations were derived firstly by comparing the Sustainability Ratings of the different strategies for applying 10, 35, 60 or 110 kg N/ha to each wheat variety and at each soil N level. Then strategies were compared between fertiliser application rates to develop an overall recommendation for each wheat variety by initial soil N combination. Where Sustainability Ratings were similar and differences between strategies were minimal (i.e. c. ±0.5 Dissolved N Load Factor or c. ±$50 Gross Margin) the effects of the discretisation of yield in the Bayesian Network and associated error (Nash and Hannah, 2011) was considered and preference was given to strategies that minimised N applications at sowing.
In practice the marginal returns from crops depends on the moisture available for crop growth, possible adverse effects of water-logging, pests, pathogens, weed competition, etc. and the costs of remedial measures. While these factors were not considered in the APSIM simulations, all are generally expressed post-sowing. It follows that the lowest upfront application of N that facilitates reasonable crop establishment and yield potential will minimise N exports, minimise sunk costs (i.e. costs which cannot be recovered) in the case of an adverse season, and allow the farmer the flexibility to adjust their fertiliser strategy, and therefore, potential gross margins in response to seasonal conditions.
For low soil N and irrespective of the wheat variety, this study suggests 60 kg N/ha at sowing and a 50kg N/ha application at GS31 (i.e. 110 kg N/ha over the season) is generally the best option. Presumably that is the result of establishing a healthy crop on an N deficient soil which maximizes water use in later stages of crop growth. An option that was not explored in this study but which may assist management flexibility at sites with low soil N is an initial application of 35 kg N/ha followed by one or more 25 or 50 kg N/ha applications of fertiliser at GS31 and/or GS39.
For both the medium N and high N soils, this study would suggest that applying additional N in split applications post sowing (i.e. 25 kg N/ha at both GS31 and GS39 to give a total application of 60 kg N/ha for the season) is generally the best option for Silverstar![]() and Chara
and Chara![]() . Depending on the season, post sowing applications can be adjusted as necessary to enhance gross margins. On medium N soils, for the long season Mackellar
. Depending on the season, post sowing applications can be adjusted as necessary to enhance gross margins. On medium N soils, for the long season Mackellar![]() , an additional 50 kg N/ha at sowing (i.e. 60 kg N/ha at sowing) and an additional 50 kg N/ha at GS31 (to give season total of 110 kg N/ha) was the best option (+$68 /ha). The next highest gross margins (and environmental outcomes) for Mackellar
, an additional 50 kg N/ha at sowing (i.e. 60 kg N/ha at sowing) and an additional 50 kg N/ha at GS31 (to give season total of 110 kg N/ha) was the best option (+$68 /ha). The next highest gross margins (and environmental outcomes) for Mackellar![]() were an additional 100 kg N/ha at sowing (i.e. 110 kg N/ha at sowing) or at GS39 (i.e. 10 kg N/ha at sowing and 100 kg N/ha at GS39) or 100 kg N/ha split between GS31 and GS39 (i.e. 10 kg N/ha at sowing and 50 kg N/ha at both GS31 and GS39). Mackellar
were an additional 100 kg N/ha at sowing (i.e. 110 kg N/ha at sowing) or at GS39 (i.e. 10 kg N/ha at sowing and 100 kg N/ha at GS39) or 100 kg N/ha split between GS31 and GS39 (i.e. 10 kg N/ha at sowing and 50 kg N/ha at both GS31 and GS39). Mackellar![]() seems to have a high N requirement overall and the higher N requirement of Mackellar
seems to have a high N requirement overall and the higher N requirement of Mackellar![]() was also evident for crops grown on the high N soils. Again the best strategy was an additional 50 kg N/ha at sowing and again at GS31 (+$54 compared to next best option).
was also evident for crops grown on the high N soils. Again the best strategy was an additional 50 kg N/ha at sowing and again at GS31 (+$54 compared to next best option).
Table 2. Analyses of gross margins and environmental performance of different wheat varieties, fertiliser application rates and fertiliser application strategies using data derived from APSIM modelling and the use of a cropping Bayesian Network.
|
Crop |
Soil N |
Total fertiliser N added (kg/ha) |
Gross Margin (GM) ($/ha) |
Environmental Impact (EI) as estimated by Dissolved N Load Factor (unitless) |
Sustainability Rating (GM/EI) |
Recommendation |
|---|---|---|---|---|---|---|
|
Silverstar
|
Low |
110 |
526 |
1.1 |
470 |
An additional 50 kg N/ha at sowing and an additional application (50 kg N/ha) at GS31.a |
|
Med |
50
110 |
645
694 |
0.2
0.2 |
>3000
>3000 |
Two post-sowing applications of fertiliser (25 kg N/ha) OR An additional 50 kg N/ha at sowing and an additional application (50 kg N/ha) GS31. |
|
|
High |
50 |
757 |
0.2 |
>3000 |
Sowing N (10 kg N/ha) and two post sowing applications of fertiliser (25 kg N/ha). |
|
|
Chara
|
Low |
110 |
576 |
1.1 |
505 |
An additional 50 kg N/ha at sowing and an additional application (50 kg N/ha) at GS31. |
|
Med |
50
110 |
750
780 |
0.2
0.0 |
>3000
>3000 |
Two post-sowing applications of fertiliser (25 kg N/ha) OR Two post-sowing applications of fertiliser (50 kg N/ha). |
|
|
High |
50 |
873 |
0.0 |
>3000 |
Two post sowing applications of fertiliser (25 kg N/ha). |
|
|
Mackellar
|
Low |
110 |
392 |
1.0 |
384 |
An additional 50 kg N/ha at sowing and an additional application (50 kg N/ha) at GS31. |
|
Med |
110 |
594 |
0.0 |
>3000 |
An additional 50 kg N/ha at sowing and an additional application (50 kg N/ha) at GS31. |
|
|
High |
60 |
778 |
0.0 |
>3000 |
An additional 50 kg N/ha at sowing and an additional application (50 kg N/ha) at GS31. |
a GS31 = First node stage or Growth Stage 31 (Zadoks et al., 1974)
But wait, there’s more!
The general relationships between the N export risk (Dissolved N Load Factor) and two economic performance measures, crop yields and gross margins, are presented in Figure 2. Both are inverse relationships implying that lower N exports are generally associated with higher yields and higher gross margins. From a management perspective those relationships imply that where farmers improve their productivity they are simultaneously lowering the risk of N exports. This is consistent with the sensitivity analysis of the network and suggests that generally where additional N fertiliser is used to improve crop yields and gross margins, the increased N availability in the form of a larger fertiliser source factor has less impact on N exports than the subsequent water use has on overall N transport.
The increased slope of the relationship between the Dissolved N Load Factors and gross margins compared to the relationship between Dissolved N Load Factors and yields implies that increased fertiliser efficiency gives a proportionally larger additional environmental benefit if farmers aim to maximize their gross margins, compared to simply maximizing yields. Pursuit of maximum yield, irrespective of the marginal returns on inputs such as fertiliser that adversely affect environmental outcomes, is likely to lower gross margins. It follows that farmers who aim to maximize their gross margins are simultaneously minimising the risk of N exports. Factors such as the costs of fertiliser use (including the cost of the fertiliser itself and spreading costs) and the prices received for produce affect marginal returns, and consequently, the slope of the relationship between N export risk and gross margins and the degree to which maximizing gross margins will maximize environmental benefits.
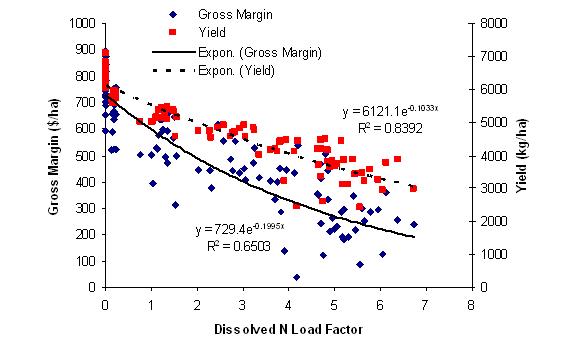
Figure 2 . Plots of estimated average annual yields and gross margins against estimate environmental impact (Dissolved N Load Factor) from Dunkeld in south-eastern Australia with data for the low initial soil N, 10 kg N/ha at sowing options.
A note of caution
While the Dunkeld site is representative of the high rainfall cropping zone of south-eastern Australia, care needs to be exercised in generalising the results of this simulation study. Changes to the input data used in the environmental and production modelling, for example, rainfall distribution, sowing dates, fertiliser prices and crop prices, are likely to affect the N export risk, marginal returns and optimum fertiliser management strategy. Only a limited range of management strategies were tested. Moreover, while there were some limited field data from the area that could be used to assist APSIM modelling, there were no such data that could be used for independently validating the Bayesian Network.
Acknowledgements
This work was co-funded by the Department of Environment and Primary Industries (CMI 100127) and the Grains Research and Development Corporation (DAV00059). The authors would also like to thank Southern Farming Systems and Roger Armstrong, Tim Johnston, Gary O'Leary, Malcolm McCaskill, Mark Watkins, Peter Dixon and Peter Moate of the Department of Primary Industries, Gerard Bibby of GrainCorp Operations Limited, Dr Ann Nicholson from Bayesian Intelligence Pty. Ltd. and the numerous farmers and farm service providers who contributed to this work. This paper is dedicated to the memory of Dr George Riffkin whose mentoring of scientists at DEPI will be missed.
References
Ames D. (2002) Bayesian decision networks for watershed management, Civil and Environmental Engineering, Utah State University, Logan, Utah, USA. pp. 250.
Ames D., Neilson B.T. (2001) A Bayesian Decision Network Engine for Internet-Based Stakeholder Decision-Making. In: ASCE World Water and Environmental Resources Congress, Orlando, Florida.
Buczko U., Kuchenbuch R.O. (2007) Phosphorus indices as risk-assessment tools in the U.S.A. and Europe - a review. Journal of Plant Nutrition and Soil Science 170:445-460.
Cain J.D. (2001) Planning improvements in natural resource management. Guidelines for using Bayesian networks to support planning and management development programmes in the water sector and beyond. , Centre for Ecology and Hydrology, Wallingford, UK.
Cannell R.Q., Hawes J.D. (1994) Trends in tillage practices in relation to sustainable crop production with special reference to temperate climates. Soil and Tillage Research 30:245-282.
Clough A., Riffkin P.A., Harris R.A., O'Leary G., Potter T., Dean G., Nuttall J. (2010) Crop model performance and data for the high rainfall zone of south-eastern Australia, DPI Technical Report, Victorian Department of Primary Industries, Melbourne, Australia. pp. 93.
DeLaune P.B., Moore P.A., Carman D.K., Sharpley A.N., B.E. H., Danial T.C. (2004) Development of a phosphorus index for pastures fertilized with poultry litter - factors affecting phosphorus runoff. Journal of Environmental Quality 33:2183-2191.
Di Pietro F. (2001) Assessing ecologically sustainable agricultural land-use in the Central Pyrenees at the field and landscape level. Agriculture, Ecosystems and Environment 86:93-103.
Elliott H.A., Brandt R.C., Kleinman P.J.A., Sharpley A.N., Beegle D.B. (2006) Estimating source coefficients for phosphorus site indices. Journal of Environmental Quality 35:2195-2201.
European Union. (2000) Water protection and management framework directive in the field of Water Policy, European Union, Brussels.
Gassman P.W., Reyes M.R., Green C.H., Arnold J.G. (2007) The Soil and Water Assessment Tool: Historical development, applications and future research directions Transactions of the American Society of Agricultural and Biological Engineers 50:1211-1250.
Gassman P.W., Williams J.R., Benson V.W., Izaurralde R.C., Hauck L.M., Jones C.A., Atwood J.D., Kiniry J.R., Flowers J.D. (2004) Historical development and applications of the EPIC and APEX models, ASAE Annual International Meeting 2004, Ottawa, Ontario, Canada.
Granlund K., Raike A., Ekholm P., Rankinen K., Rekolainen S. (2005) Assessment of water protection targets for agricultural nutrient loading in Finland. Journal of Hydrology 304:251-260.
Holland J.M. (2004) The environmental consequences of adopting conservation tillage in Europe: reviewing the evidence. Agriculture, Ecosystems and Environment 103:1-25.
Hooda P.S., Rendell A.R., Edwards A.C., Withers P.J.A., Aitken M.N., Truesdale V.W. (2000) Relating soil phosphorus indices to potential phosphorus release to water. Journal of Environmental Quality 29:1166-1171.
Isbell R.F. (2002) Australian Soil Classification. Second Edition ed. CSIRO Publishing, Melbourne, Australia.
Johnston T. (2006) Environmental impacts of raised bed cropping in south west Victoria, Final Report of Project DAV417 prepared for the Grainas Research and Development Corporation (1999-2006), Victorian Department of Primary Industries, Melbourne, Victoria, Australia.
Keating B.A., Carberry P.S., Hammer G.L., Probert M.E., Robertson M.J., Holzworth D., Huth N.I., Hargreaves J.N., Meinke H., Hachman Z., McLean G., Verburg K., Snow V., Dimes J.P., Silburn M., Wang E., Brown S., Bristow K.L., Asseng S., Chapman S., McGown R., Freebairn D.M., Smith C.J. (2003) An overview of APSIM, a model designed for farming systems simulation. European Journal of Agronomy 18:267-288.
Kimmell R.J., Pierzynski G.M., Janssen K.A., Barnes P.L. (2001) Effects of tillage and phosphorus placement on phosphorus runoff losses in a grain sorghum-soybean rotation. Journal of Environmental Quality 30:1324-1330.
Mathers N.J., Nash D.M. (2009) Effects of tillage practices on soil and water phosphorus and nitrogen fractions in a Chromosol at Rutherglen in Victoria, Australia. Australian Journal of Soil Research 47:46-59.
Mathers N.J., Nash D., Gangaiya P. (2007) Nitrogen and phosphorus exports from high rainfall zone cropping in Australia: issues and opportunities for research. Journal of Environmental Quality 36:1551-1562.
McCown R.L., Hammer G.L., Hargreaves J.N.G., Holzworth D.P., Freebairn D.M. (1996) APSIM: a novel software system for model development , model testing and simulation in agricultural research. Agricultural Systems 50:255-271.
McDowell R., Nash D., George A., Wang Q.J., Duncan R. (2009) Approaches for quantifying and managing diffuse phosphorus (P) exports at the farm/sub catchment scale. Journal of Environmental Quality 38:1968-1980.
Nash D., Hannah M. (2011) Using Monte-Carlo simulations and Bayesian Networks to quantify and demonstrate the impact of fertiliser best management practices. Environmental Modelling and Software. DOI: :10.1016/j.envsoft.2011.03.009.
Nash D., Clemow L., Hannah M., Barlow K., Gangaiya P. (2005) Modelling phosphorus exports from rain-fed and irrigated pastures in southern Australia. Australian Journal of Soil Research 43:745-755.
Nash D.M., Halliwell D., Cox J. (2002) Hydrological mobilisation of pollutants at the slope/field scale, in: P. M. Haygarth and S. C. Jarvis (Eds.), Agriculture, Hydrology and Water Quality, CABI Publishing, Oxon, UK. pp. 225-242.
Nash D.M., Hannah M., Mathers N. (2009) Management of high rainfall cropping to improve water quality and productivity - Final Report, State of Victoria, Department of Primary Industries, Melbourne, Australia. pp. 51.
Nash D.M., Hannah M., Robertson F., Riffkin P. (2010) A Bayesian Network for comparing dissolved nitrogen exports from high rainfall cropping in south-eastern Australia. Journal of Environmental Quality 39:1699-1710.
Pearl J. (1988) Probabilistic reasoning in intelligent systems: networks of plausable inference Morgan Kaufman, San Mateo, California, USA.
Pierson S.T., Cabrera M.L., Evanylo G.K., Kuykendall H.A., Hoveland C.S., McCann M.A., West L.T. (2001) Phosphorus and ammonium concentrations in surface runoff from grasslands fertilized with broiler litter. Journal of Environmental Quality 30:1784-1789.
Read Sturgess and Associates. (1999) Rapid appraisal of benefits and costs of nutrient management in the Glenelg Hopkins CMA region, Glenelg-Hopkins Catchment Management Authority Hamilton, Victoria, Australia. pp. 82.
Robertson M.J., Carberry P.S., Huth N.I., Turpin J.E., Probert M.E., Poulton P.L., Bell M., Wright G.C., Yeates S.J., Brinsmead R.B. (2002) Simulation of growth and development of diverse legume species in APSIM. Australian Journal of Agricultural Research 53:429-446.
Salazar O., Wesstrom I., Yousef M.A., Skaggs R.W., Joel A. (2009) Evaluation of the DRAINMOD-N II model for predicting nitrogen losses in a loamy sand under cultivation in south-east Sweden. Agricultural Water Management 96:267-281.
Sharpley A.N. (1980) The enrichment of soil phosphorus in runoff sediments. Journal of Environmental Quality 9:521-526.
Sharpley A.N., Smith S.J. (1994) Wheat tillage and water quality in the Southern Plains. Soil and Tillage Research 30:33-48.
Sharpley A.N., Weld J.L., Beegle D.B., Kleinman P.J.A., Gburek W.J., Moore Jr. P.A., Mullins G. (2003) Development of phosphorus indices for nutrient management planning strategies in the United States. Journal of Soil and Water Conservation 58:137-152.
Sogbedji J.M., van Es H.M., Hutson J.L. (2001) N fate and transport under variable cropping history and fertilizer rate on loamy sand and clay loam soils: I. Calibration of the LEACHMN model. Plant and Soil 229:57-70.
USEPA. (1996) Environmental indicators of water quality in the United States, USEPA, Office of Water, Washington DC USA.
Varis O. (1997) Bayesian decision analysis for environmental and resource management. Environmental Modeling and Software 12:177-185.
Varis O., Kuikka S. (1999) Learning Bayesian decision analysis by doing: lessons from environmental and natural resources management. Ecological Modelling 119:177-195.
Vu D.T., Tang C., Armstrong R.D. (2009) Tillage system affects phosphorus form and depth distribution in three contrasting Victorian soils. Australian Journal of Soil Research 47:33-45.
Zadoks J.C., Chang T.T., Konzak C.F. (1974) A decimal code for the growth stages of cereals. Weed Research 14:415-421.
Contact details
Dr David Nash
Victorian Department of Environment and Primary Industries Ellinbank Centre
1301 Hazeldean Rd, Ellinbank, Victoria, 3821
David.Nash@depi.vic.gov.au
+61 3 56 24 2253
GRDC Project Code: DAV00059,
Was this page helpful?
YOUR FEEDBACK