Agronomic and economic responses of sorghum to nitrogen nutrition
Author: Matthew Gardner, Guy McMullen, Peter Formann and Loretta Serafin, NSW Department of Primary Industries, Tamworth | Date: 18 Jul 2013
Matthew Gardner, Guy McMullen, Peter Formann and Loretta Serafin
NSW Department of Primary Industries, Tamworth
Take home message
- There were limited yield responses to nitrogen (N) application across the two series of trials (4/13 sites), with responses generally occurring where starting N was less than 70 kg N/ha.
- N application resulted in a greater number of protein responsive sites (10/13 sites).
- It is generally thought that the maximum yield is achieved with grain protein at 9 to 10 per cent and at lower levels yield is being compromised by a lack of N.
- Further work is required to quantify the extent of genotype × N supply interactions in the utilization of N.
- -The greatest economic returns were achieved where grain yield was maximised, highlighting the importance of yield in driving profitability.
Background
Although sorghum is a C4 crop and uses nitrogen (N), CO2, solar radiation and water more efficiently than most C3 crops; N as a nutrient is still one of major factors limiting crop yield. Depending on soil N fertility, applications to commercial grain sorghum crops can vary from 0 to 150 kg N ha−1. As yield increases and if there is a shortfall of N, grain protein will decline, sometimes by as much as six per cent. The total N requirement of an 8t/ha sorghum crop at a grain protein level of 6.5 per cent is 142kg of N compared with 190kg of N at 10 per cent protein. It is generally thought that the maximum yield is achieved with grain protein at 9 to 10 per cent and at lower levels yield is being compromised by a lack of N.
Variable responses to the application of N fertilizer have previously been observed in sorghum with differences attributed to climatic, soil and genotypic factors across seasons and locations. Part of this yield variation is associated with differences in the capability of the soil to supply N and in the efficiency of recovery of applied N fertiliser. The other component contributing to the variable yield response to fertiliser-N is the N requirement for yield determination. The N requirement is dependent on the yield expectation in a given environment as determined by climate, management and cultivar. There is a need to determine the minimum N requirement for a given yield level so as to maximize NUE (defined as grain yield per-unit N uptake). Nitrogen uptake in excess of that required for yield determination results in lower NUE and is associated with increased stem and grain N concentration.
Sorghum is currently one of the most profitable crops in the higher-rainfall areas of the northern grains belt. Profit margins suggest sorghum may be almost as profitable as wheat in western growing regions, if slightly more yield can be achieved to make up for a lower price. Nitrogen inputs represent a large input cost within the gross margin for sorghum, however, the lack of protein premiums mean that luxurious N applications directly reduce profitability.
The aim of this research was to determine the agronomic and economic responses of grain sorghum to varying N nutrition levels in the northern grains region.
Method
There are two series of trials that will be reported in this paper. The first were from the 2005 – 2007 seasons where 4 nitrogen rates were trialled whilst the second were from the 2012-13 season where several nitrogen rates were included.
2005 – 07
Between 2005 and 2007 seasons 8 sites were established with N treatments being consistent across all (0, 30, 60 and 90 kg N/ha). Trials were randomised block designs overlaid on commercial sorghum paddocks. Each trial consisted of 4 replicates with plots 8 m x 10 m in dimension. Nitrogen was applied as urea when the crop had reached 6-8 leaves with rainfall expected soon after application.
Table 1. Outline of the sorghum top-dressing trials in northern NSW during 2005-07
|
Region |
Site |
Starting water (mm) |
Starting soil Nitrogen (kg N/ha) † |
Soil N at Z31 (kg N/ha) |
Rainfall after in-crop N†† |
|---|---|---|---|---|---|
|
Moree |
Tulloona |
165 |
99 |
94 |
42 (10) |
|
Warialda |
201 |
66 |
66 |
89 (10) |
|
|
Croppa Ck |
135 |
36 |
35 |
23 (3) |
|
|
Milguy |
167 |
148 |
130 |
27 (3) |
|
|
Liverpool Pl. |
Blackville |
287 |
61 |
21 |
14 (7) |
|
Pine Ridge* |
347 |
158 |
84 |
0 (7) |
|
|
Spring Ridge |
356 |
271 |
482 |
16 (5) |
|
|
Caroona |
169 |
120 |
269 |
40 (5) |
†Total for soil profile to 1.2 m includes fertiliser applied at sowing.
†† Number in brackets indicates days to rainfall
*Site affected by Cl-
Prior to N application crop biomass was determined and crop growth stage was recorded and tillers counted. Crop biomass was also determined at anthesis and also at physiological maturity. Hand samples taken at harvest were used to determine grain yield and grain quality (protein, screenings and hectolitre weight).
2012 – 13
The 2012-13 trials investigated interactions between N and sulphur at each site, however, only the N responses will be reported here. There were 5 trial sites established throughout northern NSW with starting soil N ranging from 14 – 166 kg N/ha (0-120 cm). At each site seven N rates where trialled. There were higher N treatments used at Pine Ridge and Tamworth sites to reflect the higher yield potential. At all sites MR Bazley was used as the primary cultivar, however, 86G56 was also included across four N treatments only. Crop biomass was determined at anthesis and also at physiological maturity. Sub samples taken at harvest were used to determine grain yield and grain quality (protein, screenings and hectolitre weight).
Table 2. Outline of the sorghum trials during 2012-13
|
Site |
Starting water (mm) |
Starting soil N (kg N/ha) † |
|---|---|---|
|
Tamworth |
82 |
<14 |
|
Pine Ridge |
215 |
65 |
|
Terry Hie Hie |
182 |
54 |
|
Bullarah |
195 |
166 |
|
Gurley |
210 |
98 |
†Total for soil profile to 1.2 m
Results
Across the 3 seasons of trial work only one significant increase in grain yield was recorded in the 2005-07 seasons (Table 3). This site near Croppa Creek had the lowest starting soil N and water levels of all sites (Table 1).
Table 3. Effect of in-crop N management on grain yield in northern NSW in 2005/06
|
Area |
Site |
Top-dressed N (kg N/ha) |
||||
|---|---|---|---|---|---|---|
|
0 |
30 |
60 |
90 |
mean |
||
|
Moree |
Tulloona |
4.97 |
5.29 |
5.25 |
4.95 |
5.12 |
|
Warialda |
5.90 |
5.37 |
6.70 |
5.68 |
5.91 |
|
|
Croppa Ck |
2.45c |
2.91b |
3.30b |
3.73a |
3.10 |
|
|
Milguy |
5.27 |
5.07 |
4.72 |
4.64 |
4.93 |
|
|
Liverpool Plains |
Blackville |
4.39 |
4.71 |
5.22 |
4.82 |
4.78 |
|
Pine Ridge |
1.38 |
0.88 |
0.72 |
0.66 |
0.91 |
|
|
Spring Ridge |
5.38 |
5.74 |
5.75 |
5.86 |
5.68 |
|
|
Caroona |
6.13 |
7.31 |
6.39 |
6.82 |
6.66 |
|
Unlike grain yield there were several protein responses to in-crop N application in the 2005/06 season (5/8 sites). This suggests that the applied N may have been applied too late in the crop development cycle or that the in-crop N was surplus to plant requirements.
Table 4. Effect of in-crop N management on sorghum grain protein NSW in 2005/06
|
Area |
Site |
Top-dressed N (kg N/ha) |
||||
|---|---|---|---|---|---|---|
|
0 |
30 |
60 |
90 |
Grand Total |
||
|
Moree |
Tulloona |
10.76b |
10.71b |
11.79a |
11.44a |
11.18 |
|
Warialda |
8.53b |
8.62b |
8.78b |
10.28a |
9.05 |
|
|
Croppa Ck |
9.78b |
9.96b |
10.76a |
11.61a |
10.53 |
|
|
Milguy |
11.99 |
12.03 |
12.42 |
12.50 |
12.24 |
|
|
Liverpool Plains |
Blackville |
7.04b |
7.12b |
7.41ab |
7.60a |
7.29 |
|
Pine Ridge |
10.93 |
11.23 |
10.60 |
11.56 |
13.09 |
|
|
Spring Ridge |
9.97 |
9.68 |
9.75 |
9.89 |
9.82 |
|
|
Caroona |
8.19c |
8.36bc |
9.04a |
8.97ab |
8.64 |
|
From the 2012-13 results there were 3 N responsive sites at Terry Hie Hie, Pine Ridge and Tamworth. The largest N responses were observed at Tamworth where grain yield ranged from less than 2 t/ha, for the 0 N treatment to in excess of 6 t/ha for the 160 kg N/ha. In comparison, at the Terry Hie Hie site the maximum grain yield response was 1.1 t/ha, which was achieved from the 120 kg N/ha treatment. Interestingly Terry Hie Hie and Pine Ridge began with similar quantities of available soil N, yet their maximum yield responses were vastly different. At all of the responsive sites N treatments were sufficient for grain yield responses to begin to plateau. At Bullarah and Gurley where the starting soil N was in excess of ~100 kg N/ha there was no significant grain yield response to N treatments.
There were significant protein responses to N treatments observed at all sites except for Bullarah where grain protein was approximately 12.5 % for all N treatments. The largest grain protein response was observed at Pine Ridge where proteins increased from 6.2 %, for the 0 kg N/ha treatment, to 10.8 % for the 240 kg N/ha treatment. Across all the sites there were no significant yield increases observed after grain protein levels had reached approximately 10 %.
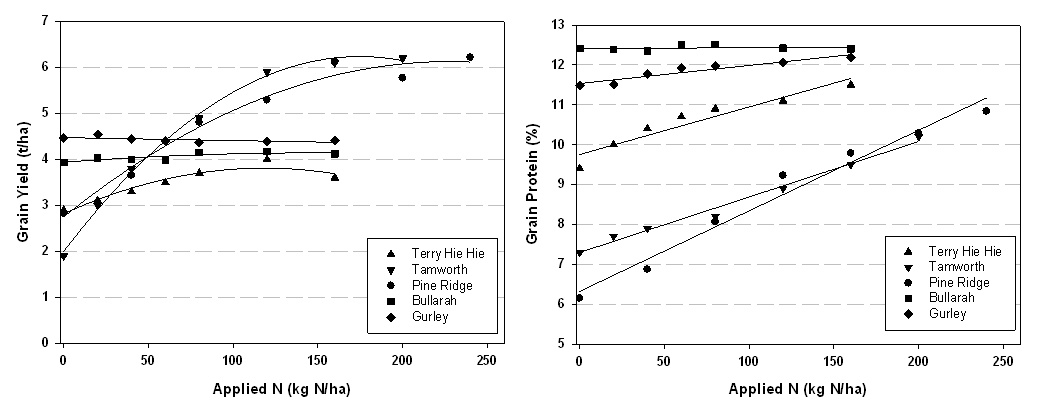
Figure 1. Grain yield (a) and protein (b) responses to varying rates of applied N at Terry Hie Hie, Tamworth, Pine Ridge, Bullarah and Gurley in the 2012-13 season.
With the exception of Pine Ridge grain yields for MR Bazley and 86G56 were similar across the sites. However, 86G56 consistently had significantly lower protein (1.6 – 2.2%) than MR Bazley at all sites. This difference in protein represents a significant difference in N removal in grain with an additional 10 – 15 kg N/ha being removed in the MR Bazley compared to the 86G56. Full N uptake has not yet been calculated as N content of stem and leaves are still being determined. Once this has been determined NUE can be calculated.
Table 5. Average yield and protein for MR Bazley and 86G56 across 4 sites in 2012-13
|
Site |
Grain Yield (t/ha) |
Grain Protein % |
||
|---|---|---|---|---|
|
MR Bazley |
86G56 |
MR Bazley |
86G56 |
|
|
Terry Hie Hie |
3.6 |
3.4 |
11.1 |
9.9 |
|
Pine Ridge |
4.7 |
5.7 |
8.8 |
7.2 |
|
Bullarah |
4.2 |
4.0 |
12.4 |
10.2 |
|
Garah |
4.5 |
4.3 |
11.9 |
10.1 |
Gross margins were calculated for the three yield responsive sites using the NSW DPI summer crop budgets. Variable costs for all sites were $325/ha, which included all planting, pesticide, herbicide and harvesting costs but excluded urea ($700/t). All applications were based on contractor prices. The sorghum price used was $290/t. Calculated gross margins reflected the grain yield response very closely with the greatest response being observed at the Pine Ridge and Tamworth. Consequently the best economic outcome corresponded with the best grain yield outcome. Returns from fertiliser investment was also calculated and shown in Figure 2 b. At the optimum N treatments for each site return on N fertiliser investment ranged between $2 – 5 per dollar spent on nitrogen.
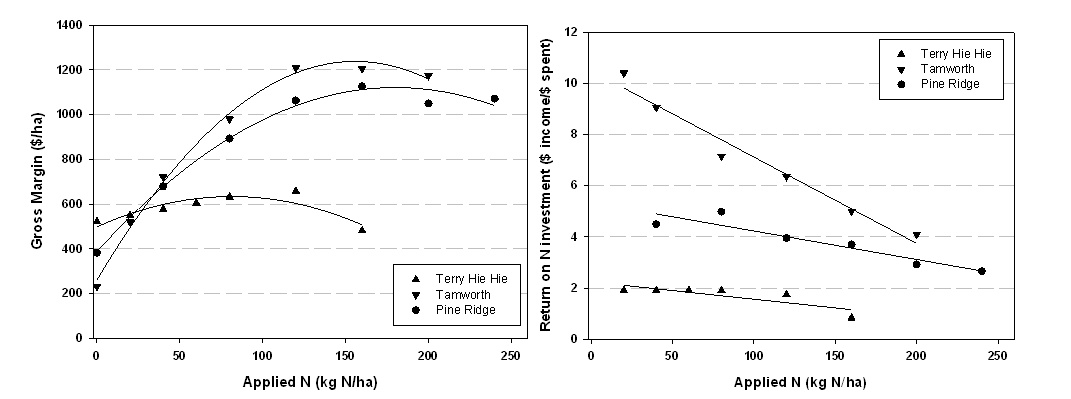
Figure 2. Calculated gross margins (a) and return on N investment (b) for varying rates of applied N at Terry Hie Hie, Tamworth and Pine Ridge in the 2012-13 season.
Conclusion
Across the two series of trials there were 4/13 sites that had significant grain yield responses to N application. All sites that were yield responsive to N application had <70 kg N/ha starting soil N (0-120 cm). In contrast to grain yield, grain protein showed a more frequent (10/13) increase with N application. Significant protein responses were observed even when starting soil N was up to 120 kg N/ha. Maximum grain yield appeared to be achieved at approximately 10% grain protein, indicating that this is the target grain protein for budgeting. The lack of any protein price increments in sorghum means this equates to exporting applied N off-farm without any return on investment. There appears to be some differences between cultivars in their protein achievement and hence N removal in grain that requires further investigation.
The greatest economic returns were achieved where grain yield was maximised, highlighting the importance of yield in driving profitability. This was further highlighted by the return of N investment with $2-5 being returned for $1 spent on N. Agronomic and economic responses to N nutrition will continue to be evaluated over the next 3 years in the Northern grains region under the More Profit from Crop Nutrition Project.
Acknowledgements
Project Support: This work was funded by GRDC and NSW DPI through the Eastern Farming Systems project (DAQ0106) and the More Profit from Crop Nutrition Project. The collaboration on the MPCN project with Dr Mike Bell and Dr David Lester is gratefully acknowledged. Many thanks to all the growers and agronomists who assisted with provision of land and time. Technical assistance provided by Stephen Morphett, Rod Bambach, Patrick Mortell, Jim Perfrement, Peter Perfrement and Nicole Carrigan are gratefully acknowledged.
Contact details
Matthew Gardner
NSW Department of Primary Industries
Ph: 02 67 63 1138
Fx: 02 67 63 1222
Email: matthew.gardner@dpi.nsw.gov.au
Was this page helpful?
YOUR FEEDBACK