Canola nutrition: what were the benefits from N S and P in 2012?
Author: Richard Daniel, Matthew Gardner, Anthony Mitchell and Rachel Norton | Date: 05 Mar 2013
Richard Daniel1, Matthew Gardner2, Anthony Mitchell1 and Rachel Norton1
1Northern Grower Allianceand 2NSW DPI
Take home messages
A series of four trials conducted in a season with a dry spring and canola yields of ~1.5-2.0t/ha
Under these conditions:
- Nitrogen was the key nutrient limiting grain yield with significant yield responses at all sites and net returns of $120-200/ha when compared to nil nitrogen application
- Significant yield benefits to phosphorous application with net returns of ~$30-90/ha from 20kg P/ha when compared to nil phosphorous application
- All sites unresponsive to sulfur (biomass, leaf area index, yield or oil content) with sulphur grain removal of ~4-5kg S/t grain
- Oil content significantly decreased (by 1-3%) with additional nitrogen at 3 of the 4 sites but financial impact was more than compensated by yield increases
- No interaction between nitrogen and sulfur at any site
- Total crop available levels of ~120-160 kg N/ha were justified at all sites at these yield levels. This target provided good returns on investment and ensured replacement of nitrogen removed in grain
- Phosphorous impact on oil content may be worth more evaluation
Background
The production area of canola in northern NSW has increased in recent years with canola becoming a more important and stable part of the farming system. The experiences from further south have been valuable to help guide agronomic management but there are still a number of questions in the northern grains region regarding appropriate fertiliser rates, particularly sulfur, together with the question of how to better produce consistent oil contents.
This paper reports on the results from a series of four canola nutrition trials conducted in northern NSW in 2012. These trials were designed to generate regional data evaluating fertiliser response patterns for nitrogen and sulfur but also had the aim of examining the impact on oil content. Trials were located to give a broad regional coverage.
Table 1: Details of canola nutrition trials conducted in 2012
|
Location |
Conducted by |
Variety(s) |
Planting date |
Nutrients evaluated |
Harvest date |
|
Moree |
NSW DPI |
Pioneer 44Y84CL Hyola 555TT |
02/05/2012 |
N and S |
21/10/2012 |
|
Blackville |
16/05/2012 |
N and S |
17/11/2012 |
||
|
Yallaroi |
NGA |
Pioneer 45Y82CL |
9/05/2012 |
N, P and S |
8/11/2012 |
|
Bellata |
10/05/2012 |
N, P and S |
26/10/2012 |
Soil test results
Tables 2-4 show the soil test results at each site for nitrogen, sulfur and phosphorous. Results are listed by three depth zones; shallow (either 0-10 or 0-15cm), mid depth (10-60, 15-45 or 15-60cm) and deep (45-90 or 60-90cm).
Table 2: Soil test results - Nitrate levels
|
Depth |
Location |
|||
|
Moree |
Blackville |
Yallaroi |
Bellata |
|
|
Shallow mg/kg |
13 (0-10cm) |
12 (0-10cm) |
9 (0-15cm) |
17 (0-15cm) |
|
Mid mg/kg |
3 (10-60cm) |
1 (10-60cm) |
2 (15-45cm) |
3 (15-60cm) |
|
Deep mg/kg |
2 (60-90cm) |
<1 (60-90cm) |
1 (45-90cm) |
5 (60-90cm) |
|
Total mineral N kg/ha |
43 |
~25 |
30 |
69 |
Total mineral N calculated as nitrate level x 1.3 (~bulk density) x depth (without any mineralisation credit)
Table 3: Soil test results - Sulfur levels (KCl40 test)
|
Depth |
Location |
|||
|
Moree |
Blackville |
Yallaroi |
Bellata |
|
|
Shallow mg/kg |
3.2 (0-10cm) |
5.2 (0-10cm) |
|
3.7 (0-15cm) |
|
Mid mg/kg |
7.1 (10-60cm) |
8.9 (10-60cm) |
|
4.2 (15-60cm) |
|
Deep mg/kg |
9.5 (60-90cm) |
14.5 (60-90cm) |
|
34.0 (60-90cm) |
|
Total Sulphate kg/ha |
87 |
121 |
|
164 |
Total sulfate calculated as sulfur level x 1.3 (~bulk density) x depth
NB Yallaroi data not available at time of publication
Table 4: Soil test results - Phosphorous levels
|
Depth |
Location |
|||
|
Moree |
Blackville |
Yallaroi |
Bellata |
|
|
Shallow mg/kg |
Colwell 14 BSES 152 (0-10cm) |
Colwell 26 BSES 370 (0-10cm) |
Colwell 10.4 PBI 134 (0-15cm) |
Colwell 26 PBI 96 (0-15cm) |
|
Mid mg/kg |
Colwell 2 BSES 81 (10-30cm) |
Colwell 12 BSES 265 (10-30cm) |
Colwell 3.5 PBI 122 BSES >120* (15-45cm) |
Colwell 5 PBI 120 BSES 470 (15-60cm) |
* Laboratory result BSES >Level of detection (120mg/kg)
Method
The NSW DPI trials focussed on nitrogen and sulfur responses with both sites receiving 20 kg P/ha applied as triple superphosphate with the seed. This provided a baseline level of 1 kg S/ha. Nitrogen was applied as urea with sulfur applied as granulated gypsum. Both urea and gypsum were drilled ~7.5cm below the seed but also offset ~7.5cm from the planting row to avoid any impact on establishment. Row spacing was 37cm. Nitrogen rates were 0, 40, 80 and 120 kg N/ha at the Moree site and 0, 50, 100 and 200 kg N/ha at Blackville. Sulfur was evaluated at 1, 11, 21 and 41 kg S/ha at both sites. Trials were fully factorial with four rates of nitrogen × four rates of sulfur × two varieties with four replicates.
NGA trials also had a factorial design with three rates of both nitrogen and sulfur x one variety with four replicates. All nine treatments had 20 kg P/ha applied as MAP with the nitrogen and sulfur contributions included in total nutrient calculations. Combinations of urea and Gran Am were used to supply the target rates of both nitrogen and sulfur. All fertilisers were applied to plots by hand immediately prior to planting and incorporated by the sowing operation. The nitrogen rates tested were 34, 84 and 134kg N/ha at both sites. Sulfur was added at 1, 16 and 31kg S/ha at both sites. In addition, three treatments were tested with no added phosphorous; N34/S1, N84/S16 and N134/S31. Row spacing was 32cm.
Biomass and dry matter
Data was generated for all sites by dry matter cuts (NSW DPI) or NDVI and leaf area index (NGA). The results from these assessments are not presented but supported the pattern of yield results.
Yield
There was no significant interaction for nitrogen x sulfur for any trial. The results presented show the main effects of nitrogen or sulfur. The factorial design means that each result for a single rate of nitrogen or sulfur is based on a total of 32 individual plots at Moree and Blackville and 12 plots at both Yallaroi and Bellata. The phosphorous yield and oil results are based on a smaller subset of treatments at Yallaroi and Bellata with a factorial of two rates of phosphorous and three combinations of nitrogen and sulfur.
Table 5: Yield response to Nitrogen
|
Moree |
Blackville |
Yallaroi |
Bellata |
||||
|
N added (kg N/ha) |
Grain yield (t/ha) |
N added (kg N/ha) |
Grain yield (t/ha) |
N added (kg N/ha) |
Grain yield (t/ha) |
N added (kg N/ha) |
Grain yield (t/ha) |
|
0 |
0.73 d |
0 |
0.99 c |
34 |
1.58 b |
34 |
1.25 b |
|
40 |
1.08 c |
50 |
1.51 b |
84 |
1.89 a |
84 |
1.40 a |
|
80 |
1.31 b |
100 |
1.69 b |
134 |
1.91 a |
134 |
1.45 a |
|
120 |
1.47 a |
200 |
1.99 a |
||||
|
LSD 0.14 (p<0.05) |
LSD 0.19 (p<0.05) |
LSD 0.21 (p<0.05) |
LSD 0.12 (p<0.05) |
||||
|
cv 6.4 % |
cv 4.8% |
cv 14.0% |
cv 10.7% |
||||
Treatments sharing the same letter, within each site, are not significantly different
Table 6: Yield response to Sulfur
|
Moree |
Blackville |
Yallaroi |
Bellata |
||||
|
S added (kg S/ha) |
Grain yield (t/ha) |
S added (kg S/ha) |
Grain yield (t/ha) |
S added (kg S/ha) |
Grain yield (t/ha) |
S added (kg S/ha) |
Grain yield (t/ha) |
|
1 |
1.16 |
1 |
1.53 |
1 |
1.75 |
1 |
1.32 |
|
11 |
1.14 |
11 |
1.52 |
16 |
1.77 |
16 |
1.40 |
|
21 |
1.12 |
21 |
1.56 |
31 |
1.85 |
31 |
1.38 |
|
41 |
1.16 |
41 |
1.54 |
||||
|
NSD |
NSD |
NSD |
NSD |
||||
Table 7: Yield response to Phosphorous
|
Yallaroi |
Bellata |
||
|
P added (kg P/ha) |
Grain yield (t/ha) |
P added (kg P/ha) |
Grain yield (t/ha) |
|
0 |
1.54 b |
0 |
1.26 b |
|
20 |
1.83 a |
20 |
1.43 a |
|
LSD 0.19 (p<0.05) |
LSD 0.12 (p<0.05) |
||
|
cv 12.2% |
cv 12.0% |
||
Treatments sharing the same letter, within each site, are not significantly different
Key points yield:
- Significant yield response to nitrogen at all sites
- Yield response to nitrogen had ‘plateaued’ at Yallaroi and Bellata but not at Moree and Blackville
- No yield response to addition of sulfur at any site
- Yield response to phosphorous at both Yallaroi and Bellata
Oil Content
Table 8: Oil content response to Nitrogen
|
Moree |
Blackville |
Yallaroi |
Bellata |
||||
|
N added (kg N/ha) |
Oil content (%) |
N added (kg N/ha) |
Oil content (%) |
N added (kg N/ha) |
Oil content (%) |
N added (kg N/ha) |
Oil content (%) |
|
0 |
43.9 a |
0 |
45.5 b |
34 |
44.5 |
34 |
47.3 a |
|
40 |
44.3 a |
50 |
46.2 a |
84 |
44.4 |
84 |
46.0 b |
|
80 |
43.2 b |
100 |
45.8 b |
134 |
44.6 |
134 |
44.5 c |
|
120 |
42.3 c |
200 |
44.7 c |
||||
|
LSD 0.5 (p<0.05) |
LSD 0.4 (p<0.05) |
NSD |
LSD 0.8 (p<0.05) |
||||
Treatments sharing the same letter, within each site, are not significantly different
Table 9: Oil content response to Sulfur
|
Moree |
Blackville |
Yallaroi |
Bellata |
||||
|
S added (kg S/ha) |
Oil content (%) |
S added (kg S/ha) |
Oil content (%) |
S added (kg S/ha) |
Oil content (%) |
S added (kg S/ha) |
Oil content (%) |
|
1 |
43.6 |
1 |
45.5 |
1 |
44.4 |
1 |
46.0 |
|
11 |
43.6 |
11 |
45.6 |
16 |
44.6 |
16 |
46.0 |
|
21 |
43.7 |
21 |
45.6 |
31 |
44.5 |
31 |
45.7 |
|
41 |
43.7 |
41 |
45.6 |
||||
|
NSD |
NSD |
NSD |
NSD |
||||
Table 10: Oil content response to Phosphorous
|
Yallaroi |
Bellata |
||
|
P added (kg P/ha) |
Oil content (%) |
P added (kg P/ha) |
Oil content (%) |
|
0 |
44.8 |
0 |
45.4 |
|
20 |
44.4 |
20 |
46.1 |
|
NSD |
NSD |
||
Although the Bellata result was not significant (p=0.11), there was an apparent trend to improved oil content particularly at lower nitrogen rates (~0.7-0.9%). This may be just experimental noise but appears worthy of further investigation.
Key points oil content:
- Significant reduction in oil content with increasing nitrogen rates at 3 of the 4 sites
- No oil content response to addition of sulfur at any site
- No significant oil content response to addition of phosphorous at either site
Nutrient removal
Grain samples were analysed from a subset of treatments from Yallaroi and Bellata to investigate levels of nutrient removal. All samples were from plots that received 134kg N/ha and 20kg P/ha, together with 1, 16 or 31kg S/ha. Degrees of freedom were limited for thorough analysis but the goal was to examine ‘general’ nutrient removal rates. There was no significant difference between treatments in removal levels of N, S or P.
Table 11: Nutrient removal in grain
|
Nitrogen (kg N/t of grain) |
Sulfur (kg S/t of grain) |
Phosphorous (kg P/t of grain) |
|||
|
Yallaroi |
Bellata |
Yallaroi |
Bellata |
Yallaroi |
Bellata |
|
41 |
42 |
4.7 |
4.5 |
7.5 |
6.1 |
NB all treatments had ‘luxury’ amounts of N (134kg N/ha) and P (20kg P/ha) to avoid any limitation of these major nutrients.
Key points nutrient removal:
- Nitrogen and phosphorous grain removal was typical of published canola levels
- Sulfur removal was only ~4-5kg S/t grain. This is half the figure often quoted
- The N:S ratios were ~9:1
Economics
Economic performance was evaluated by two different approaches. Net return ($/ha) was calculated as gross return (yield and oil) – fertiliser cost. Table 12 shows the net returns from nitrogen application at each site.
Table 12: Net return response to Nitrogen
|
Moree |
Blackville |
Yallaroi |
Bellata |
||||
|
N added (kg N/ha) |
Net return ($/ha) |
N added (kg N/ha) |
Net return ($/ha) |
N added (kg N/ha) |
Net return ($/ha) |
N added (kg N/ha) |
Net return ($/ha) |
|
0 |
376 |
0 |
512 |
34 |
753 |
34 |
612 |
|
40 |
496 |
50 |
710 |
84 |
836 |
84 |
610 |
|
80 |
548 |
100 |
724 |
134 |
779 |
134 |
550 |
|
120 |
566 |
200 |
730 |
||||
Assumptions: canola at $495/t, 1.5% premium for every 1% oil >42%, N at $1.35/kg (urea $620/t), S at $1.37/kg (Gran Am $600/t, valuing N at $1.35/kg) and P at ~$2.72/kg (MAP at $750/t, valuing N at $1.35/kg and S at $1.37/kg)
Net return= (yield and oil benefit x grain price)-cost of nitrogen applied
Shaded cells are the highest net returns at each site
In all four trials the highest nitrogen rate resulted in the largest yield (significantly at both Moree and Blackville). However the net returns, at a nitrogen cost of $1.35/kg, were generally flat across application rates. At two of the sites, the highest net returns were gained from lower nitrogen rates.
The second approach was to calculate a ‘marginal return on investment’. E.g. at Moree the first 40kg N/ha produced a $120/ha profit at a cost of $54/ha (40kg/ha N at $1.35/kg). This resulted in a return of $2.22 profit/$ cost. The next 40 kg N/ha produced an additional $52/ha profit at a cost of $54/ha. The marginal return from this 40kg N/ha was $0.97 profit/$ cost. The final 40kg N/ha produced an additional $16/ha profit, again at a cost of $54/ha. The marginal return from this 40kg N/ha was only $0.33 profit/$ cost. Although the 120kg N/ha rate produced the largest net return, the last 40kg N/ha produced negligible profit.
Figure 1 shows that the marginal return on investment from additional fertiliser is greatest under low nitrogen situations (no surprise) and that extra nitrogen addition under higher background levels becomes increasingly unprofitable. In a year with canola yields of ~1.5-2.0t/ha, the breakeven zone (in all trials) appeared to be a total crop available level of ~120-160kg N/ha.
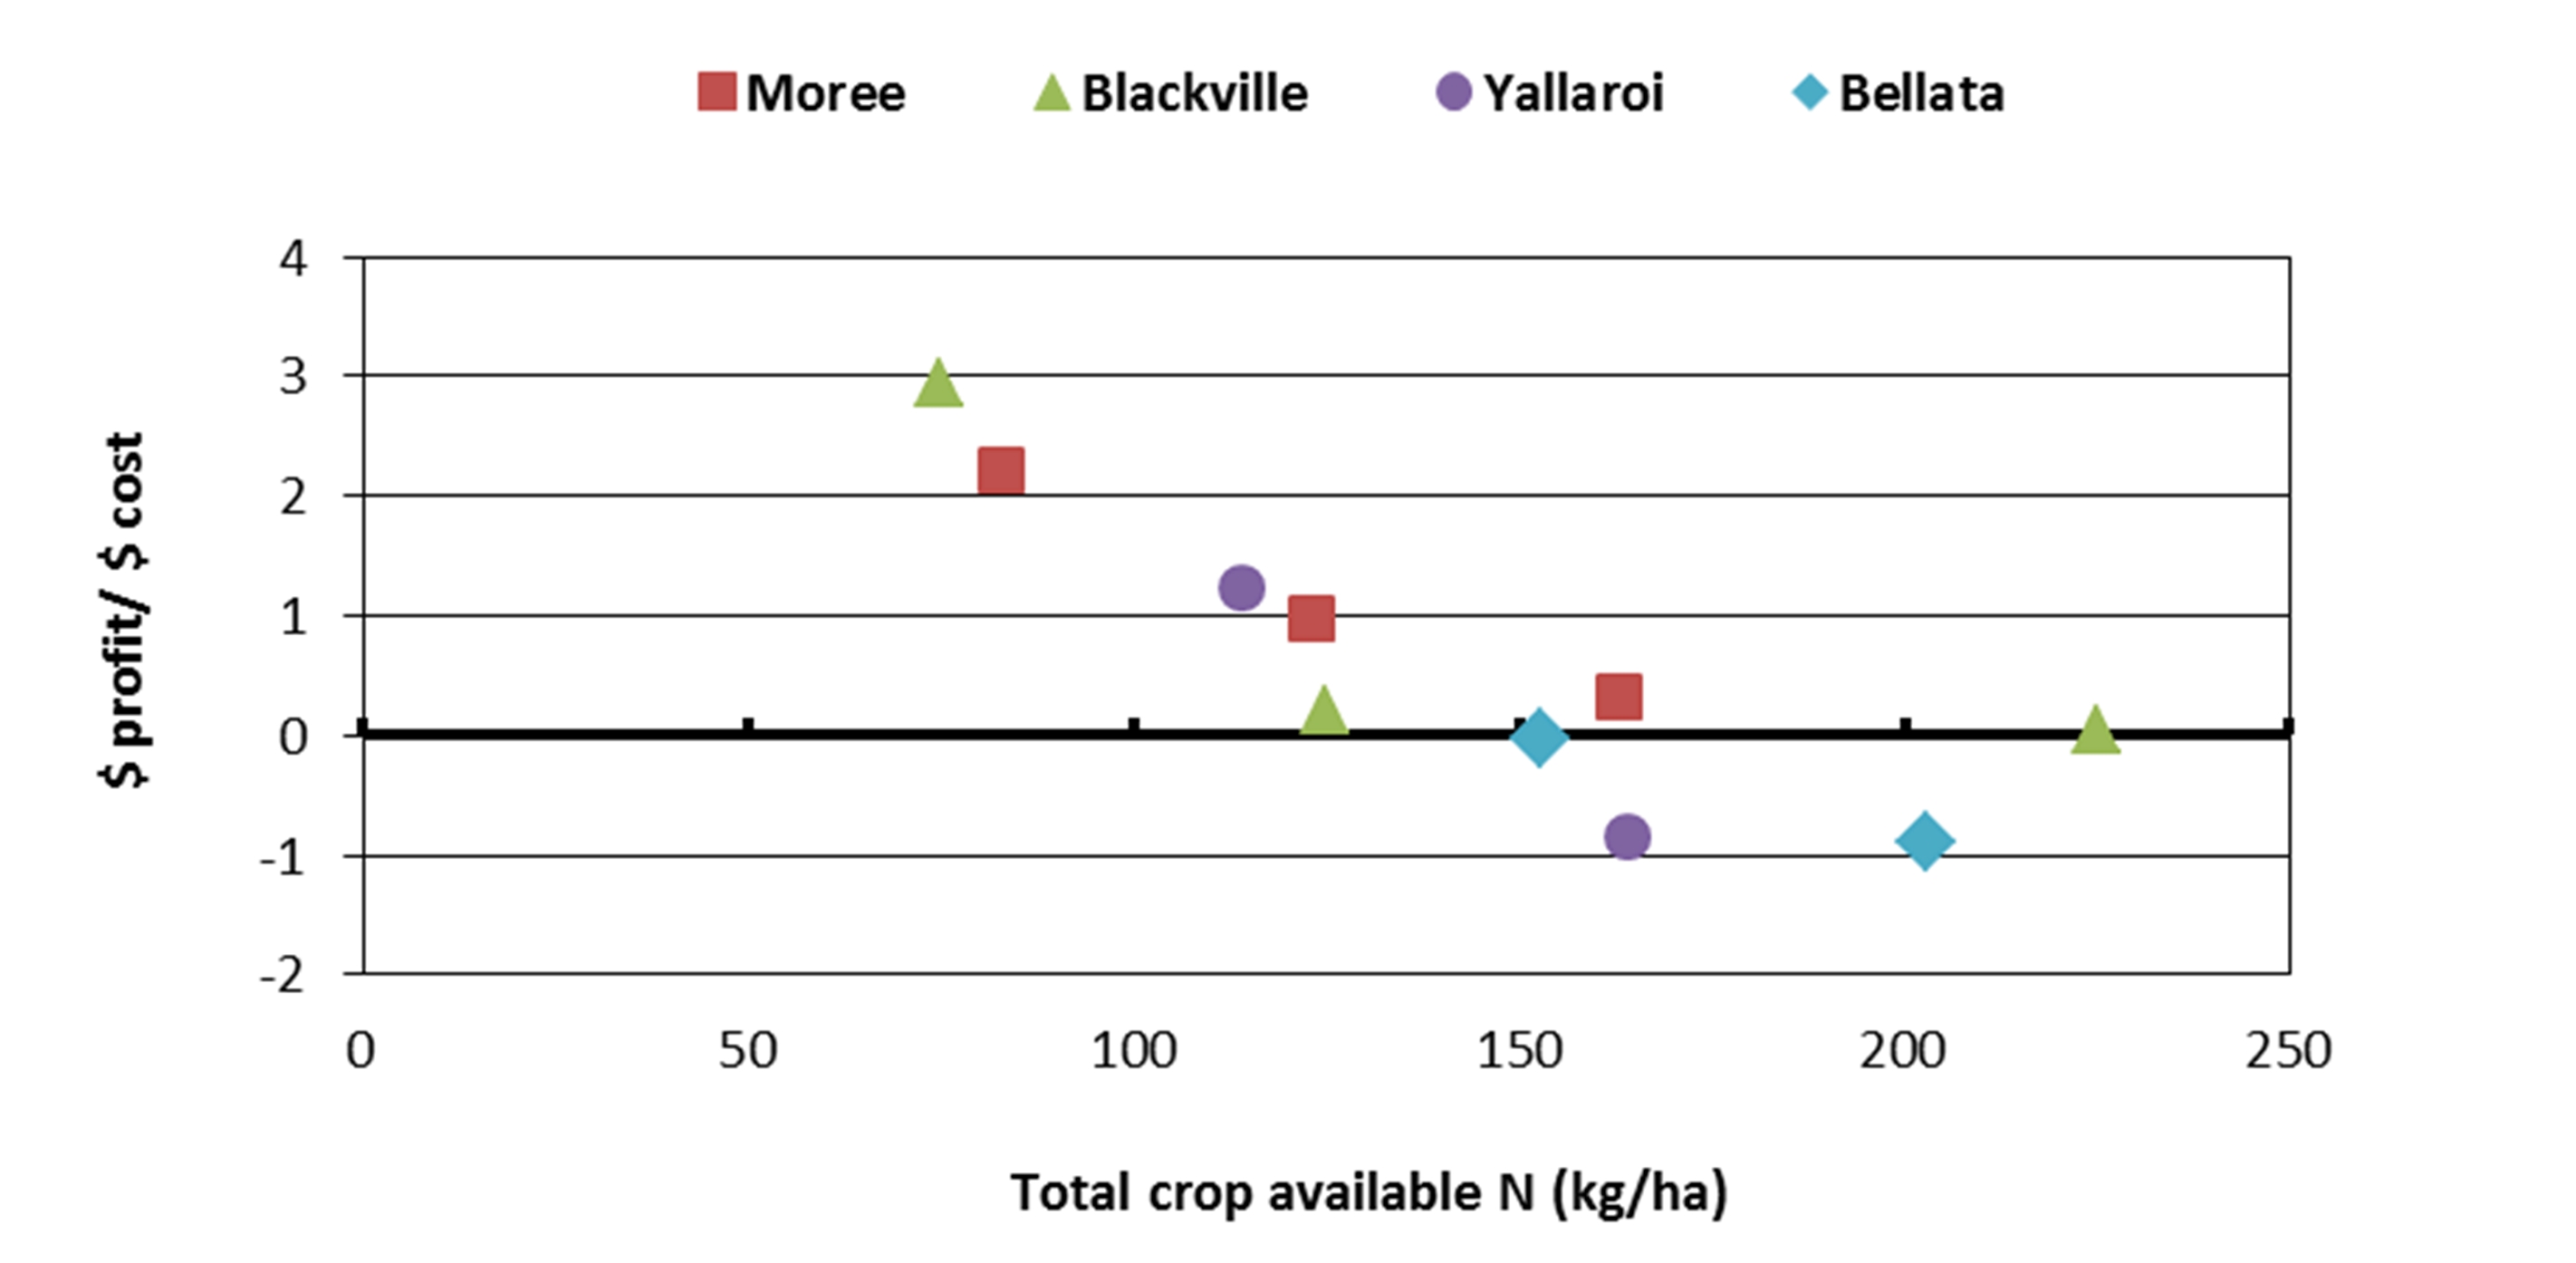
Figure 1: Marginal return on investment response to Nitrogen ($ profit per $ cost)
(Total crop available N= total soil mineral N kg/ha plus fertiliser N kg/ha added. It does NOT include any mineralisation credit)
Assumptions: canola at $495/t, 1.5% premium for every 1% oil >42%, N at $1.35/kg (urea $620/t)
There was no significant impact from sulfur application at any rate on yield or grain quality. All sulfur applications would have resulted in net losses in 2012 of ~$14-56/ha.
Table 13: Net return and return on investment response to Phosphorous
|
Yallaroi |
Bellata |
||||
|
P added (kg P/ha) |
Net return ($/ha) |
ROI ($ net return/ $ cost) |
P added (kg P/ha) |
Net return ($/ha) |
ROI ($ net return/ $ cost) |
|
20 |
93 |
1.72 |
20 |
27 |
0.50 |
Key points economics:
- Net returns of ~$120-200/ha at Moree and Blackville from nitrogen application (NB there were no nil nitrogen treatments at Yallaroi or Bellata for comparison)
- Differences in levels of net return between nitrogen rates were small at all sites
- Highest returns on investment for nitrogen added in situations with less than ~120kg N/ha total crop available N
- Small profits still generated for nitrogen rates between ~120-160kg total available N
- No sulfur application provided any benefit
- Net benefits of ~$30-90/ha from phosphorous application at Yallaroi and Bellata
It is important to note that these results were achieved in a season with poor finishing rainfall and maximum yields of only ~1.5-2.0t/ha.
Conclusions
The results from these trials generally support previous experience in more southern areas but should also be considered in the light of the season the trials were conducted.
All sites were strongly yield responsive to nitrogen in situations with ~25-70kg N/ha available from soil testing (excluding any mineralisation amount). Nitrogen removal in grain was ~60-80kg N/ha at the yields achieved. These trials support a total crop available N target of ~120-160kg N/ha where yield targets are in the range of 1.5-2.0t/ha. This corresponds to a total crop available N target of ~80kg N/ha for each tonne of grain.
The level of phosphorous response was surprising, particularly at a site with Colwell at 26mg/kg. However with grain removal of ~10kg P/ha, phosphorous application of ~15-20kg P/ha appeared warranted from both an agronomic and financial viewpoint.
The trial sites were not specifically selected for sulfur deficiencies but the soil levels were in excess of any sulfur threshold level under the seasonal conditions experienced. Sulfur grain removal was ~4-5kg S/t grain. This level supports data from a number of Australian and international publications but is only half the level of 10kg S/t grain often cited. This data, together with similar results from the central west of NSW, suggest that sulfur removal rates in canola need to be revisited to assist our budgeting of an often expensive nutrient. The current general recommendations of 25kg S/ha with each crop, may be both agronomically unnecessary and financially costly unless in situations of extreme sulfur deficiency or very high potential yield targets. The data would indicate that any reduction in sulfur expenditure could be more economically used in nitrogen application.
Acknowledgments
Thanks to Maurie Street (GOA) for input together with the grower co-operators at all sites. Our thanks also to Pacific Seeds, Pioneer and Viterra for providing seed and additional research input. Technical assistance for the NSW DPI trials provided by Rod Bambach, Jan Hoskins, Patrick Mortell, Stephen Morphett, Peter Formann and Jim Perfrement are gratefully acknowledged.
Contact details
Richard Daniel
Northern Grower Alliance
Ph: 07 4639 5344
Email: richard.daniel@nga.org.au
GRDC Project Code: NGA00003: GRDC Grower Solutions for Northern NSW and Southern Qld DAN00169: Variety Specific Agronomy Packages,
Was this page helpful?
YOUR FEEDBACK