Moisture probes - Application and usefulness in crop decision making
Author: Paul Breust, Jon Cobden and Paul Hudson | Date: 26 Feb 2013
Paul Breust1, Jon Cobden1, and Paul Hudson2
1FarmLink Research Ltd, 2Cropsol Soil and Irrigation Management
Keywords: soil moisture units, live data, plant available water
Take home messages
- Probes provide live and historical data on soil moisture, rainfall and temperature.
- Data is another tool for assisting management decisions at points in time.
- Data becomes more useful as more is collected over time for a range of seasons.
- Measurements are in a micro environment that may not be representative of the whole landscape.
Soil moisture probes have been used widely in irrigation for many years. There are a large range of types and models on the market place. FarmLink Research Ltd with funding from MCMA and DAFF have implemented a network of 18 paired probes across SE NSW.
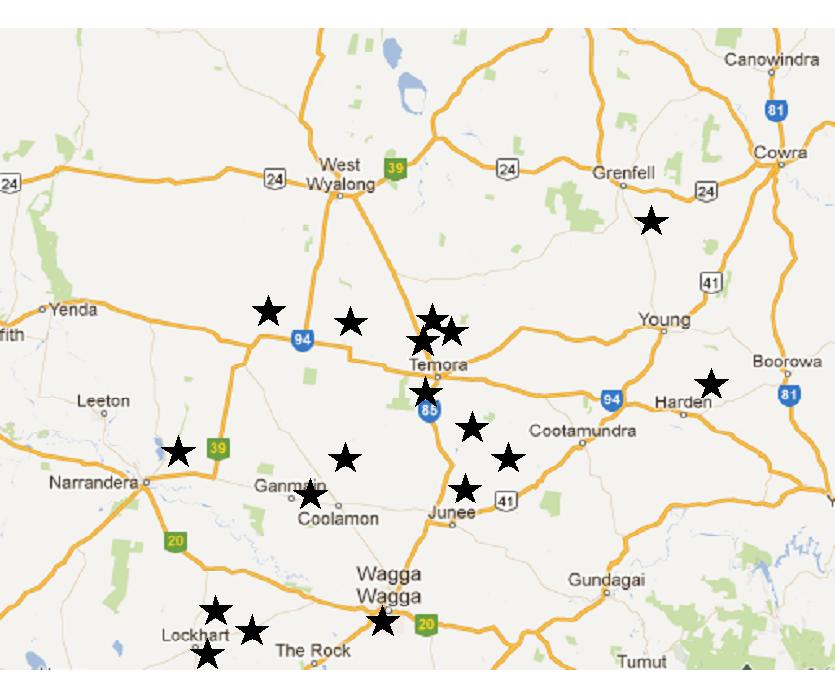
Figure 1. Locations of the 18 paired probes across SE NSW.
The probes used were purchased from Cropsol Soil and Irrigation Management in Griffith, and are capacitance-based probes installed 18cm below the soil surface. This prevents interruption to sowing and other machinery operations. The probes are connected to a mobile network transmitter and data is sent to a server from where it is uploaded to the FarmLink Research website every 15 minutes. Each probe has 6 sensors that measure moisture at depths of 28, 38, 58, 78, 98 and 118cm. The probes also measure soil temperature at 28 and 38cm. Several sites also record rainfall using automatic rain gauges.
The data can be represented in a range of formats. We use two graphs to display the data on the website. One graph separately displays each sensors moisture data and the other displays the sum of all six sensors. Examples of each are included below in Figures 2 and 3. (NB. Separate sensor graphs are defined by colour which was not available in this document)
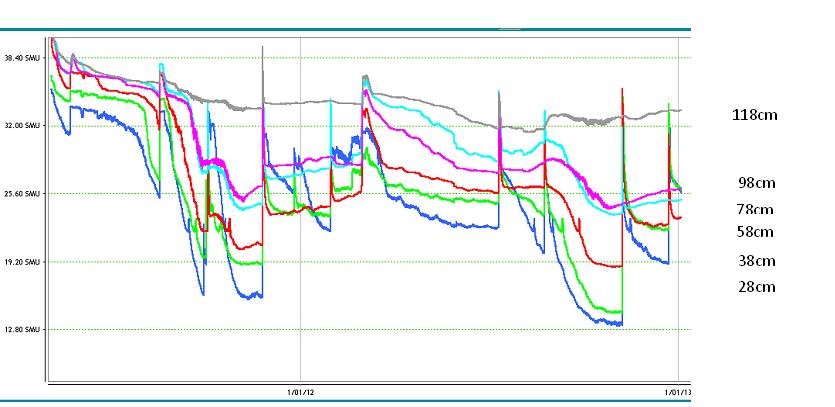
Figure 2. Beckom Barley 2012 Separate sensor graph 2011-2013
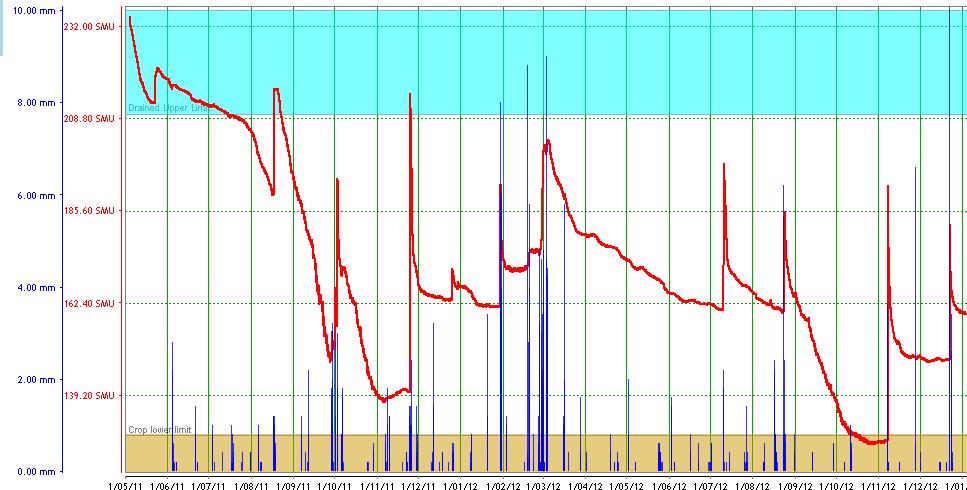
Figure 3. Beckom Barley 2012 Sum sensor graph 2011-2013
What does it all mean? How do I interpret the data?
The graphs above and below represent data collected from the probe sensors at Beckom. The data in this example is graphed using soil moisture units (SMUs). The data can be reported using other units such as volumetric percentage, but unit selection is not critical as long as it is consistent. The critical factor is the relationship to plant available water (PAW). The sum graph contains shaded sections at the top and bottom. The top section indicates when the moisture profile is full or the drained upper limit. The closer the sum graph line is to this section, the more moisture is available. Conversely the lower shaded area is when the crop can no longer draw water from the profile or the crop lower limit. The steepness of the sum graph line indicates how quickly the crop is using the available moisture. When the sum line flattens this indicates less moisture being used and the crop may be experiencing stress.
At Beckom in 2011, the wheat crop in Figure 3 did not remove all the available moisture. While in 2012, the profile was completely dried in the middle of October by the Buloke barley crop sown on 20/5/12 and yielding 2.5t/ha. The wheat crop in the neighbouring paddock sown on the 3/5/12 yielded 2.8t/ha with only 118mm of growing season rainfall and did not dry the profile to crop lower limit, as shown in Figure 4. Rain in late 2012 has recharged the wheat 2012 soil profile to approximately 75% of capacity compared to the Barley which is 50% or a difference of 39 SMUs.
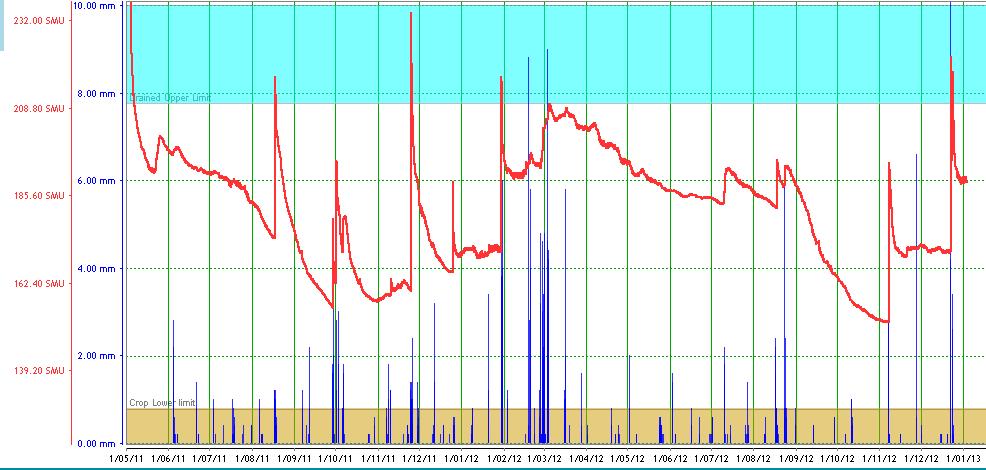
Figure 4. Beckom Wheat 2012 Sum sensor graph 2011-2013
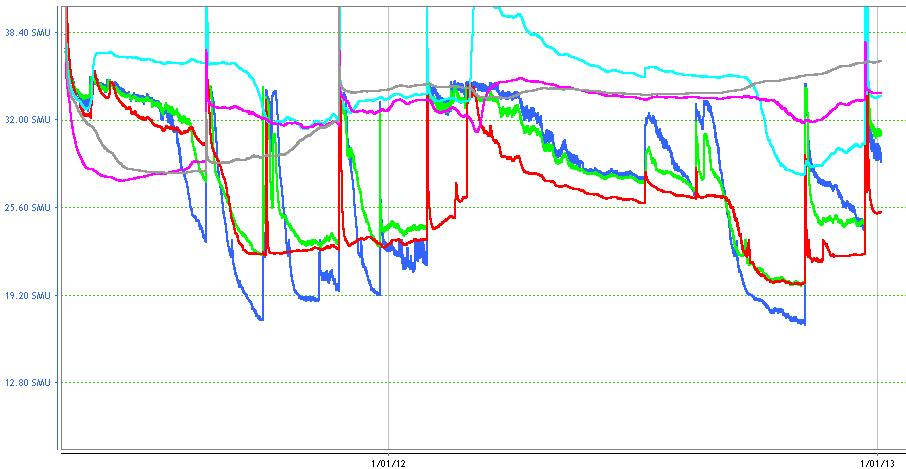
Figure 5. Beckom Wheat 2012 Separate sensor graph 2011-2013
The sum and separate graphs currently show an advantage of 39 SMUs in the wheat paddock from 2012.
This raises the question with the historical and current information we have, how could these paddocks be managed to maximise production or limit risk in 2013?
Table 1. Moisture and crop information 2012 - 2013. 118mm = Decile 1.
| Wheat 2012 – 2.8t/ha | Barley 2012 – 2.5t/ha | ||||||
| SMU 1/4/12 | N 30/3/12 | GSR 2012 | Stubble cover 1/1/13 | SMU 1/4/12 | N 30/3/12 | GSR 2012 | Stubble cover 1/1/13 |
| 203(93%) | 24kg/ha | 118 | 4.2t/ha | 179(83%) | n/a | 118 | 3.75t/ha |
| Wheat 2013 | ???? 2013 | ||||||
| SMU 1/4/13 | N 30/3/13 | GSR 2013 | Target yield | SMU 1/4/13 | N 30/3/13 | GSR 2013 | Target yield |
| 189(87%) | <49kg/ha | 118 | 2.8t/ha | 159(73%) | n/a | 118 | 0 |
We have lots of information from previous years available to help us plan for the coming season. I have assumed that we will get another 20mm rainfall prior to a sowing break which will be stored in the soil and maintain current moisture levels. Moisture probe levels can be monitored regularly to aid in decision making. From soil tests, we will get an accurate assessment of nutrient levels for sowing but the figures represent what was there at harvest 2012.
What we know:
- 4.2t/ha stubble - this will provide enough ground cover to collect and conserve moisture. The WUE trial at Temora has highlighted that 2t/ha is a minimum level. 4-5t/ha will aid in reducing evaporation losses in summer and winter.
- Must control summer weeds to conserve moisture and nitrogen.
- 90% chance of getting at least 118mm GSR (decile 1).
- 87% of a full moisture profile that will remain until sowing if protected (see above assumption of 20mm out of season rainfall (OSR) until April 2013). More than 20mm OSR will increase profile moisture from current levels.
- Under similar circumstances in 2012 we achieved 2.8t/ha wheat yield at Beckom.
What strategies can we use to help achieve our minimum target wheat yield of 2.8t/ha in 2013?
Because we have an accurate pre-sowing measure of soil moisture we can have a good level of confidence when we set the crop up.
- Control weeds over summer as required.
- Maintain 2t/ha ground cover. More is better, and > 5t/ha will reduce evaporation.
- Sow as early as possible with a suitable variety. Recent trial data from Temora and Junee has shown yield increases from long season varieties (Eaglehawk, Bolac) sown early, compared to short season varieties (Lincoln) sown in mid May, when there is a good moisture profile available at sowing. Early sowing allows greater root development and thus increases total amount of PAW. Probes measure to 118cm, wheat roots can go 190cm.
- Target a flowering date of 26th September at Beckom for your sowing opportunity. Eg. Eaglehawk sown 15th April flowers on the 5th October at Temora. This will minimise frost and heat stress risk, calculated from 110yrs weather data using APSIM model.
- Select a wheat variety with appropriate disease ratings.
- Select a seed rate based on soil N test and sowing time. Reduce seeding rates if soil N is high and sowing early.
- Select fertiliser rates based on soil analysis, especially deep N.
- Plan your agronomy to suit known in-crop weeds and disease.
- Consider 'well managed grazing' for livestock production and to reduce early biomass. Remove stock before crop growth stage of zadok 30 is reached. WUE trial work at Temora has confirmed there is little impact on yield and soil structure from well managed grazing of long season spring wheats.
What could you do if the moisture probes indicate low soil moisture levels in the profile?
For this example we will consider the Barley paddock from 2012 at Beckom.
What we know:
- 3.75t/ha stubble, adequate
- Three cereals in successive seasons 2010-2012 = raised disease pressure + weeds
- Must control summer weeds.
- Low N status (confirm with soil tests).
- 90% chance of getting at least 118mm GSR, decile 1.
- 73% moisture profile.
What strategies could we use for this paddock?
Strategy selection will be determined by the manager's aversion to risk.
- Low risk – Brown manure or long fallow. Low cost, conserves moisture, increases N, disease break and decreases weed seed banks. No income in 2013. Brown manure will conservatively fix 100kg/ha of N at a value of $140/ha. Cost approximately $80/ha depending on management. Low rates or no starter fertilizer, consider previous years weed species and densities.
- Medium risk – Grain legume crop or pasture. Higher establishment and management costs, low production off year 1 pasture, uncertainty of grain legume prices, variability of N fixation for grain legumes, selective post emergent or in crop herbicides may reduce weed seed bank and disease break.
- High risk – Canola. High establishment and management costs, disease break, weed seed bank reduction and no N fixation. Will require a good establishment opportunity in April and high nutrient inputs.
What other ways can moisture probes assist in management decisions?
Being able to accurately measure soil moisture when required provides opportunities to aid management and marketing decisions at various stages in the production cycle. As more information is collected over a wider range of seasons we believe that confidence levels in their use will increase. Table 2 below details some of the areas we believe probes can play an important role.
Table 2. Areas that soil moisture probes can play an important role.
| Crop stage | Probe level | Management action |
| Sowing | High | Early sow long season varieties, canopy management to maximise yields. Up front N. Consider forward contracting if prices favourable (e.g. 2.8t/ha @ decile1). |
| Mid | Reduce up front input costs, seed rate, fertiliser, herbicides. Canopy management for average yields. | |
| Low | Reduce up front input costs, seed rate. Consider decreasing area sown, target lower risk crops and more productive paddocks. | |
| Early / late tillering | High | High confidence in N applications, weed and disease management. |
| Mid | Lower confidence level. Reduce rates of N applications. | |
| Low | Low confidence level. Reduce costs, consider grazing or hay later in the season. | |
| Stem elongation | High | High confidence. Apply late N, fungicides and pesticides. Consider forward selling options if favourable. |
| Mid | Lower confidence. Reduce rates of N and forward selling quantities. | |
| Low | Low confidence, no N, no forward selling, consider grazing and hay production. | |
| Flowering | High | High confidence. Consider forward selling options if favourable. Head counts to determine potential yield. |
| Mid | Lower confidence. Reduce forward selling quantities. Head counts to determine potential yield. | |
| Low | Low confidence, no forward selling, consider grazing and hay production. | |
| Pre harvest | High | Determine potential yields. Adjust insurance estimates. |
| Mid | Determine potential yields. Adjust insurance estimates. | |
| Low | Determine potential yields. Adjust insurance estimates. |
Acknowledgements
Project Funding - Murrumbidgee CMA, and Department of Agriculture Fisheries Forestry - National Climate Adaption and Mitigation Initiative
Contact details
Paul Breust
FarmLink Research Ltd
17 Denison St, Junee NSW 2663
0407 009 750
paul@farmlink.com.au
Was this page helpful?
YOUR FEEDBACK