Using RTK steering data for soil erosion control and water logging prevention
Author: Tim Neale, PrecisionAgriculture.com.au | Date: 06 Nov 2012
Tim Neale, PrecisionAgriculture.com.au
Take home message
- Your RTK GPS steering system can collect high accuracy elevation/height data whilst performing normal paddock operations
- Elevation data is useful for soil erosion control by planning position of contour banks and waterways, as well as being used to predict erosion ‘hot spots’
- Data collected over time can be used to determine tonnes of soil movement after flooding or severe erosion events
- Downslope driving will enable you to determine existing contour bank profiles to ensure adequate capacity
- Waterlogging/ponding areas can be easily determined, and can be used to look at drainage planning options or land levelling
- New software and the use of GPS blade control can significantly reduce the amount of earthworks compared to conventional laser methods
Introduction
Soil conservationists have been using different forms of mapping for many years to determine water flow and control on Central Queensland farms. However, recent advances in RTK GPS auto-steer technology have re-defined the way we look at erosion and water management on farms.
Many farmers have purchased auto-steer for their tractors, but many don’t know that they have an added bonus with this equipment. Topographical (or elevation mapping) starts with the collection of elevation/height data from an RTK GPS system. These highly accurate (less than 50mm vertical accuracy) GPS systems that are used to auto-steer agricultural machinery are variations of the same systems that are used by surveyors to collect spatial data. Once the data is collected, we can analyse the data to produce contour, elevation, slope and aspect maps.
Elevation data can be collected by the GPS system whilst it is steering a tractor performing a farming operation. Alternatively, if the farmer does not have RTK GPS, the data can be using an RTK GPS mounted in a quad bike or 4WD vehicle (photo below).
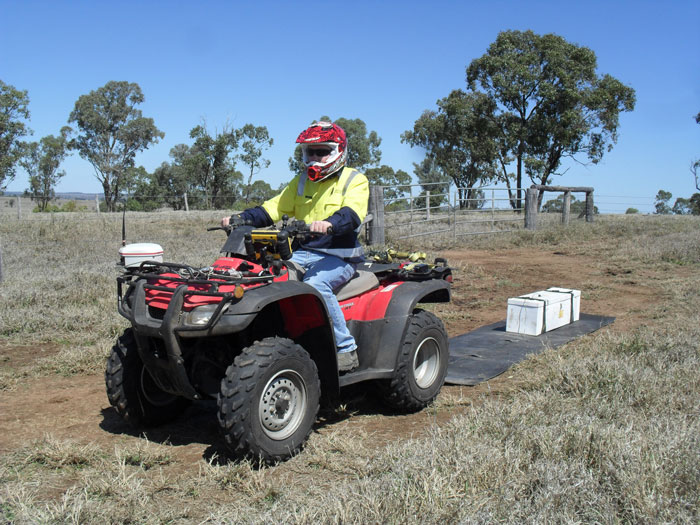
Figure 1: RTK GPS mounted in a quad bike
The elevation data is collected by driving the vehicle over the paddock at regular swath intervals; with the GPS unit logging data points every few metres. Obviously, the narrower the swath width the better, as more data is collected to produce more detailed topographic maps of the landscape, which is an advantage of data collected from a tractor conducting an operation such as planting.
On some systems, such as Auto-farm, you need to turn the logging feature on as it doesn’t happen automatically. Others, such as Trimble and John Deere, collect when you are doing coverage mapping, and can be easily exported. The best way for us to use the data is to copy and paste the complete data card and send via a DVD. For John Deere customers, if already have your data in JD Apex, you can do a batch export. A detailed guide on how to do this can be found at http://www.precisionagriculture.com.au/news-and-articles.php
Topographic farm maps are extremely useful for planning farm layouts that achieve the best possible compromise between operational efficiency and surface water management. Planned farm layouts aim to maximize farm operational efficiency, control erosion, and minimise water logging. The value of topographic information is considerably increased when the contours lines are laid over high-resolution aerial or satellite imagery, as the picture below shows.

Figure 2: Contours lines are laid over high-resolution aerial or satellite imagery
New software such as Optisurface allows us to examine the data in 3D as well. This helps in the visualisation of the field. A video of this can be seen on YouTube (http://youtu.be/TSzq9NR-Nx0).

Figure 3: Optisurface allows us to examine the data in 3D
Another feature of Optisurface is that you can model runoff velocities and depths from a paddock with a simulated rainfall event. The runoff velocity preducitions are shown below left and satellite image on the right. You can see where the velocities are high (red), this correlates well with the image on the left showing the actual erosion scars.


Figure 4: Runoff velocity model (left) correlates well with the actual erosion scars (right)
Another example (500ha paddock) is shown below with the simulated runoff velocity (m/sec) on the left and runoff depth (m) is on the right. Note contour banks on right are full of water. In this paddock and additional contour bank is probably needed. This mapping is very useful to determine the erosion hotspots in the field, before it even rains.


Figure 5: Simulated runoff velocity (m/sec) on the left and runoff depth (m) is on right
If you are driving directly up and downslope with your operations, then you can also use the data collected from the autosteer to examine your contour bank spacing’s and capacities. The data below is the plot of elevation data in MS Excel. The small bumps are each contour bank. It is easy to see both the depth of the bank and the profile. The machine obviously needs to be logging very regularly to get this sort of information (i.e once a second).

Figure 6: Plot of elevation data in MS Excel
With the recent flooding and erosion some people experienced extreme soil losses. Using data collected from before and after the erosion or flood, you can compare between the two. This is assuming the two maps are collected with the same tractor/sprayer, and the base station was not ‘averaged’ or moved between dates.
The map below left shows a post flood topography map top (blue = higher, red = lower) and the map on the right shows erosion/ deposition (white = erosion, bright blue/yellow = deposition, brown = little change). At this site we calculated that 34,000 tonnes of soil was eroded, and 30,000 tonnes deposited.


Figure 7: Left shows a post flood topography map top (blue = higher, red = lower) and the map on the right shows erosion/ deposition (white = erosion, bright blue/yellow = deposition, brown = little change)
So if you have purchased a dual-frequency RTK “2cm” system from Trimble, Autofarm (GPS-Ag), John Deere, Beeline, Leica, or AgGuide, you could get a topographic map for your farm which could help with drainage, farm layout, as well as the positioning of contour banks.
Acknowledgements
Thanks goes to FBA for funding the Optisurface work in CQ, Graham Spackman, as well as QDAFF Emerald staff Richard Sequeira and Max Quinlivan.
Contact details
Tim Neale, FARMpos Pty Ltd
Ph: 0428 157 208
Email: tim@precisionagriculture.com.au
Was this page helpful?
YOUR FEEDBACK