Yield and protein relationships in wheat
Author: Neil Fettell, Rohan Brill, Matthew Gardner and Guy McMullen | Date: 31 Jul 2012
Neil Fettell1, Rohan Brill2, Mathew Gardner2 and Guy McMullen2,
1University of New England, Condobolin; 2NSW DPI, Coonamble & Tamworth
Keywords: grain protein, grain yield, EGA Gregory , LongReach Spitfire
Take home messages
Grain protein is determined by the balance between the nitrogen (N) requirement of a crop and the supply of N to that crop, as well as by environmental conditions during grain filling. Yield and grain protein concentration are often negatively correlated.
Nitrogen nutrition is the major management factor growers can use to alter grain protein; variety choice plays a relatively minor role.
The reportedly lower grain protein concentration of EGA Gregory is primarily a result of high yield and a resultant dilution of protein. Gregory appears to be within 0.8 percentage units of most other varieties at comparable yield levels.
Initial results indicate that LongReach Spitfire may have a higher grain protein concentration at a given yield level relative to other wheat varieties.
In choosing a variety, growers should take these factors into account in conjunction with disease ratings, maturity group, yield performance and quality premiums.
n.b. at first mention of a variety, if applicable the Plant Breeders Rights symbol will be used, thereafter however, the symbol will be omitted.
BackgroundGrain protein was a crucial issue for growers in the past two seasons. For the 2011 harvest, there were large premiums (up to $80/tonne) paid for AH and APH grades over ASW and APW. While the premiums for these grades can be highly variable, they have encouraged growers in central and southern NSW to select varieties acceptable for these grades. There has also been considerable discussion among growers and agronomists as to whether some varieties achieve higher grain protein than others when grown under the same conditions.
Nitrogen nutrition and grain proteinGrain protein is determined by the balance between the N requirement of a crop and the supply of N to that crop, as well as by environmental conditions during grain filling. The N requirement of a crop is set by the water-limited yield (stored moisture plus in-crop rainfall), the crop species (e.g. wheat, barley, canola), the desired grain protein and crop management (disease, phosphorus supply, weed control and sowing time).
The N supply for crops in most regions comes mainly from decomposing organic matter and this is controlled by the amount of organic matter, the quality of the organic matter (carbon to nitrogen ratio, particle size), soil type and suitable conditions of temperature and moisture for mineralisation. Fertiliser N usually accounts for a small proportion of total N supply but can still be crucial for achieving desired yield and protein targets.
Optimising N supply is difficult in rain-fed cropping given the highly variable seasons. Excessive application of N may increase water use early in the growing season leading to greater water stress during flowering and grain fill, resulting in poor grain set or shriveled grain. Insufficient N may limit grain yield and grain protein, reducing profitability. Within a given season, fertiliser rate and timing are the major tactical tools used for N management. Applications of N at sowing or up to the start of stem elongation can increase crop biomass, grain number and grain yield whereas later applications (around anthesis or GS61) have little influence on grain yield but can drive a significant protein response.
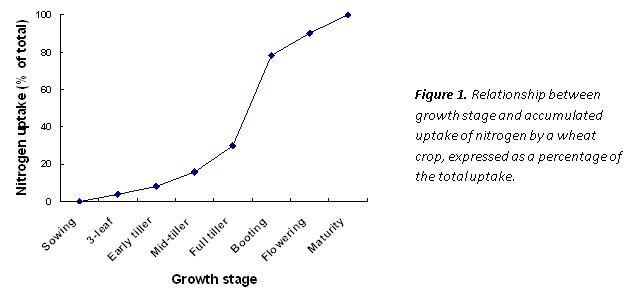
The time course of N uptake by a wheat crop at Condobolin is shown in Figure 1. Early growth consists predominantly of leaves and while these have a high N concentration the low dry matter at this stage means that the total requirement is low (Figure 1). Demand is greatest during stem elongation and ear emergence, a period of rapid dry matter production, during which about 60% of total uptake occurs. This explains why N fertiliser application during tillering can be very effective for yield, provided conditions are suitable for N uptake.
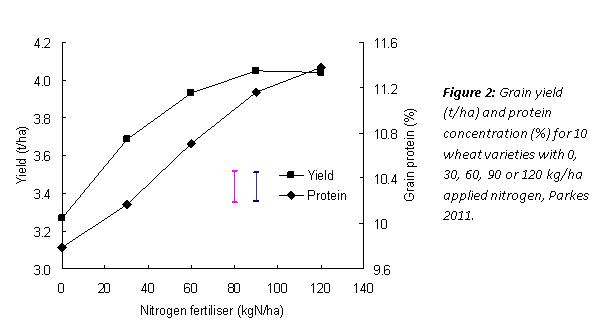
Much of the N that is converted into grain protein is taken up before flowering, stored in the leaves and stems and remobilised during grain filling. Protein synthesis continues in the grain throughout filling, the rate of N accumulation being almost linear (Figure 2). Water stress or high temperatures during grain fill can result in high protein percentages because these conditions tend to reduce starch synthesis more than protein synthesis
As the rate of N supply is increased, yield will generally increase to a maximum level, whereas protein may continue to increase with further N application. This is demonstrated by the results from a trial at Parkes in 2011, sown as part of the GRDC- funded Variety Specific Agronomy Project (Figure 2). Wheat yield was responsive to N fertiliser but at a reducing rate where N was applied in 30 kg/ha increments. Yield was maximised with N application of 90 kg/ha. Protein increased linearly for each 30 kg/ha increment up to 120 kg/ha N. In this trial, yield appeared to be maximised at a grain protein concentration of 11.2 %, a useful ‘rule of thumb’ in deciding whether a crop was yield limited by N.
It is generally considered that there are only minor differences among commercial varieties in regard to grain protein accumulation. However, there have been suggestions from growers and agronomists that, relative to other varieties, Gregory has a lower grain protein concentration. It must be noted though that Gregory has demonstrated wide adaptation across grain growing regions in New South Wales with high relative yields, good resistance to stripe rust, high level of tolerance to root lesion nematode (Pratylenchus thornei), flexibility with sowing date and classification as an AH or APH variety depending on the region.
NVT dataVariety comparisons for protein accumulation are difficult because of the ‘dilution’ effect from variations in grain yield. In a preliminary study, the relationship between grain yield and protein was examined using results from the NVT trial network. This approach has some limitations as the protein measurements are not replicated at each site and it was not possible to weight individual sites according to the precision of the trial, but the large number of sites lends confidence to the findings. Gregory was compared to Sunvale, a variety with similar phenology and quality, together with the newly-released Spitfire, using the 103 main season NVT trials (since 2008) in which all three varieties were present. Across these sites, Gregory was the highest yielding variety and Sunvale was the lowest, while Gregory had the lowest and Spitfire the highest grain protein concentration.
A regression analysis of grain yield and grain protein concentration showed the expected dilution effect, with protein decreasing as yield increased. The slope of this relationship was similar for the three varieties, grain protein decreasing by 0.6 percentage units for each 1 t/ha of yield increase. However, grain protein at any yield level differed significantly (P<0.001) among varieties, with the value for Gregory being 0.8 lower than Sunvale. This lends support to the observations made by growers and agronomists but the magnitude of the difference is probably not enough to influence variety choice. In contrast, Spitfire protein values were 1.5 units higher than Gregory across all yield levels.
Varietal differences in grain protein concentration and the relationship between yield and grain protein were examined further using information from the GRDC-funded VSAP project, using a sowing time trial at Condobolin and N use efficiency trials at Condobolin and Parkes, all conducted in 2011.
Condobolin sowing date trial
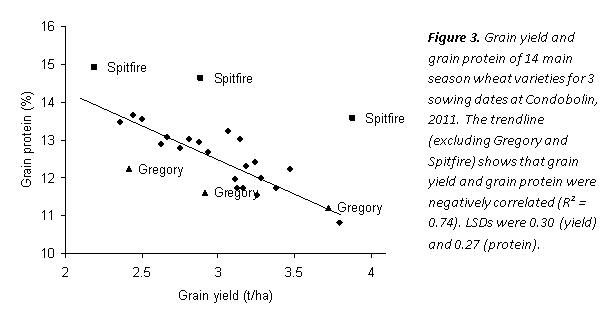
Grain yield and protein values for 14 main season wheat varieties sown on three dates at Condobolin in 2011 are presented in Figure 3. Gregory (and Waagan) grain protein values were significantly lower than the other varieties (11.6 cf. 12.7) whereas Spitfire was much higher (14.4 cf. 12.7). All varieties followed the trend of reduced protein with increased yield, at a rate of 0.6 percentage units for each 1 t/ha of yield increase. The lower protein of Gregory was only partly explained by its grain yield, while Spitfire achieved greater protein concentration than other varieties at all yield levels.
The Condobolin NUE trial contained nine wheat varieties sown at 5 N rates. There was no significant effect of N rate on grain yield but the effect on protein was significant with protein increasing with rates of applied N. As for the sowing time trial, there was a negative correlation between grain yield and grain protein concentration, and Gregory did not differ from other varieties. Once again Spitfire as an exception achieving a protein concentration about 1.5 units higher than expected from its yield.
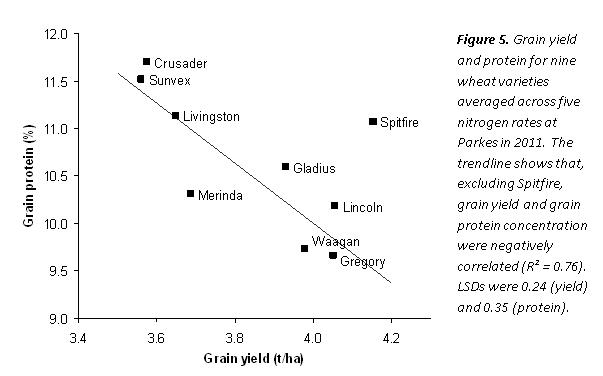
Parkes NUE trialAt Parkes nine wheat varieties were sown at five N rates, from 0 to 120 kg/ha. Eight of the nine varieties (including Gregory) followed the general negative correlation between grain yield and grain protein concentration. The exception was Spitfire which produced a relatively high grain protein concentration at a high yield level (Figure 5). The slope of the protein dilution relationship at this site was quite steep (3% protein per t/ha), and gross returns may have been higher with a lower yielding variety (e.g. Crusader![]() , Sunvex
, Sunvex![]() ) achieving a higher grain protein.
) achieving a higher grain protein.
The analysis of NVT data and the 2011 trial results confirmed the negative correlation between grain yield and grain protein concentration, although the slope of the relationship varied greatly among sites. For the biggest data set, the NSW NVT trials, grain protein decreased by 0.6 percentage units for each 1 t/ha of yield increase for the three varieties examined. The relative importance of yield and protein will depend on grain prices and particularly the spread between grades. The situation is further complicated by “cliff-face” pricing between grades and by price volatility at harvest time.
The results also suggest that Gregory may sometimes achieve somewhat lower protein concentrations at a given yield level than other mainstream varieties. In the NVT trials, Gregory was 0.8 percentage points lower than Sunvale, and at Condobolin it also fell below expected proteins for its yield level in some comparisons. In others, it grouped closely with other varieties on the yield/protein relationship, achieving lower protein levels only as a result of higher yield. Overall, the magnitude of the difference from other varieties is probably not enough to influence variety choice, given the high yield and other attributes of Gregory.
The performance of Spitfire was particularly interesting. In the NVT trials, Spitfire achieved protein concentrations that were 0.6 % units higher than Sunvale and 1.5% higher than Gregory. In the 2011 trials, Spitfire had protein values 1.5 to 2.5 % units higher than other varieties at the same yield level. These findings need to be confirmed and work is underway to investigate the mechanisms of this response. Meanwhile, producers and agronomists are advised to treat this information cautiously and select varieties based on their overall agronomic package rather than on one trait in isolation.
While this paper has focussed on genotypic responses, these play a relatively minor role in determining grain protein compared to N nutrition and environmental conditions during grain filling. Future work within the VSAP project will investigate whether N rates or timing should vary for different varieties, especially with regard to varieties such as Gregory and Spitfire.
AcknowledgementsJim Presley, Nick Moody, Katrina McDougall, Linda Brangwin and Scott Boyd are thanked for their expert assistance in the field and laboratory.
Contact details:
Neil Fettell
University of New England
02 68951008
Was this page helpful?
YOUR FEEDBACK