BETTER AGRONOMIC DECISIONS FOR NEW WHEAT VARIETIES
| Date: 17 Sep 2010
The release of new wheat varieties in recent years has often been with limited trial information, particularly at the more local level. Given the variable seasonal conditions of late, more informed decisions can be made with better local information and knowledge to improve overall crop performance and water use efficiency.
Several I & I NSW projects in central western NSW in 2009 aimed to gather data on a number of different wheat varieties that have been quickly adopted as preferred varieties and to compare them to older more well known varieties.
Crop phenology
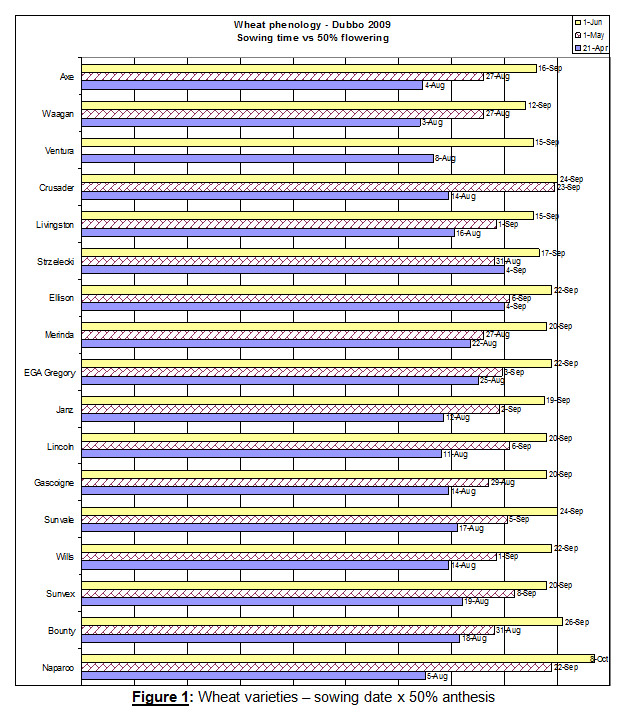
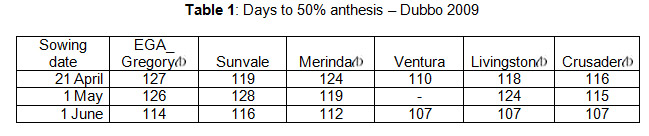
Understanding and predicting wheat growth stages is important for enhancing management practices. Determining optimum sowing times so flowering occurs when the risk of frost damage is minimised and maximising the period of grain fill before the stress of high temperatures and low moisture impact is critical. To establish some baseline phenology data, a selection of wheat varieties were grown under irrigation and sown at three sowing dates (Figure 1).
Temperatures were recorded at hourly intervals to calculate thermal time. Thermal time (in degree days or ºCd.) is based on daily maximum / minimum temperatures (minus a base temperature, usually 0ºC). The accumulation of thermal time determines the start and end of each phase of growth and development. The rate of development is also responsive to photoperiod from emergence (Zadok 10).
Reproductive development
Potential grain numbers are established 2 – 3 weeks prior to anthesis. Potential grain size is determined by the size of the ovule (i.e. just prior to anthesis) and then by cell division during the week after fertilisation. The supply of carbohydrates during this period will determine if this potential is met. These phases are followed by grain fill as carbohydrates and protein are deposited in the grain.
The duration of grain filling is specific to individual varieties. Stem carbohydrates from photosynthesis and the stem, move into the grain, beginning about 10 days after anthesis. Temperature and moisture affect photosynthesis and starch synthesis and to a lesser extent carbohydrate transfer. Critical temperatures for wheat at this stage of development are 14ºC (average daily temperature).
At Dubbo, the average daily temperature at 27 September is 15ºC (SILO data: 1900 – 2007). Unusual seasonal conditions in 2009, saw average daily temperatures of 15ºC occur as early as 22 August, with average daily temperatures remaining below 20ºC up until the third week of October. This had a major positive effect on grain size and the level of screenings under low soil moisture conditions.
The probability of a late frost occurring at Dubbo is around 20% at 10 September, declining rapidly to 10% by 14 September (Gordon pers comm.). At the same time, daily evaporation rates are rising quickly, increasing the risk of moisture stress when critical grain development is taking place. The late frost that occurred 8 October 2009 will be talked about for years to come, however the impact of moisture stress is of far greater risk.
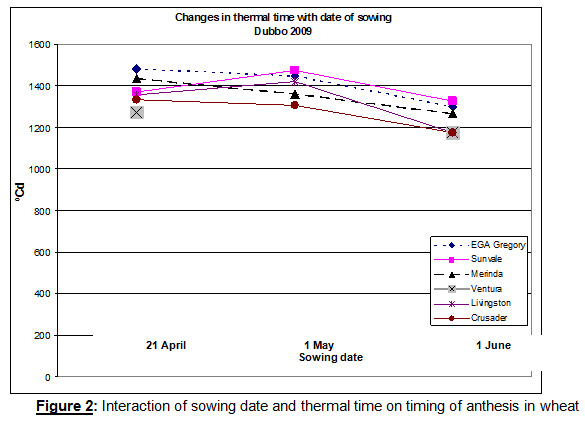
Later sowing dates have the effect of shortening the duration of plant growth stages as the influence of photoperiod (lengthening daylight hours) and temperature (thermal time) interact. Figure 2 shows the changes in the time taken to flowering, measured in thermal time.
Shortening the duration of growth phases has the effect of reducing overall crop biomass. This decreases potential crop yield. Sowing a variety at a date that allows the maximum time for critical growth phases to develop maximises yield potential. This information has to be used in conjunction with local climatic data to balance risk
Plant population project
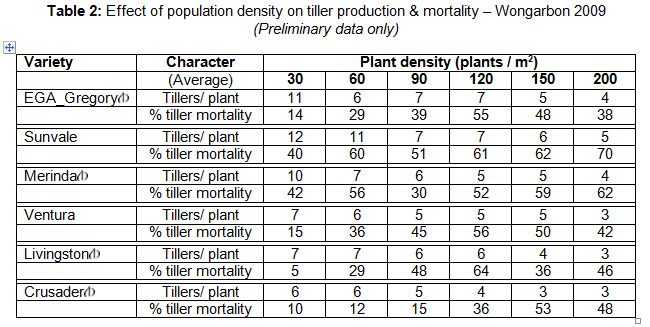
The interaction of varieties with environmental conditions will always complicate things. In addition to phenological responses, four sites located at Wongarbon, Trangie, Peak Hill and Goonumbla were sown to determine the qualitative and quantitative response of different varieties to local seasonal conditions. Six varieties, EGA_Gregory , Sunvale, Merinda , Ventura, Livingston and Crusader were sown at six plant densities (30, 60, 90, 120, 150, 200 plants /m2).
Tiller mortality
Wheat is able to compensate and adapt to environmental conditions under different plant populations, producing more tillers than survive to produce grain. Individual varieties vary in their inherent capacity to produce tillers. Some varieties like Sunvale are well known for producing high tiller numbers in contrast to varieties such as Ventura and H45 that produce low tiller numbers.
Tillers progressively develop. Stress during this stage of development caused by the interaction of environmental conditions (most commonly limited moisture), and plant population have the greatest impact, reducing tiller numbers and so potential grain yield. Less available soil moisture for remaining viable tillers reduces all components of spike (ear) production like grain number and grain size.
Table 2 illustrates the range of inherent tillering capacities of individual varieties measured at immediately after the end of tillering (Z31). Tiller mortality was measured at in mid November.
At the Wongarbon site, there was approximately 80 mm of available soil moisture at sowing. Scattered follow-up rainfall throughout June and July allowed excellent early crop development. Tillers began to die off, the youngest first during August as soil moisture levels became progressively lower. Higher tiller densities caused greater competition for limited moisture later in the season, with the resulting greater proportion of tiller mortality in higher plant populations.
Changes in rate of plant development
Under conditions where moisture stress is severe, crop development may be delayed. Similarly, thermal time can be reduced by moderate moisture stress, causing an acceleration of plant development.
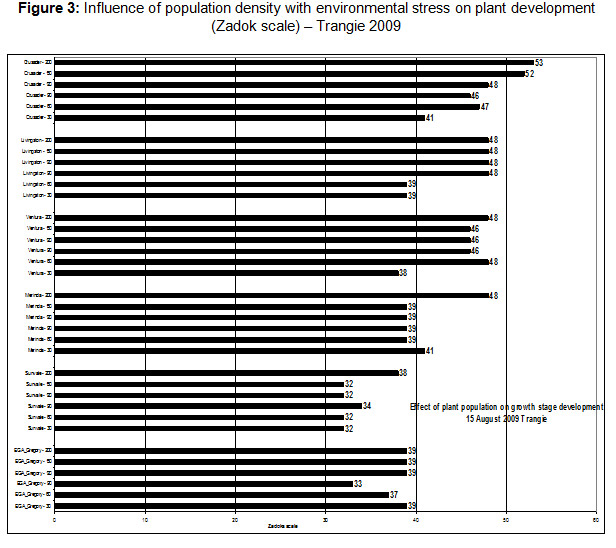
This was seen at the site located at the Trangie Agricultural Research Centre. Observations recorded 15 August showed marked differences between individual varieties with the effects of plant population having an impact on the rate of crop development as soil moisture was progressively becoming a major limiting factor (Figure 3).
For example, Crusader at a population of 30 plants /m2 was just entering the early boot stage with the sheath of the flag leaf beginning to extend. Higher populations were more advanced, already at the late boot stage with the two highest populations of 150 and 200 plants /m2 showing the early signs of head emergence from the boot. In contrast, Sunvale and Merinda showed minimal or no response at the lower plant populations. Only at the highest population of 200 plants /m2 was there a marked increase in the rate of development during stem elongation.
Changes in the rate of plant development have the most significant response if they occur during the grain filling period.
Crop production – grain quality, economics, water use efficiency
Targeting a tiller density by adjusting seeding rates and therefore plant populations, increases efficient use of available soil water and nutrients. The effect this has on final crop performance will vary, depending on the nature of the stress, its duration and intensity, and the stage of development at which it occurs. This is then reflected at harvest in grain yield and quality.
While the total amount of water used by varieties is similar, higher yielding varieties are more efficient in their use, producing more grain for each unit of water used. This is more apparent in seasons where there are higher levels of water use. Plant populations have a major impact on overall crop water efficiency.
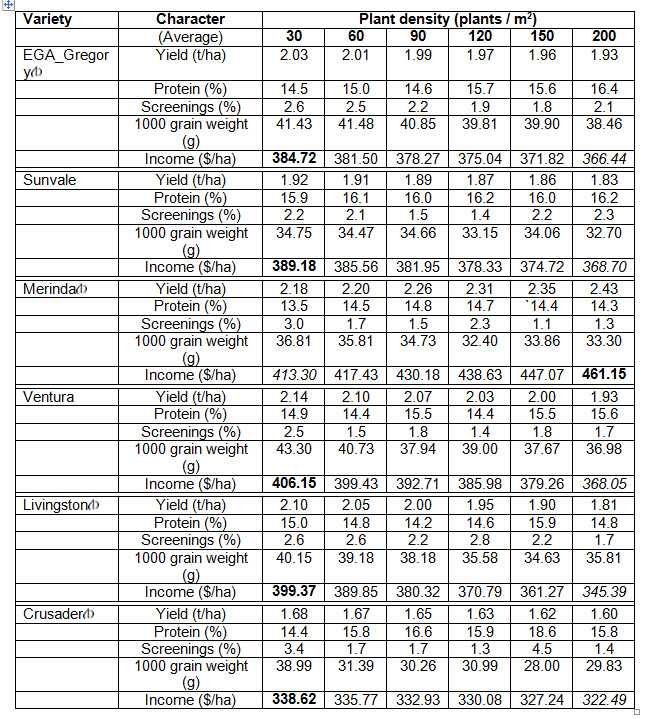
Table 3 shows the harvest results of the site at Peak Hill. Sown on approximately 100 mm of available soil moisture, only 3 falls of effective rainfall (totalling 20 mm) during the months of July and August meant tiller production was inhibited with high mortality relatively early in the season. The remaining tiller density was effectively much lower when useful rain fell in mid and late September, enabling better grain production.
Cooler October temperatures during the grain fill period caused lower overall evaporation rates, effectively increasing available moisture. This allowed plants to continue to fill grain that would otherwise be smaller and with greater level of screenings.
Yields at Peak Hill were relatively consistent due to the moisture constraints early in the season. By limiting tiller production, potential yields were restricted. Tillering is highly significant. It is the main means by which wheat plants can compensate when populations are low or seasonal conditions improve.
Conclusions
Yield is the main determinant of crop profitability. The growth and development response of individual varieties to environmental conditions will determine when critical growth stages occur. This is managed by growers through sowing time. In seasons where adverse changes in growing conditions are a common, the capacity of different varieties to maintain grain yield under different plant densities will determine final crop profitability.
Acknowledgements
Trial sites: Craig Walters – Wongarbon, Byrne Partners – Peak Hill, North Parkes Mine, Geoff McCallum - Goonumbla, Trangie Agricultural Research Station
Seed was kindly provided by – Agrigrain, Narromine & AGT Seeds. Special thanks to Jeremy Brown & Kerry Gleeson.
Grain prices – Jim McGirr – GrainCorp, Gilgandra
TAFE NSW – Rural Skills Centre, Dubbo
Technical assistance - Paddy Steele, Jayne Jenkins, Scott Boyd, Guy McMullen, Alan Bowring –
I&I NSW
District Agronomists – Leigh Jenkins, Karen Roberts - I&I NSW
Contact details
Kathi Hertel
Industry & Investment NSW
PO Box 865, DUBBO NSW 2830
Ph: 02 6881 1276
Fax: 02 6881 1295
Mob: 0427 104 344
Email: kathi.hertel@industry.nsw.gov.au
Was this page helpful?
YOUR FEEDBACK