FERTILISERS AND FERTILISER ALTERNATIVES
| Date: 16 Sep 2009
Question:
How can we tell if the new product is cost effective?
Answer:
Answer the following questions and then decide if you are still interested in the product.
For example: New fertiliser product “Plant Feeder 2008” - $530/t, 14% phosphorus
|
Fertiliser
|
Whizbang Product:
“Plant Feeder 2008”
|
Calculations
(per tonne of product) or Comments
|
Your product of interest
|
Your calculations
|
|
Claims:
- unlocks unavailable soil nutrients
- stimulates soil microbes
- saves money
- enhances / stimulates natural plant processes
- other..
|
|
With any claim, there should be scientifically proven data /evidence to back up any claim. “Motherhood” statements or those constantly repeated does not necessarily make them true or correct. Scientific fact are frequently taken out of context and it is not as “black & white” as is often claimed and can be very misleading.
|
|
|
|
What is the analysis of the product?
- Total P content
- % of available (soluble) nutrient
- % of unavailable (insoluble or organic) nutrient
- % dry matter (ie how much is water?)
- Does it contain the nutrient’s you need the most?
|
14%
2% phosphorus
12% phosphorus
65% dry matter
|
0.02 x 1000 kg = 20 kg available P /tonne
0.12 x 1000 kg = 120 kg unavailable P /tonne
0.65 x 1000 kg
= 650 kg/t dry matter
or = 350 kg (or L) water /t
Is phosphorus your most limiting nutrient?
|
|
|
|
Are the claims of performance?
- Anecdotal (ie stories / opinions from satisfied customers?)
- Backed by independent testing?
- Comparing “apples with apples”?
|
John Smith “very happy. Crop with “Plant Feeder 2008” was the highest yielding crop”.
No
Photo of two plants
|
Did John Smith compare it with any other fertiliser? If not, how did he measure the difference in performance? Was this also the ”best” paddock on the farm? Was this crop sown on time compared to other crops? What variety? These (& other things) also affect final yield. More questions than answers!!
Testing by the vested interests may lead to misleading results. A worthwhile product should always have credible independent testing.
Check plants are at the same growth stage and species. Response will vary as every paddock is different (soil variations / crop / pasture / cultivation / weeds / fertiliser history, sowing time, variety etc etc).
|
|
|
|
Fertiliser
|
Whizbang Product:
“Plant Feeder 2008”
|
Calculations
(per tonne of product) or Comments
|
Your product of interest
|
Your calculations
|
|
Economics.
Price per tonne product (GST incl. & landed on farm)
How much per kg of available nutrient? (landed on-farm)
Compare with how much per kg of available nutrient in typical fertiliser used
If applicable… How much per kg (L) water (1 kg water = 1 Litre)
|
$530 /t
20 kg P/t
MAP = 22% available P
350 kg water /t
|
$530 / 20 kg P
“PF08” = $26.50/kg available P
$1770 /t MAP x 45 kg/ha
(45 kg/ha MAP = 9.9 kg P/ha)
=$795.50 /ha
MAP = $8.05 / kg available P
$530 x 0.350 = $185 /t
$185 x 350 kg water
= $0.52 /kg (L) water
|
|
|
Results of actual independent trials testing alternative fertiliser products
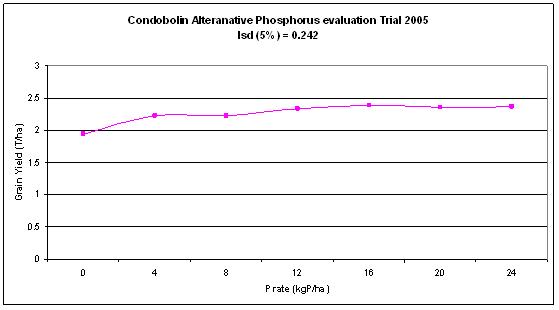
A real example, a trial conducted at Condobolin in 2005 comparing DAP and Product A in canola.
Figure 1: Canola & alternative phosphorus source “Product A”
The chart above shows there was no further significant yield response to phosphorus above 4 kg/ha.
In this example, if:
- DAP contains 20% available P. Therefore to apply 4 kg P/ha ?? 20 kg/ha DAP
- “Product A” contains 6.2% available P. Therefore to apply 4 kg P/ha ?? 65 kg/ha “Product A”
or at an equivalent rate of 65 kg/ha: DAP provides 13 kg P/ha
“Product A” provides 4 kg P/ha
Question:
If you plan to apply 4 kg/ha P, how does the cost of 20 kg/ha DAP compare to 65 kg/ha “Product A”?
Another example: Alternative Phosphorus Sources Trial - Young 2007 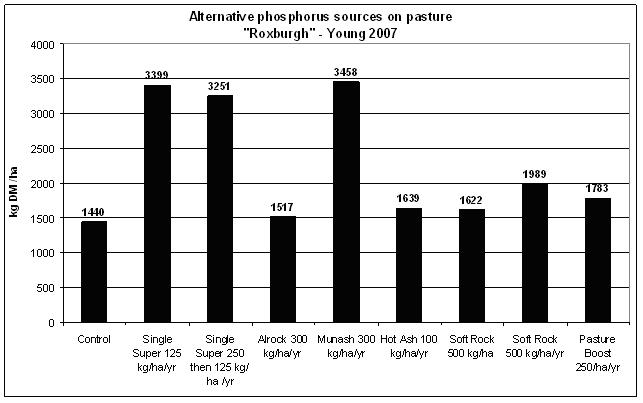
Figure 2: Alternative Phosphorus Sources Trial - Young 2007
Price of nutrients
The following two tables shows based on bulk prices what price is really being paid per kg of available nutrients.
The tables show how the price of fertiliser (GST incl.) has changed over the last 6 month period, delivered Dubbo.
Table 2: Fertiliser Prices delivered Dubbo - 5 September 2008
|
|
Available (soluble) nutrients
|
Bulk (GST incl.) delivered Dubbo 5 Sept 08
|
||||||
|
Fertiliser
|
% N
|
% P
|
% S
|
|
$/t
|
$/kg N
|
$/kg P
|
$/ kg S
|
|
MAP
|
10
|
22.0
|
2
|
|
1770
|
17.70
|
8.05
|
88.50
|
|
DAP
|
18
|
20.0
|
1.6
|
|
1750
|
9.72
|
8.75
|
109.38
|
|
Single super
|
0
|
8.8
|
11
|
|
593
|
|
6.74
|
5.39
|
|
Granulock 12
|
12
|
17.0
|
5.5
|
|
1640
|
13.78
|
9.65
|
29.82
|
|
Granulock 15
|
14
|
12.0
|
11
|
|
1456
|
10.18
|
12.13
|
13.87
|
|
Sulphate of Ammonia
|
21
|
0.0
|
24
|
|
1030
|
5.02
|
|
4.29
|
|
Urea
|
46
|
0.0
|
0
|
|
1220
|
2.65
|
|
|
|
|
|
|
|
|
|
|
|
|
|
Pasture Special
|
0
|
12.6
|
12
|
|
990
|
|
7.86
|
8.11
|
|
Pasture Starter
|
6.7
|
13.9
|
8.6
|
|
1368
|
20.42
|
9.84
|
15.91
|
|
Gypsum
|
0
|
0.0
|
17
|
|
80
|
|
|
0.47
|
|
SF 25
|
0
|
25.5
|
17
|
|
715
|
|
2.80
|
4.13
|
|
Trifos
|
0
|
20.7
|
0
|
|
1504
|
|
7.27
|
|
|
|
|
|
|
|
|
|
|
|
Table 3: Fertiliser Prices delivered Dubbo - 6 February 2009
|
|
Available (soluble) nutrients
|
|
Bulk (GST incl.) delivered Dubbo 6 February 2009
|
|||||||
|
Fertiliser
|
% N
|
% P
|
% S
|
|
$/t
|
$/kg N
|
$/kg P
|
$/ kg S
|
||
|
MAP
|
10.0
|
22.0
|
2.0
|
|
989
|
9.89
|
4.50
|
49.45
|
||
|
DAP
|
18.0
|
20.0
|
1.6
|
|
989
|
5.49
|
4.95
|
61.81
|
||
|
Single super
|
0.0
|
8.8
|
11.0
|
|
533
|
|
6.06
|
4.85
|
||
|
Granulock 12
|
11.9
|
17.0
|
5.5
|
|
996
|
8.37
|
5.86
|
18.10
|
||
|
Granulock 15
|
14.3
|
12.0
|
10.5
|
|
907
|
6.34
|
7.56
|
8.64
|
||
|
Sulphate of Ammonia
|
20.5
|
0.0
|
24.0
|
|
710
|
3.46
|
|
2.96
|
||
|
Urea
|
46.0
|
0.0
|
0.0
|
|
800
|
1.74
|
|
|
||
|
|
|
|
|
|
|
|
|
|
||
|
Pasture Special
|
0.0
|
12.6
|
12.2
|
|
784
|
|
6.22
|
6.43
|
||
|
Pasture Starter
|
6.7
|
13.9
|
8.6
|
|
1010
|
15.07
|
7.26
|
11.74
|
||
|
Gypsum
|
0.0
|
0.0
|
17.0
|
|
78
|
|
|
0.46
|
||
|
SF 25
|
0.0
|
25.5
|
17.3
|
|
560
|
|
2.20
|
3.24
|
||
|
Trifos
|
0.0
|
20.7
|
0.0
|
|
1188
|
|
5.74
|
|
||
|
|
|
|
|
|
|
|
|
|
||
Contact details
Kathi Hertel
NSW DPI, Dubbo
Ph: 02 6881 1276
Mb: 0427 104 344
Email: kathi.hertel@dpi.nsw.gov.au
Was this page helpful?
YOUR FEEDBACK