ECONOMICS OF PHOSPHORUS AND ZINC NUTRITION
| Date: 16 Sep 2009
Phosphorus
In the northern grains region P is commonly the next limiting nutrient after N; however an adequate supply is vital to ensure N is used efficiently. Critical levels for soil testing and responsiveness were established for a range of commonly grown crops during the 1960’s to the early 1980s based the Colwell P method.
Part of managing P in the north is recognising and using the differences in responsiveness that exists between crop species. Research by Lester et al. (2009) at Incitec Pivots long-term sites at Colonsay and Tulloona has confirmed common observation that grain response in sorghum is more variable than in most other crops, and may be absent after short fallows even at low available soil P. This poses questions about the use of P and managing the short-term economics of the crop or the longer-term viability and profitability of the farm.
Given that sorghum is generally a dominant crop in many rotations in the east of the Northern Grains Region and a significant secondary crop in most other areas, it is of significance to recognise that the recent research evidence for increasing the replacement/ maintenance rates for sorghum based on the research from Lester et al. indicating that the commonly used removal figure of 2.3 kg P/tonne (0.23 % P in grain) quoted in the NLWRA 2001 is probably too low for local condition. More recent studies have indicated that 3.7 kg P/tonne (0.37 % P in grain) is more realistic for modern varieties grown on the soils of the vertosols of the Darling Downs and Nthn NSW. Combining higher unit removal and high yield per unit of soil moisture makes sorghum the most influential determinant of soil P status in many areas and a key factor in soil P decline even where replacement rates are targeted.
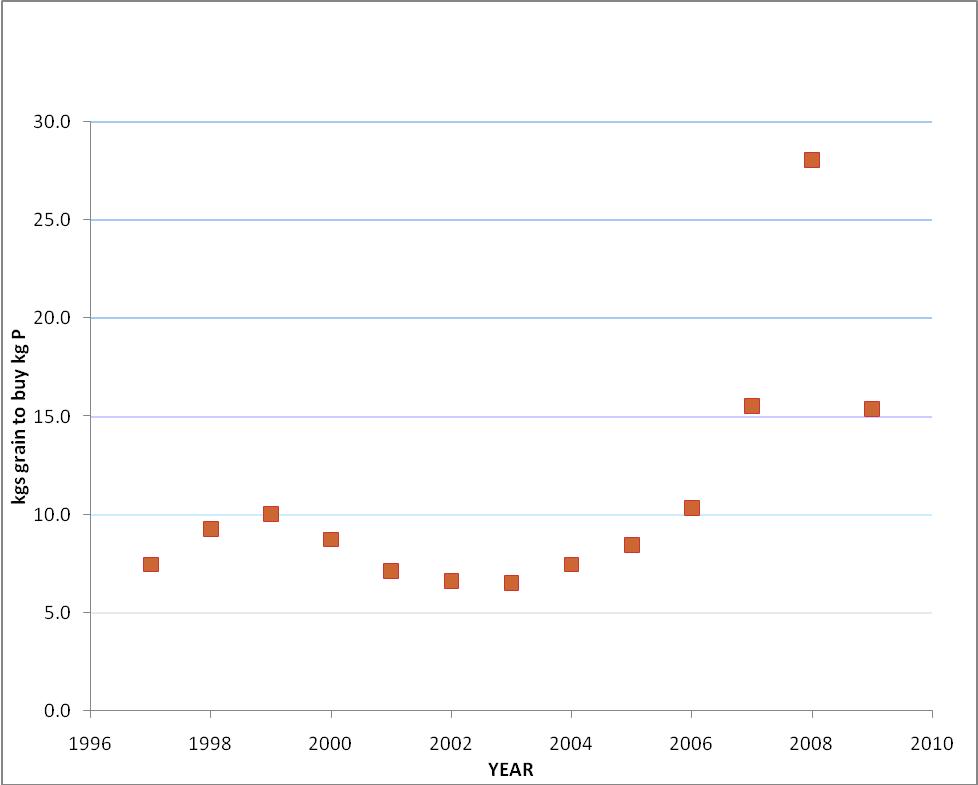
With the lack of functional and up-to-date econometric P response models for crops in this region there was significant uncertainty on best management options as a result of the 2008 fertiliser price peaks. Given that it appears to have been a single season aberration at this stage, it is assumed that there will be return to usual practice once fertiliser prices return to a more “normal“range and cash flow is re-established. Applying the pricing data of 2008 to some of the original P response data (Whitehouse 1971), on which current recommendations for wheat are founded, indicates that as the amount of wheat require to purchase a kilogram of P approaches 30 addition any rate of phosphorus fertiliser is not profitable based on returns for a single season. For each increase in the ratio of 1 (above 10) there is a need to decrease suggested P rate by about 5% to maintain profitability. This ratio was in excess of 30:1 during some months last year (Fig 1)
Figure 1. Fertiliser P (DAP) Cost Grain Price Ratio for Wheat (APW), 1996 – 2008 (ABS – April for each year)
Recent studies into the changes in soil chemistry resulting from long-term P addition and development of modern soil management techniques including reduction in tillage and controlled-traffic has caused some questioning of the fate of nutrients, sampling protocols, in particular, for those of low mobility such as phosphorus and zinc.
Lack of response and undetectable decline in low P soil with a large net negative balance suggest that the current Colwell extraction methods may not be universally effective. Recent changes in the understanding of the chemistry of soil P in vertosols of this type is indicating the need for a “new” approach that may include a back-to –the-future step of resurrecting the Whitehouse dual index for P responsiveness that was subsequently refined and promoted by Chisholm and Strong (1984).
Zinc
Zinc has a long history of research and use in the Northern Grains Region dating back to the 1960’s. Initially broadcast as zinc sulfate or zinc oxide, the growth of reduced tillage saw a change to broad adoption of zinc-fortified starter fertilisers.
Commonly a maximum of >5 % of the zinc applied is actually removed in the year of application, the majority becoming soil residual with 40 – 50 % being detectable in subsequent soil testing (Radjagukguk 1980). The combination of low removal, high residual value and regular application for Zn fortified products has seen widespread build-up of soil Zn across the region to the point where continued use of Zn at current rates or frequency should be questioned. Plant tissue analysis is generally the most reliable method to assess adequacy.
References
Chisholm R.H., Strong W.M. 1984. Improved field methods of soil analysis interpretation. Australasian Field Crops Newsletter 19, 83–86.
Lester D.W., Birch C. J. and Dowling C. W. 2009. Fertiliser N and P applications on two Vertosols in North-Eastern Australia. 3. Grain P concentration and P removal in grain from two long-term experiments. Crop & Pasture Science (in publication)
Radjagukguk, B , Edwards D.G. And Bell L.C. 1980 Zinc availability to young wheat plants in Darling Downs black earths, AJAR 31(6) 1083 – 1096.
Whitehouse M.J. 1971. Soil phosphorus calibration studies on wheat in Queensland (1963-68) QWRI Report. Section A.
Contact details
Dr Chris Dowling
Back Paddock Company
PO Box 823
Cleveland, Q, 4163
ph: 0407692251
fax: 0738213544
Email: cdowling@backpaddock.com.au
Was this page helpful?
YOUR FEEDBACK