The Impact of crown rot on winter cereal yields
| Date: 13 Jun 2008
Richard Daniel, Northern Grower Alliance (NGA) & Steven Simpfendorfer, NSW DPI Tamworth
GRDC code
NGA00001: validation and integration of new technology through grower groups in north-west NSW and south-west Queensland grain growing zones
DAN00109: Management of Fusarium and other winter cereal diseases in the northern cropping zone
Background
This project was developed from grower and adviser interest in answering a number of key questions:
1. What level of affect does crown rot actually have on barley yield and how does that compare to the impact on a range of bread wheats, durum and triticale?
2. How do Fitzroy and Grout compare to established barley varieties in the presence of crown rot?
3. How well do variety resistance ratings reflect yield losses under crown rot pressure?
What we compared
In collaboration with Steven Simpfendorfer, NSW DPI, a protocol was developed to evaluate crop and variety performance over a wide geographic range featuring different soil types, planting dates as well as starting and in-crop moisture levels. The key comparison was that all varieties were evaluated with and without added crown rot. This allowed evaluation of the impact of crown rot on yield and grain quality, independent of soil moisture and other site specific factors. Soil moisture cores to 1.2 m and PreDicta B samples were taken from each site to enable more comprehensive interpretation. Pathology data including disease incidence and crown rot severity impact by variety was conducted by Steven Simpfendorfer and his team. In addition this will provide initial (background) levels of Fusarium pseudograminearum at each site to validate against PreDicta B.
A large program of 11 trials was conducted in 2007, nine sites were managed by NGA with two additional sites (Tamworth and Breeza - irrigated) managed by NSW DPI. Plots were sown with small plot cone seeders at 12m lengths with widths of 5 or 6 rows at spacings of 25, 30 or 32cm, depending on the machine used. There were four replicates in all trials.
Table 1: Crops and varieties
|
Crop
|
Varieties
|
|
Barley
|
Fitzroy, Grout, Gairdner and Skiff
|
|
Wheat
|
Lang (5), Sunvale (4), EGA Wylie (6), EGA Gregory (3) and Sunco (6)
|
|
Durum
|
Bellaroi (2)
|
|
Triticale
|
Everest (crown rot rating unknown, only at 9 of 11 sites)
|
NB The bracketed number for bread and durum wheats are the resistance ratings on a scale of 1-9, where 1 = poor, 9 = good taken from QDPI&F 2007 sowing guide.
Seed size and % germination were determined for all seed lots with sowing rates adjusted so that equal numbers of viable seed per plot were compared for all varieties. No seed lot recorded lower than 93% germination.
Table 2: Plant stands and locations
|
Target plant stand
|
Locations
|
|
100 plants/m2
|
Goondiwindi, North Star, Croppa Creek, Mallawa, Tamworth and Breeza
|
|
80 plants/m2
|
Weemelah and Millie
|
|
70 plants/m2
|
Collarenebri, Rowena and Cryon
|
Table 3: Planting and harvest dates
|
Location
|
Planting date
|
Harvest date
|
|
Gorian
|
May 14
|
October 23
|
|
Cryon
|
May 15
|
November 6
|
|
Tamworth
|
May 24
|
November 14
|
|
Mallawa
|
May 31
|
November 8
|
|
Collarenebri
|
May 31
|
October 29
|
|
Croppa Creek
|
June 5
|
October 30
|
|
North Star
|
June 12
|
November 15
|
|
Weemelah
|
June 13
|
November 19
|
|
Goondiwindi
|
June 17
|
November 15
|
|
Millie
|
June 18
|
November 27
|
|
Breeza
|
July 10
|
December 3
|
All trial sites except Breeza were sown between mid May and mid June.
Crown rot inoculum was prepared by growing the crown rot fungus (Fusarium pseudograminearum, mixture of 5 isolates) on sterilized durum grain in the laboratory. The colonized seed was dried and added into the seed furrow at sowing in the crown rot inoculated plots at a rate of 2g/m of row.
Trials were assessed for plant establishment and harvested by small plot headers to attain grain yield and quality. Shortly prior to harvest, NSW DPI collected all plants in 4 x 0.5m of row at random locations from each plot to enable pathology ratings to be conducted. A total of 25 plants/plot were assessed to obtain pathology data based on visual extent of basal browning (crown rot severity) and recovery of causal fungi on laboratory media (incidence). All sites were GPS located to allow subsequent recropping with wheat in 2009 to examine whether differences in the levels of crown rot carryover occurred between varieties and the effectiveness of rotations across environments.
What level of affect did added crown rot have on crop yields?
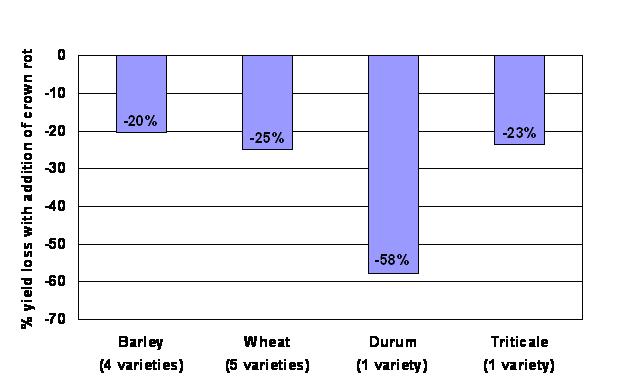
Figure 1: % yield loss by crop
• The addition of crown rot resulted in an average 20% yield loss in barley over the eleven trials
• The % yield loss in barley was similar or slightly lower than that recorded by both wheat and triticale
• The durum losses were on average more than double the other winter cereals
• The levels of yield loss are in ADDITION to any yield penalty suffered through moisture limitation in 2007 and can be attributed directly to increased infection by crown rot
Were the patterns consistent over sites?
Crown rot yield losses will of course vary with environmental and site conditions due to their interaction with the expression of the disease. Figure 2 shows the impact of equal levels of added crown rot on crop yield across the individual trials.
Differences in % yield loss reflect disease impact under varied environmental conditions eg Breeza (irrigated), Tamworth and Goondiwindi experienced ‘soft’ finishes which reduced yield impacts. Conversely, good moisture early at Millie but severe moisture stress during grain-fill increased yield losses from crown rot.
Figure 2: % yield loss by crop across all sites
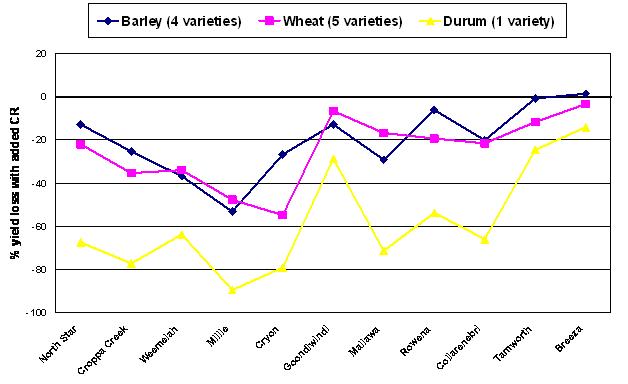
NB Triticale not graphed as only included at nine of eleven sites
• Although barley averaged a 20% yield loss, the range was from no impact under irrigated conditions to greater than 50% at the site with ‘toughest’ finish. Six of the eleven trials recorded >20% average yield losses in barley
• Wheat resulted in similar or slightly greater yield losses than barley across all trials
• The durum % yield losses were the largest of any treatment in every trial. Even under irrigated conditions at Breeza a 14% yield loss was recorded.
What were the differences between varieties?
Figure 3 highlights the performance of individual barley and wheat varieties when crown rot was added.
Figure 3: % yield loss by barley and wheat variety
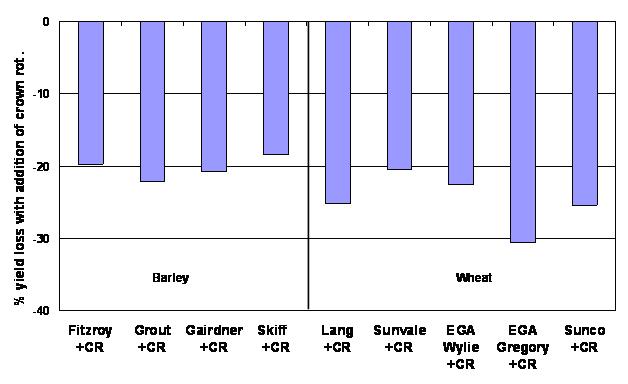
• Very narrow range in % yield losses between tested barley varieties
• Narrow range in % yield losses between tested wheat varieties.
• Wheat % yield losses did not appear to strongly reflect varietal resistance ratings
Actual yields - the real measure!
Figure 4 highlights the average yields of the individual barley and wheat varieties over the eleven trials. The % yield loss in the presence of crown rot (Figure 3) is of some value but only if yield potential of all varieties is similar. Actual yield in the presence of the disease (tolerance) more closely represents the commercial outcome eg Grout trended to having the greatest % yield loss of barley varieties but still had the highest average yield in the presence of added crown rot.
Figure 4: Actual yields by variety
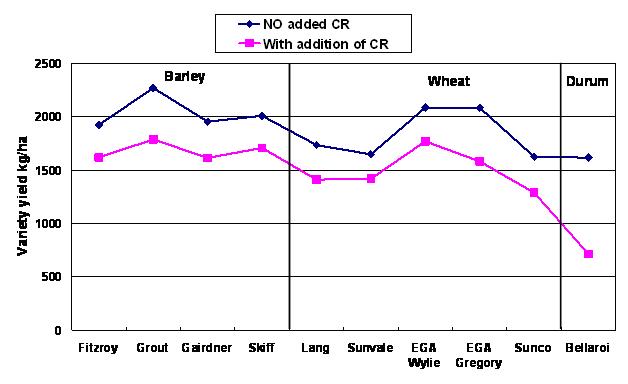
• Little difference between final barley yields when crown rot added
• Increased range in final yields between wheat varieties
• Sunco performance disappointing when crown rot added
• Durum performance generally poor (either with or without added crown rot)
• Average barley yield loss ~ 360 kg/ha
• Average wheat yield loss ~ 340 kg/ha
• Average durum yield loss ~ 900 kg/ha
Commercial implications (when crown rot added)
Grain quality samples were taken from all treatments, but results were not available at time of this report. The economic data provided is purely based on yield assuming equal grain prices for each variety.
Barley
Figure 5: Barley net returns compared to Skiff +CR as standard

Assuming feed grain price of $310 on farm
Eg When crown rot added, Fitzroy averaged 88 kg/ha lower than Skiff over the eleven trials. Fitzroy would have returned $27/ha less than Skiff assuming equal grain prices.
• Without grain quality differences, there were only small net return differences between all four barley varieties
• No consistent distinction between Fitzroy, Grout, Skiff and Gairdner on yield outcomes in presence of added crown rot
Wheat
Figure 6: Wheat net returns compared to Sunco + CR as standard

Assuming grain price of $375 on farm
Eg When crown rot added, Lang averaged 122 kg/ha higher than Sunco over the eleven trials. Lang would have returned $46/ha more than Sunco assuming equal grain prices.
• When crown rot was added, EGA Wylie and EGA Gregory both averaged >$100/ha net benefit compared to Sunco
• When crown rot was added, EGA Wylie had a significantly higher yield than Sunco in 7 of 11 trials
• When crown rot was added, EGA Gregory had a significantly higher yield than Sunco in 6 of 11 trials
• All wheat varieties provided an average net return benefit compared to Sunco
• Sunco did not significantly increase yield compared to any bread wheat variety, in any trial, either with or without added crown rot
Conclusions
Barley
• Greater level of impact from crown rot on barley yields than expected
• No consistent difference in yield between varieties when crown rot added
• Similar yield losses to bread wheat and triticale
• Additional interpretation may be provided by grain quality and pathology data
Wheat
• Narrow range in % yield loss from added crown rot between varieties tested
• All bread wheat varieties tested provided yield benefits compared to Sunco in the presence of added crown rot
• Yield results in the presence of added crown rot did not strongly reflect varietal resistance ratings
Durum (Bellaroi)
• Significant yield losses in every trial
• Rating scale for durum should be entirely different to bread wheat
• Performed poorly at ten of eleven sites in 2007, even without added crown rot
Triticale (Everest)
• Similar % yield loss to wheat and barley
Acknowledgements
Thanks to the many growers and consultants involved in this trial work and the support and advice of Steven Simpfendorfer and his pathology team.
Contact details
Richard Daniel Steven Simpfendorfer
Northern Grower Alliance NSW DPI Tamworth
Ph: 07 4698 7983 Ph: 02 6763 1261
Email: richard.daniel@nga.org.au Email: steven.simpfendorfer@dpi.nsw.gov.au
Varieties displaying this symbol beside them are protected under the Plant Breeders Rights Act 1994.
Was this page helpful?
YOUR FEEDBACK