Importance of boron tolerance in wheat
Author: David Moody and Tony Rathjen | Date: 20 Feb 2003
Take home message
Yield effects of B tolerance in wheat vary widely across sites and years but are generally positive in south-eastern Australia. In areas with grain B concentrations above 4 mg/kg a single gene for B tolerance provides an average yield benefit of approximately 4% but this benefit may be as high as 20%.
Introduction
The choice of crop varieties is one of the key decisions made annually by growers. Increasingly growers face the competing attention of seed merchants promoting the positive attributes of new varieties. The attribute of boron (B) tolerance has become a key aspect of cereal variety promotion. However many growers have little knowledge of the importance of B tolerance on their properties relative to many other variety characteristics. This paper seeks to review some of the findings of research over the last decade to provide quantitative data on the relative importance of B tolerance in southern Australia and indicate how growers can assess the benefits of the varieties with this characteristic on their properties.
Results and discussion
Over the past fifteen years varietal differences in B tolerance in wheat and the agricultural significance of B tolerance have been studied extensively. These studies have consisted of
- Glasshouse studies under controlled conditions. Key findings have included:
- Substantial differences in B tolerance between wheat varieties with varieties widely adopted in southeastern Australia often possessing moderately high levels of tolerance whilst varieties widely adopted in northern Australia and on the acid sand plains of WA have possessed relatively low levels of tolerance.
- Tolerant varieties generally have lower levels of B in leaf tissue.
- The genetic basis of tolerance in wheat is relatively simple with a series of genes with additive effects present in the more tolerant varieties. The most important of these genes which is present in Halberd Spear Frame and Yitpi has been named Bo1 and the chromosomal location of this gene has been identified.
- Tissue concentrations associated with reductions in growth in glasshouses are consistently higher than those found in the field surveys. This has raised concerns regarding the importance of B toxicity in the field.
- Correlating yield and soil B concentrations in transects across spatially variable paddocks.
- The work of Nuttall et al (2003 in preparation) has indicated soluble soil B levels in the 0.60 - 1.00m layer of alkaline soils have little correlation with root growth water extraction or yield of wheat.
- Environmental and genetic correlations between yield and B concentration in the tissue have been investigated using a diverse set of Australian wheat varieties and advanced breeding lines in field trials at sites with both high and low levels of subsoil B. Environmental correlations (re) are calculated from variation between replicates within the same variety(ies) whilst genetic correlations (rg) are based on variation between varieties after removal of replicate effects. The environmental correlations between yield and tissue B concentrations have consistently been close to zero whilst genetic correlations between yield and tissue B concentrations have been negative at sites with high subsoil B and positive at sites with low subsoil B (Table 1).
- In a further study the correlation between rooting depth yield and uptake of B was measured at a B toxic site for three varieties differing in their level of B tolerance. Rooting depth was measured to a depth of 1m using soil cores taken immediately after harvest with soil cores segmented at 20cm intervals. Rooting depth varied considerably across the trial site. Environmental correlations between (plot) yields and tissue B concentrations were positive (re = 0.45) and tissue B concentrations were positively associated with rooting depth (re = 0.53). Plots with deeper rooting systems were higher yielding but also had higher concentrations of B in the tissue. Tolerant varieties were significantly higher yielding than the intolerant variety but no difference was found in rooting depth.
- Measuring the relative performance of near isogenic (very closely related) lines differing only in their level of B tolerance.
- The impact of a single gene for B tolerance (Bo1) was assessed at 41 trial sites in SA WA and Victoria over a 5-year period using a series of isogenic lines (Table 2). Yield benefits achieved by the BT lines ranged from 20% at Kimba SA to a yield penalty of 13% at Newdegate on the WA acid sand plains.
-
It should be emphasised that these yield effects calculated using this set of isogenic lines are attributable to a single gene for B tolerance. The majority of varieties grown in southeastern Australia differ by only one occasionally two genes for B tolerance and hence these estimates of the yield effects of B tolerance are relevant in the comparison of varieties from within this region. Varieties grown widely in Queensland and north NSW (Pavon derivatives) or grown on the acid sand plains of Western Australia (Gamenya Gutha Eradu derivatives) generally have a lower level of tolerance and probably differ from a variety such as Frame by three or more genes for tolerance.
Figure 1: Relationship between grain B concentration and relative yields
of B tolerant versus B intolerant isolines (r2 = 0.14)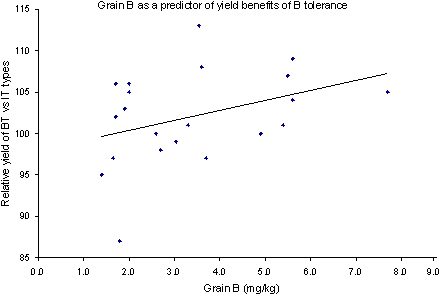
- Grain B concentrations were a relatively poor indicator of the relative yields of the isolines (Figure 1; r2 = 0.14). This creates difficulties for growers attempting to assess the impact of B tolerance on their properties. Yield benefits were always positive above a grain B concentration of 4 mg/kg averaging 4.3%.
Differences between the experimental approaches highlight the difficulty in defining the importance of B tolerance relative to other variety characteristics. B may not be the primary factor influencing rooting depth and the work of Nuttall et al. indicates that subsoil salinity and sodicity have a greater influence on water extraction from the subsoil than does B. This does not imply that B tolerance is irrelevant but indicates "transect" studies using a single variety need to be complemented by studies utilising isogenic lines to define the effect on yield of subsoil constraints.
| Site | Max soil B in 0-50 cm (mg/kg) |
Comparison | rg | re |
|---|---|---|---|---|
| Two Wells 1987 | 70.6 | Yield vs B | -0.47 | 0.08 |
| Two Wells 1988 | 88.0 | Yield vs B | -0.22 | 0.01 |
| Windsor 1987 | 13.1 | Yield vs B | -0.33 | 0.02 |
| Location | Year | Mean yield IT isogenic lines (kg/ha) | Yield BT isolines as a % of IT isolines |
|---|---|---|---|
| Bordertown SA | 1990 | 2879 | 99 |
| Bordertown SA | 1990 | 1702 | 109 |
| Carrabin WA | 1990 | 1756 | 97 |
| Kimba SA | 1992 | 761 | 120 |
| Laura SA | 1990 | 2728 | 103 |
| Merredin WA | 1990 | 1770 | 99 |
| Minnipa SA | 1990 | 1340 | 100 |
| Minnipa SA | 1991 | 1983 | 106 |
| Minnipa SA | 1992 | 2538 | 101 |
| Minnipa SA | 1988 | 361 | 101 |
| Minnipa SA | 1989 | 1648 | 101 |
| Newdegate WA | 1990 | 1137 | 87 |
| Palmer SA | 1990 | 1285 | 108 |
| Palmer SA | 1992 | 1152 | 98 |
| Roseworthy SA | 1989 | 1631 | 106 |
| Roseworthy SA | 1990 | 1650 | 100 |
| Roseworthy SA | 1990 | 1464 | 112 |
| Roseworthy SA | 1991 | 2011 | 95 |
| Roseworthy SA | 1992 | 1777 | 99 |
| Rudall SA | 1989 | 2614 | 107 |
| Rudall SA | 1990 | 855 | 108 |
| Rudall SA | 1991 | 1516 | 102 |
| Rudall SA | 1992 | 2570 | 105 |
| Salmon Gums WA | 1990 | 790 | 113 |
| Snowtown SA | 1990 | 2263 | 99 |
| Snowtown SA | 1989 | 3015 | 103 |
| Two Wells SA | 1988 | 1432 | 109 |
| Two Wells SA | 1989 | 3123 | 104 |
| Two Wells SA | 1990 | 946 | 105 |
| Two Wells SA | 1991 | 1928 | 104 |
| Two Wells SA | 1992 | 3343 | 101 |
| Waite SA | 1989 | 2698 | 95 |
| Waite SA | 1990 | 2121 | 101 |
| Walpeup Vic | 1989 | 1210 | 98 |
| Walpeup Vic | 1990 | 1345 | 105 |
| Walpeup Vic | 1991 | 1171 | 102 |
| Walpeup Vic | 1992 | 2196 | 110 |
| Windsor SA | 1989 | 1303 | 106 |
| Windsor SA | 1990 | 1035 | 97 |
| Windsor SA | 1992 | 1224 | 97 |
| Yeelanna SA | 1988 | 1593 | 102 |
| Average | 103 |
Authors
David Moody, DPI VIDA-Horsham
Ph 03 53622156
david.moody@nre.vic.gov.au
Tony Rathjen, University of Adelaide
Waite Campus Glen Osmond
Presented at:
Bendigo, VIC
February 2003
Was this page helpful?
YOUR FEEDBACK