Canola agronomy research in central NSW
Author: Canola agronomy research in central NSW | Date: 27 Feb 2014
![]() Varieties displaying this symbol beside them are protected under the Plant Breeders Rights Act 1994.
Varieties displaying this symbol beside them are protected under the Plant Breeders Rights Act 1994.
Authors
Leigh Jenkins (NSW DPI Trangie) and Rohan Brill (NSW DPI Wagga Wagga).
Take home messages
- Hybrid canola has significant grain yield and farming system benefits for the central region of NSW.
- Aim to establish 20-25 plants/m² in central west NSW.
- Choose canola varieties with large seed size to improve crop establishment (> 5 g/1000 seeds).
- Phosphorus application improves grain yield regardless of variety choice, but limit the amount of P applied in direct contact with seed.
- The response to nitrogen application is generally positive, even at relatively high soil N levels.
Introduction
Hybrid canola
Hybrid canola production has increased markedly in recent seasons, due largely to improved early vigour and higher grain yield relative to open-pollinated (OP) varieties. Hybrid seed generally retails for approximately double the cost of commercial OP seed. This increased cost to the grower is mainly due to the higher cost of seed production, as producing hybrid seed involves production of seeds of the parent lines in the first step and then the F1 hybrid in the second step. The yield and vigour advantage of hybrids is known as heterosis. Hybrids can be either GM or non-GM, and are now available in each of the four commercially available canola herbicide tolerance groups.
VSAP trials background
Canola agronomy trials have been conducted by NSW DPI in the central region of NSW in 2012 and 2013 (locations listed in Table 1). These trials add value to NVT by testing popular commercial varieties across a range of agronomic treatments. The aim of the trials has been to test specific groups of canola plant types, such as comparing hybrid varieties with OP varieties as well as comparing triazine tolerant (TT) varieties with non-TT varieties.
| Season |
Site | Trial | Soil type | Colwell P 0-10 cm (mg/kg) |
Nitrogen 0-90 cm (kg/ha) |
Sowing date |
|---|---|---|---|---|---|---|
| 2012 |
Coonamble |
Variety x Phosphorus |
Brown chromosol | 76 | 56 | 21 April |
| 2012 | Coonamble | Variety x Sowing depth | Brown chromosol | 76 | 56 | 21 April |
| 2012 | Nyngan | Variety x Nitrogen x Phosphorus | Red chromosol | 22 | N/A | 17 April |
| 2012 | Nyngan | Variety x Plant population | Red chromosol | 22 | N/A | 17 April |
| 2012 | Nyngan | Variety x Sowing depth | Red chromosol | 22 | N/A | 17 April |
| 2012 | Trangie |
Variety x Sowing depth |
Grey vertosol | 36 | 112 | 20 April |
| 2012 | Trangie | Variety x Phosphorus | Grey vertosol | 36 | 112 | 7 May |
| 2012 | Trangie | Variety x Nitrogen | Grey vertosol | 36 | 112 | 7 May |
| 2012 | Gilgandra | Variety x Nitrogen | Brown chromosol | 9 | 62 (0-60 cm) |
26 April |
| 2012 | Wellington | Variety x Nitrogen | Red chromosol | 29 | 54 (0-60 cm) |
27 April |
| 2013 | Nyngan | Variety x Phosphorus | Red chromosol | 24 | 180 | 19 April |
| 2013 | Nyngan | Variety x Nitrogen | Red chromosol | 24 | 180 | 19 April |
| 2013 | Nyngan | Variety x Plant population | Red chromosol | 24 | 180 | 19 April |
| 2013 | Nyngan |
Variety x Sowing depth |
Red chromosol | 24 | 180 | 19 April |
| 2013 | Trangie | Variety x Phosphorus | Red chromosol | 28 | 86 | 28 May |
| 2013 | Trangie | Variety x Nitrogen | Red chromosol | 28 | 86 | 28 May |
| 2013 | Trangie | Variety x Plant population | Red chromosol | 28 | 86 | 28 May |
| 2013 | Trangie |
Variety x Sowing depth |
Red chromosol | 28 | 86 | 28 May |
Trial results
Plant population
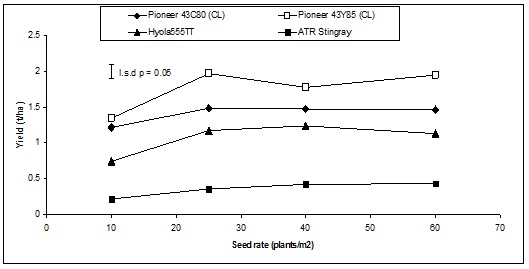
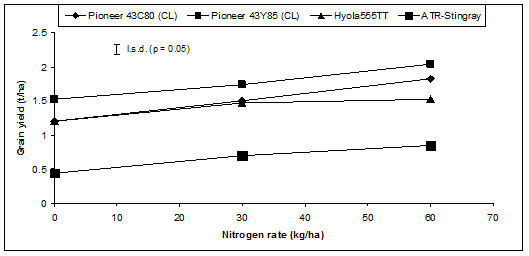
A plant population trial was sown at Nyngan in 2012, with actual establishment being similar to the targeted rate. Grain yield was significantly higher for all varieties when plant population increased from 10 to 25 plants/m² (average 0.35 t/ha increase), but there was no further yield increase for 40 and 60 plants/m2 (Figure 1). The hybrid Clearfield variety 43Y85 (CL) was significantly higher yielding than the OP Clearfield variety Pioneer 43C80![]() (CL). Similarly, the hybrid TT variety Hyola 555TT was significantly higher yielding than the OP TT variety ATR-Stingray.
(CL). Similarly, the hybrid TT variety Hyola 555TT was significantly higher yielding than the OP TT variety ATR-Stingray.
Figure 1. Grain yield of four varieties sown at four plant populations at Nyngan in 2012.
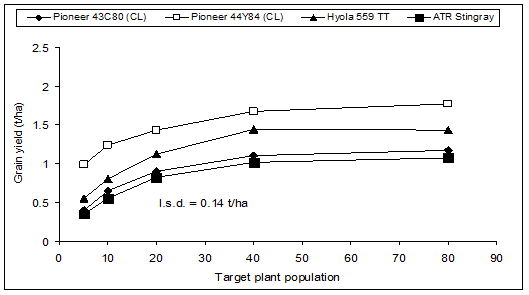
At Nyngan in 2013, the achieved establishment rates were similar to the targeted rates but at Trangie the achieved establishment was approximately 50 % of the targeted establishment. At Nyngan there was a significant yield increase (averaged across all varieties) of 0.42 t/ha where plant population increased from 5 to 10 plants/m², but there was no further grain yield response from increasing population further (Figure 2). At Trangie there was a significant grain yield increase (averaged across all varieties) where the targeted population increased to 40 plants/m². In effect this meant that maximum yield was achieved at 20 plants/m² since the actual establishment was 50 % of the targeted establishment at this site (Figure 3).
There was a similar varietal response pattern in 2013 at both sites as for the one site at Nyngan in 2012. The hybrid Clearfield variety Pioneer 44Y84 (CL) was significantly higher yielding than the OP Clearfield variety Pioneer 43C80![]() (CL); and the hybrid TT variety Hyola 559TT was significantly higher yielding than the OP TT variety ATR-Stingray
(CL); and the hybrid TT variety Hyola 559TT was significantly higher yielding than the OP TT variety ATR-Stingray![]() .
.
Figure 2. Grain yield of four canola varieties sown at five plant populations at Nyngan in 2013.
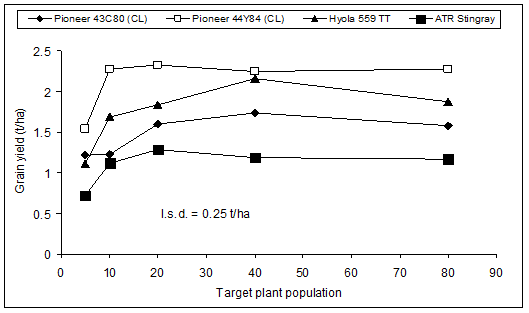
Figure 3. Grain yield of four canola varieties sown at five plant populations at Trangie in 2013.
Sowing depth
Sowing depth trials were conducted at Coonamble, Nyngan and Trangie in 2012; and at Nyngan and Trangie in 2013. Each trial had six common varieties with a range in seed size (Table 2). Target seeding depths were 2.5 cm, 5 cm and 7.5 cm.
|
Variety |
Seed weight 2012 (g/1000 seeds) |
Seed weight 2013 (g/1000 seeds) |
Seeds sown/m² |
|---|---|---|---|
|
AV-Garnet |
3.78 |
3.27 |
60 |
|
ATR-Stingray |
3.06 |
2.97 |
60 |
|
Pioneer 43C80 |
3.68 |
4.11 |
60 |
|
Pioneer 43Y85 (CL) |
5.03 |
4.77 |
60 |
|
Pioneer 44Y84 (CL) |
5.34 |
5.20 |
60 |
|
Hyola 555TT |
4.26 |
4.00 |
60 |
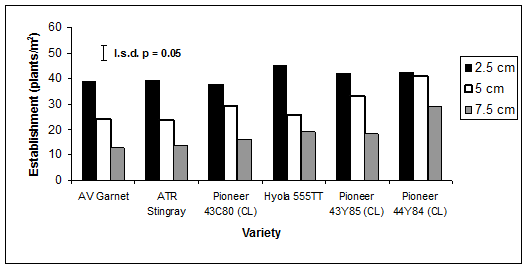
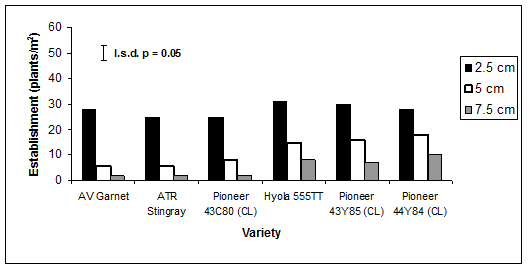
In 2012, averaged across all trials and varieties, establishment (as a percentage of seeds sown) at the 2.5 cm target depth was approximately 66%, with no difference between varieties. All varieties had reduced establishment at the 5 cm sowing depth compared to the 2.5 cm sowing depth, with the exception of Pioneer 44Y84 (CL) which had the largest seed size (Figure 4.). At the 7.5 cm sowing depth the difference between varieties and seed size became more marked as the largest seeded variety achieved 50% establishment compared to 20% establishment for the smallest seeded variety.
Figure 4. Establishment of six canola varieties at three sowing depths, averaged across three trials at Coonamble, Nyngan and Trangie in 2012 (text description follows).
| Canola variety | 2.5 cm sowing depth (plants/metre square) |
5 cm sowing depth (plants/metre square) |
7.5 cm sowing depth (plants/metre square) |
|---|---|---|---|
| AV Garnet |
40 | 25 | 12 |
| ATR Stingray |
40 | 25 | 12 |
| Pioneer 43C80 (CL) |
39 | 30 | 15 |
| Hyola 555TT |
45 | 27 | 20 |
| Pioneer 43Y85 (CL) |
43 | 35 | 20 |
| Pioneer 44Y84 (CL) |
43 | 39 | 25 |
The effect of sowing depth on grain yield in 2012 was less marked than the effect on establishment. At Nyngan and Coonamble, the 7.5 cm target depth yielded approximately 250 kg/ha less grain than the 2.5 cm and 5 cm target depth. At Nyngan, Pioneer 44Y84 (CL) had no grain yield reduction at the 7.5 cm target sowing depth compared with the shallower sowing depths, however there was a significant grain yield reduction for all other varieties as a result of deep sowing. There was no effect of sowing depth on grain yield at Trangie.
In 2013 the overall establishment achieved was less than in 2012. At the 2.5 cm sowing depth establishment (as a percentage of seeds sown) was approximately 50% with no significant difference between varieties (Figure 5). All varieties had reduced establishment at the 5 cm sowing depth compared with the 2.5 cm sowing depth; however the reduction was less severe for the hybrids than for the open-pollinated (OP) varieties. Establishment was further reduced at the 7.5 cm sowing depth, with a similar hybrid advantage as occurred at the 5 cm sowing depth.
Figure 5. Establishment of six canola varieties at three sowing depths, averaged across two trials at Nyngan and Trangie in 2013 (text description follows).
| Canola variety | 2.5 cm sowing depth (plants/metre square) |
5 cm sowing depth (plants/metre square) |
7.5 cm sowing depth (plants/metre square) |
|---|---|---|---|
| AV Garnet |
29 |
5 |
3 |
| ATR Stingray |
25 |
5 |
3 |
| Pioneer 43C80 (CL) |
25 |
10 |
3 |
| Hyola 555TT |
32 |
15 |
10 |
| Pioneer 43Y85 (CL) |
29 |
15 |
10 |
| Pioneer 44Y84 (CL) |
28 |
17 |
12 |
The effect of sowing depth on grain yield was greater in 2013 than 2012 but was still of a lesser magnitude than the effect of sowing depth on establishment. At Nyngan, the grain yield of Pioneer 44Y84 (CL), AV-Garnet![]() and Hyola 555TT were all similar for the 2.5 cm sowing depth; however AV-Garnet
and Hyola 555TT were all similar for the 2.5 cm sowing depth; however AV-Garnet![]() and Hyola 555TT both had a significant grain yield reduction at the 5 cm and 7.5 cm sowing depths, while Pioneer 44Y84 (CL) did not suffer a yield penalty from deeper sowing. At Trangie, all varieties suffered a grain yield penalty as sowing depth was increased but this reduction in grain yield was less severe for the larger seeded varieties
and Hyola 555TT both had a significant grain yield reduction at the 5 cm and 7.5 cm sowing depths, while Pioneer 44Y84 (CL) did not suffer a yield penalty from deeper sowing. At Trangie, all varieties suffered a grain yield penalty as sowing depth was increased but this reduction in grain yield was less severe for the larger seeded varieties
Phosphorus rate
A phosphorus (P) rate trial was sown at Coonamble, Nyngan and Trangie in 2012. The phosphorus product used was triple super which does not supply any nitrogen. The phosphorus rates applied were 0, 5, 10 and 20 kg/ha, with the fertiliser being placed directly with the seed.
Figure 6. Average establishment of four canola varieties sown with four rates of phosphorus at Trangie, Nyngan and Coonamble in 2012.
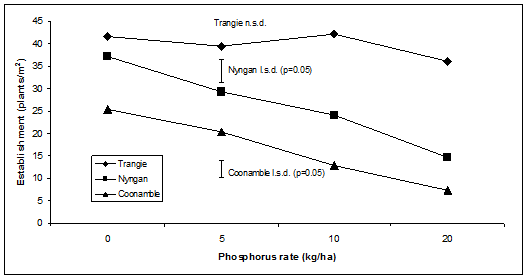
There was no effect of phosphorus rate on canola establishment on the cracking clay (grey vertosol) soil at Trangie. In contrast, increasing P rate significantly reduced the establishment of all varieties on the lighter textured soils at Nyngan (red chromosol) and Coonamble (brown chromosol) (Figure 6). All varieties experienced a similar reduction in establishment, regardless of seed size or plant type.
At Nyngan, there was a grain yield increase of 0.16 t/ha for the 5 kg/ha P rate compared with the nil P rate but with no further grain yield increase where P rate was increased. At Trangie (19 mg/kg Colwell P) the application of 10 kg/ha P significantly increased grain yield by 0.14 t/ha compared to where no P was applied, with no further yield increase at the 20 kg/ha P rate There was a similar varietal response pattern for the phosphorus rate trials at all sites as for the plant population trials. The hybrid Clearfield variety Pioneer 44Y84 (CL) was significantly higher yielding than the OP Clearfield variety Pioneer 43C80![]() (CL); and the hybrid TT variety Hyola 555TT was significantly higher yielding than the OP TT variety ATR-Stingray
(CL); and the hybrid TT variety Hyola 555TT was significantly higher yielding than the OP TT variety ATR-Stingray![]() .
.
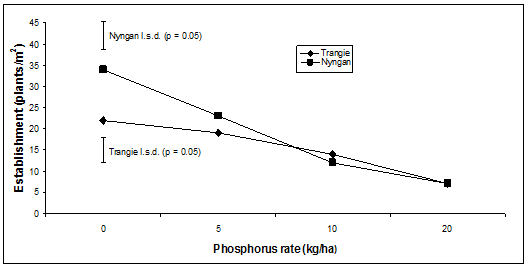
Two further phosphorus rate trials were conducted in 2013, with the Trangie trial planted on a lighter textured soil (red chromosol) compared with a heavy (grey vertosol) soil in 2012. There was a significant reduction in canola establishment at both sites as phosphorus rate (applied as triple super) was increased (Figure 7). Further product comparisons at a common P rate (20 kg/ha) showed that all major phosphate fertilisers (MAP, DAP, Single Super, Triple Super, Supreme Z) affected establishment to a similar degree.
Figure 7. Average establishment of two canola varieties sown with four rates of phosphorus at Trangie and Nyngan in 2013.
Despite the effect on establishment, grain yield still responded positively to phosphorus application at Nyngan in 2013 (24 mg/kg Colwell P), with the 5 kg/ha P rate yielding 0.25 t/ha more than the nil P treatment, but there was no further yield increase beyond this rate. There was no grain yield response from the application of phosphorus at Trangie (28 mg/kg Colwell P), which could have been partly due to the reduction in plant numbers caused by the fertiliser application.
Although hybrid varieties had higher yield than OP varieties in these phosphorus trials, there was no evidence to suggest that they should be managed differently in terms of P nutrition.
For growers using a tine seeder it is generally possible (and recommended) to separate seed from fertiliser to avoid the negative effects of starter fertiliser. For growers with a disc seeder (or considering a disc seeder), there are several management options available such as:
- Planting on relatively narrow crop rows to reduce fertiliser concentration in the furrow,
- Planting canola early to allow greater root exploration, with potentially less phosphorus application required,
- Pay strict attention to closing devices. The firmer/heavier the closing device, the greater the negative impacts of phosphorus fertiliser.
Nitrogen rate and timing
Nitrogen (N) rate trials were sown in 2012 at Nyngan and Trangie, with split timing of application component included at Gilgandra and Wellington. In 2013 nitrogen rate and timing trials were sown at Nyngan and Trangie only, with applications split between sowing and the early stem elongation stage. Due to lack of adequate follow-up rain at both Nyngan and Trangie sites after the in-crop application, only the rate component of 2013 trials is reported here.
At Nyngan in 2012, the application of 30 kg/ha N increased grain yield by 0.26 t/ha averaged across all varieties. Increasing the N application rate from 30 to 60 kg/ha resulted in a further yield increase of 0.21 t/ha (Figure 8).
Figure 8. Grain yield of four canola varieties with three nitrogen rates at Nyngan in 2012.
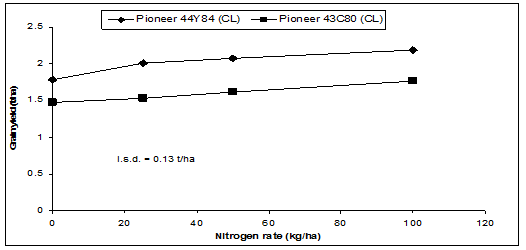
Only two varieties were sown at Trangie in 2012; however both varieties responded positively to nitrogen application at sowing despite a moderately high soil nitrogen content (112 kg/ha N at sowing, 0-90 cm) (Figure 9).
Figure 9. Grain yield of two canola varieties with four nitrogen rates at Trangie in 2012.
For the 2012 Gilgandra and Wellington sites, longer maturity canola varieties were sown to reflect yield potential in a longer season, higher rainfall environment.
At Gilgandra, the application of 40 kg/ha of N at sowing significantly increased the yield of only one of the four varieties (45Y82 CL, by 0.55 t/ha). There was no yield affect beyond the 40 kg/ha rate, possibly reflecting a moderate level of soil N at sowing (62 kg/ha) due to previous paddock history of lucerne pasture in 2010 (Figure 10). However the Gilgandra site did show a 2.1% reduction in oil concentration as nitrogen rate was increased from nil to 80 kg/ha.
Figure 10. Grain yield of four canola varieties with three nitrogen rates at Gilgandra in 2012.
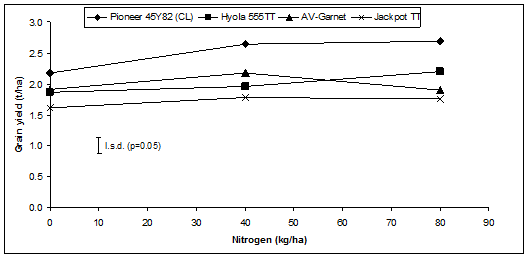
At Wellington there was a significant yield response as nitrogen rate applied at sowing was increased from 0 to 40 kg/ha (0.33 t/ha) and also from 40 to 80 kg/ha (0.19 t/ha) (Figure 11). The difference in response between this and Gilgandra site may be due to paddock history, with Wellington site having slightly lower soil N at sowing (54 kg/ha) after a history of wheat in 2011 and canola in 2010. However there was no effect of increasing N rate on oil concentration at the Wellington site. Non-TT varieties
(AV-Garnet![]() and 45Y82 CL) were significantly higher yielding than TT varieties in this trial.
and 45Y82 CL) were significantly higher yielding than TT varieties in this trial.
The Wellington site was the only site in 2012 where the yield of an OP variety, AV-Garnet![]() , had similar yield to the highest yielding hybrid variety, Pioneer 45Y82 (CL).
, had similar yield to the highest yielding hybrid variety, Pioneer 45Y82 (CL).
Figure 11. Grain yield of four canola varieties with three nitrogen rates at Wellington in 2012.
Both Gilgandra and Wellington 2012 trials included a timing component, where N was applied just prior to stem elongation (40 kg/ha rate only). Both trials had significantly less (0.15 t/ha) grain yield where N was delayed compared to applied at sowing, most likely due to lack of follow-up in-crop rain post application.
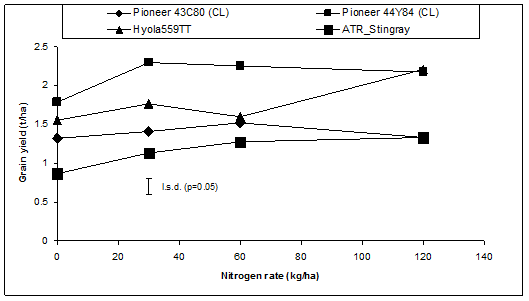
At Nyngan in 2013, there was a significant effect of nitrogen application on grain yield, with the application of 30 kg/ha N increasing grain yield by 0.27 t/ha, compared to nil N applied (Figure 12). This site was high in soil N at sowing (180 kg/ha N) but still showed a favourable response to a moderate amount of N application. There were similar varietal trends as observed in previous trials.
Figure 12. Grain yield of four canola varieties with four nitrogen rates at Nyngan in 2013.
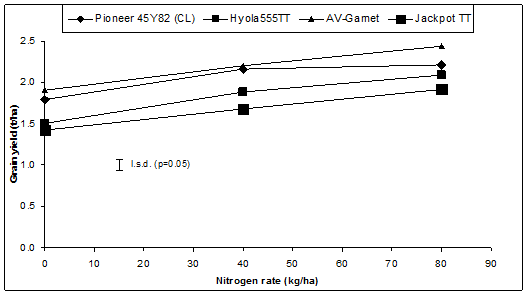
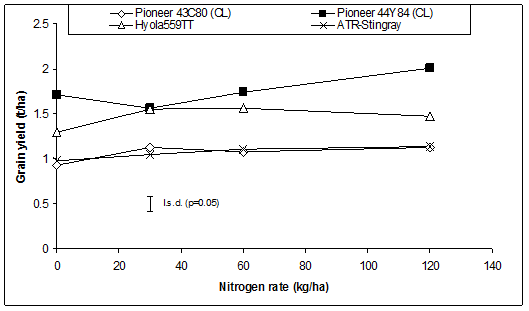
At Trangie in 2013 there was only a small response to nitrogen application but there were large varietal differences, with this trial following a similar trend to other trials that showed an advantage of hybrid varieties over OP varieties (Figure 13).
Figure 13. Grain yield of four canola varieties with four nitrogen rates at Trangie in 2013.
Although N application can increase grain yield, it may reduce oil concentration in the grain, as shown at Gilgandra in 2012. Overall oil removed (by weight as kg/ha) is still generally higher where N is applied. It is also worth noting that at a grain yield of 1.5 t/ha and a canola price of $450/tonne, the economic value of 1 % oil concentration is equivalent to only 22.5 kg/ha grain.
Discussion
Hybrid vs. OP varieties
These 2012 and 2013 canola trials have shown that the extra cost of hybrid seed can be justified. Averaged across all VSAP trials in the central-west region in the past two seasons, the average grain yield benefit of hybrid canola over OP canola was 0.4 t/ha (Table 3).
| Season |
Site |
Hybrid |
OP |
|---|---|---|---|
|
2012 |
Coonamble |
1.8 |
1.4 |
| 2012 |
Gilgandra |
2.3 |
1.9 |
| 2012 |
Nyngan |
1.5 |
0.9 |
| 2012 |
Trangie |
1.5 |
1.2 |
| 2012 |
Wellington |
2 |
1.9 |
|
2013 |
Nyngan |
1.8 |
1.3 |
| 2013 |
Trangie |
1.3 |
0.8 |
|
Average |
|
1.7 |
1.3 |
At a canola price of $450/tonne, this equates to a gross income benefit from hybrid varieties of $180/tonne. For growers purchasing commercial seed (assuming $50/ha for hybrid seed and $25/ha for OP seed) the return on investment of the extra money spent on hybrid seed ($25/ha) was on average 620 %. Growers who retain their own seed for subsequent planting will reduce seed cost, but there are then the additional costs of labour, grading and seed treatment with fungicide and insecticide. There may also be intangible costs due to the increased risks of poor vigour seed and/or disease carryover in retained seed.
TT or not TT?
The use of TT canola adds an extra dimension to weed control options; however this system does come with an inherent penalty as TT varieties are known to have reduced photosynthetic efficiency. The average yield penalty in these trials for TT compared with non-TT varieties was 0.4 t/ha (Table 4). At a canola price of $450/tonne, this equates to a penalty of $180/ha. This needs to be weighed up against the cost of using either cheaper or more targeted herbicides to control specific weed issues, as well as the ability to allow viable crop rotations in paddocks previously considered unsuited to canola production.
| Season | Site |
TT |
non-TT |
|---|---|---|---|
|
2012 |
Coonamble |
1.3 |
1.8 |
| 2012 |
Gilgandra |
1.9 |
2.3 |
| 2012 |
Nyngan |
0.8 |
1.6 |
| 2012 |
Trangie |
1.1 |
1.4 |
| 2012 |
Wellington |
1.9 |
2 |
|
2013 |
Nyngan |
1.4 |
1.7 |
| 2013 |
Trangie |
1 |
1.1 |
| Average |
|
1.3 |
1.7 |
Conclusion
Canola agronomy trials focussing on establishment and nutrition issues have been conducted by NSW DPI across a range of soil types (chromosols and vertosols) in the central region of NSW in 2012 and 2013. Despite differing soil types and seasons at each site, trial results have consistently shown the value of large seeded hybrid varieties vs. small seeded OP varieties in particular. From these trials several agronomic practices can be highlighted to increase the reliability of canola production in the central zone of NSW:- Where seed needs to be placed deeper than optimum seeding depths (e.g. when sowing early by moisture seeking), ensure that canola varieties with larger seed size are used (minimum 5 g per 1000 seeds) and that a high rate of fertiliser in contact with the seed is avoided.
- Positive grain yield response to low-moderate (5-10 kg/ha) phosphorus rates are common and have been recorded on both red and grey soils.
- Aim to establish a target density of 20-25 plants/m² in central-west NSW.
- The application of nitrogen fertiliser has led to increased grain yield of canola, even at moderate to high soil N levels.
- TT varieties have generally been lower yielding than non-TT varieties; however this needs to be weighed up against the options provided by residual herbicides in the TT system.
- Hybrid varieties have generally been higher yielding than open pollinated varieties; however the cost of hybrid seed needs to be weighed up against the reduced cost and ability to retain seed of OP varieties.
Acknowledgements
The assistance of Jayne Jenkins, Scott Richards, Kelvin Appleyard and formerly Robert Pither (NSW DPI, Trangie) in the conduct of these trials is gratefully appreciated.
These trials were funded by NSW DPI and GRDC through the Variety Specific Agronomy Packages for Northern NSW Project (DAN00129) in 2012 and 2013.
Contact details
Leigh Jenkins NSW Department of Primary Industries
Ph: 0419 277 480
Email: leigh.jenkins@dpi.nsw.gov.au
![]() Varieties displaying this symbol beside them are protected under the Plant Breeders Rights Act 1994.
Varieties displaying this symbol beside them are protected under the Plant Breeders Rights Act 1994.
GRDC Project Code: DAN00129,
Was this page helpful?
YOUR FEEDBACK