Seasonal climate outlook improvements changes from historical to real time data
Author: Presented by Dr Jeff Sabburg & Garry Allen, Bureau of Meteorology | Date: 18 Jul 2013
Presented by Dr Jeff Sabburg & Garry Allen, Bureau of Meteorology
Development Team: Dr. Andrew Watkins, Catherine Ganter, Dr. William Wang, Luke Garde, Andrew Charles, Milton Woods, Griff Young, Caroline Andrzejewski, Helen Bloustein, Dr. Luke Shelley, Dr. David Jones, Bureau of Meteorology
Take home message
The Bureau of Meteorology has recently moved from a statistics-based to a physics –based (dynamical) model for its seasonal climate outlooks. The new system has better overall skill, is reliable, allows for incremental improvements in skill over time and provides a framework for new outlook services including multi-week/monthly outlooks and the forecasting of additional climate variables.
The Bureau of Meteorology first issued seasonal climate outlooks in 1989. Since 1998, these outlooks compared past rainfall patterns across Australia with the pattern of sea surface temperatures across the Indian and Pacific Oceans. This approach establishes a statistical relationship between current sea surface temperatures and the season ahead (e.g. statistics based seasonal climate outlook). With Australia strongly influenced by the El Nino – Southern Oscillation (ie., El Niño and La Niña events) and Indian Ocean impacts such as the Indian Ocean Dipole, these forecasts had reasonable levels of skill and reliability, and provided outlooks which were demonstrably better than chance.
Over the past decades physics-based models of the climate system have emerged. These models use mathematical equations based on the fundamental laws of physics, fluid motion and chemistry on a rotating sphere to simulate the climate system. They take account of the dynamic interactions of the atmosphere, oceans, land surface and ice to forecast the average conditions over the season ahead. The Bureau of Meteorology in partnership with CSIRO has been developing a dynamical model called the Predictive Ocean Atmosphere Model for Australia (POAMA), for a little over 10 years. It is important to acknowledge the Managing Climate Variability Research and Development Program for its funding support.
Before the Bureau of Meteorology would switch to the new dynamical seasonal outlook the new system had to demonstrate not just skill and reliability, but also a clear improvement over the old service (see Figure 1). In 2012 this was achieved with the development of version 2.4 of the model, run with 99 ensemble members (i.e., using a combination of 99 nine-month outlooks). As a result, the Bureau of Meteorology moved it into operational service in May 2013.
Reliability is an interesting and important part of the seasonal climate outlook performance. It is a means of measuring how well the probability of the forecast matches the observed outcome. For example, when the outlook forecasts an 80% chance of above average temperature do we observe above average temperatures 80% of the time (see Figure 2), and hence is 80% really a fair representation of the odds?
|
a) |
b) |
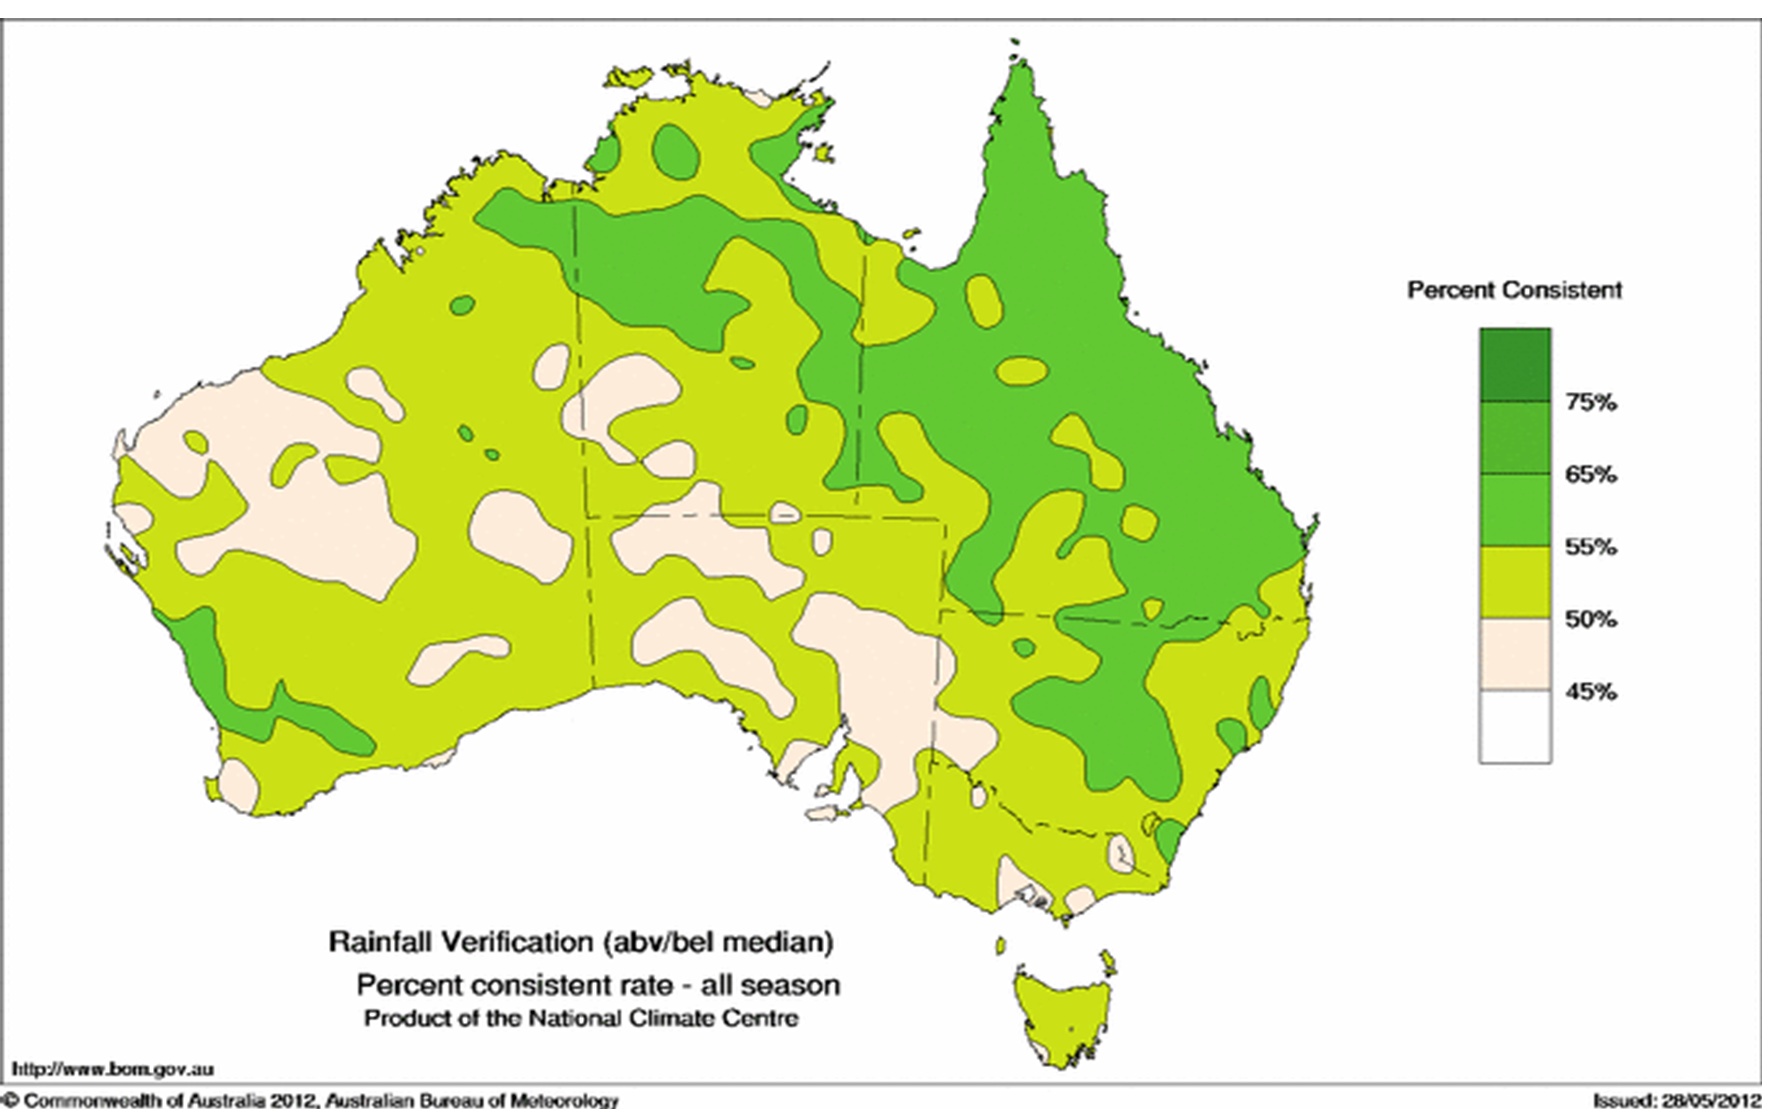
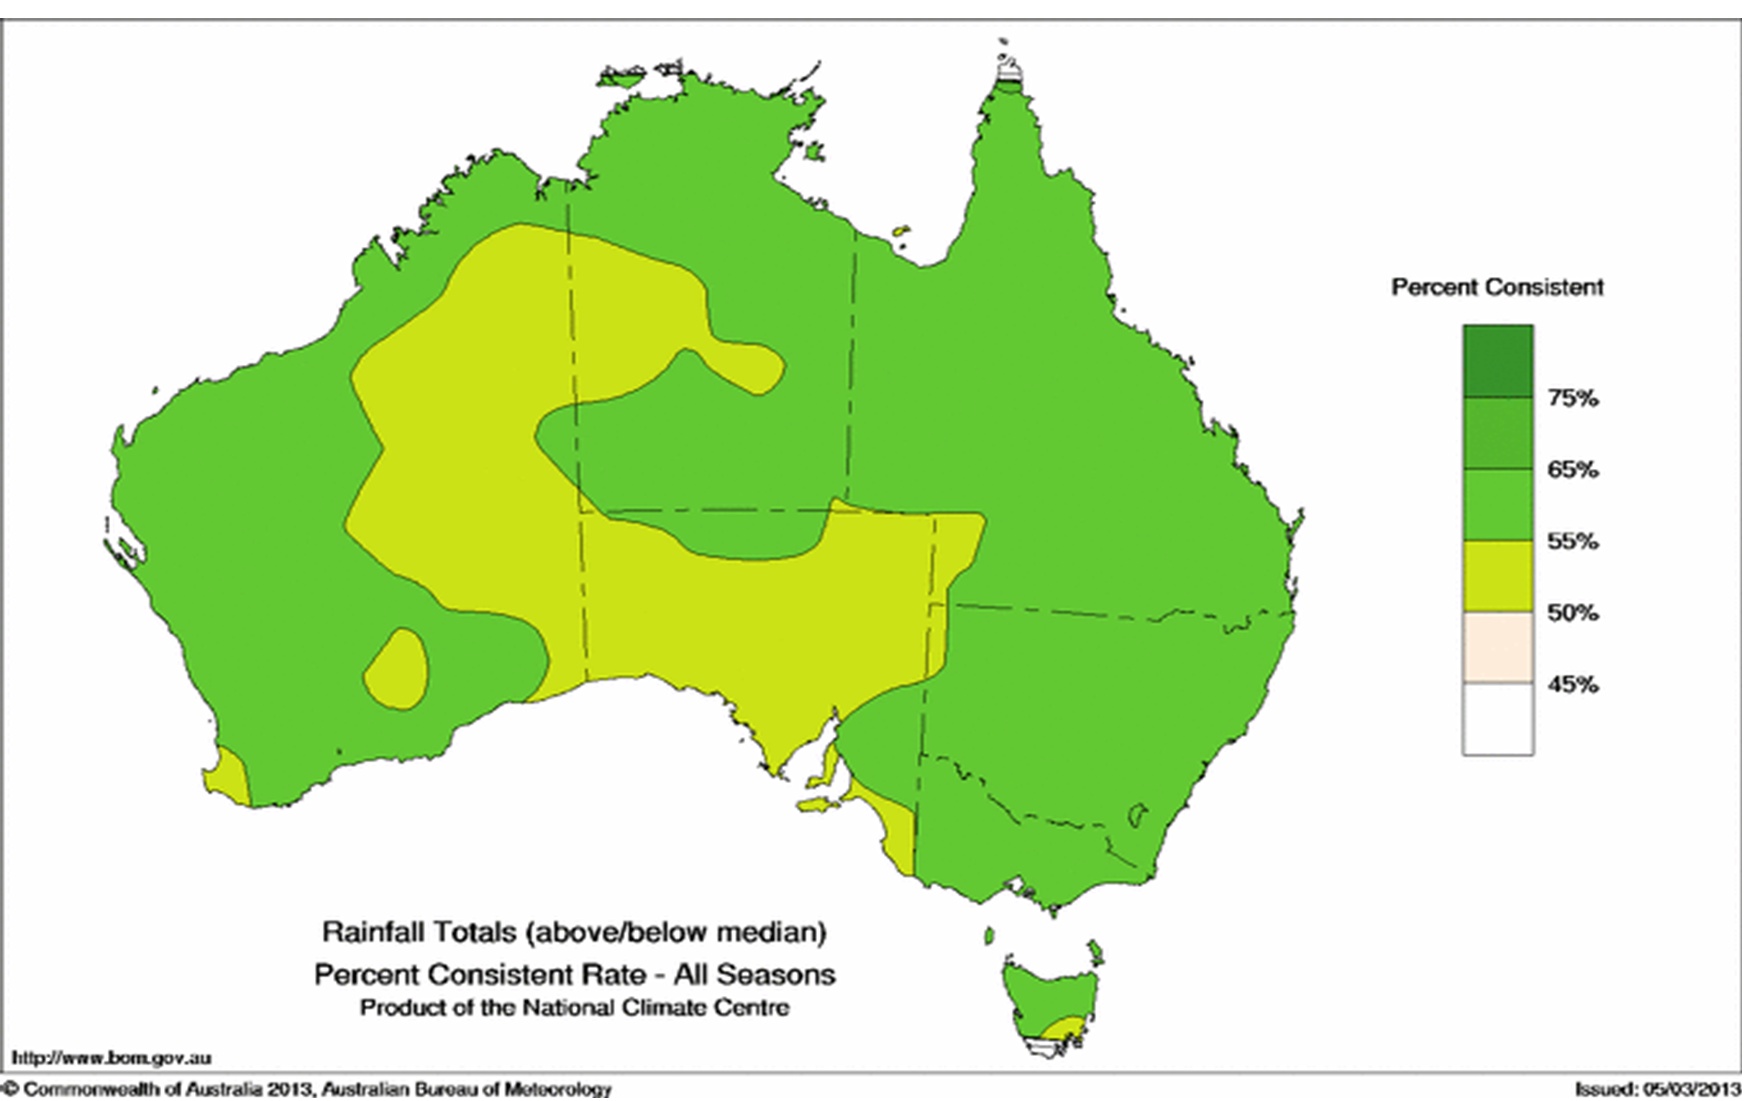
Figure 1. Skill based on hindcasts for all seasons, a) Statistical (1950 to 1999) and b) Dynamical (1981 to 2010).
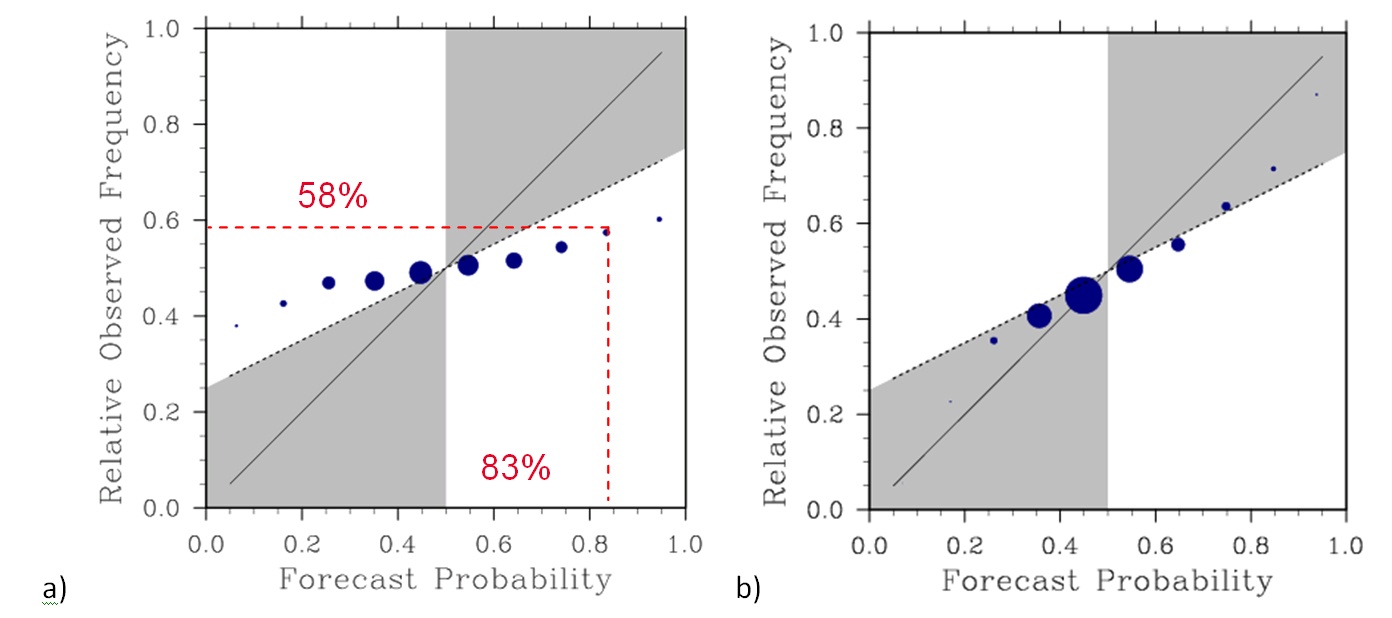
Figure 2. Reliability graph a) demonstrating a forecast system with low reliability where a high probability forecast actually has only a moderate success rate and b) the reliability of the new POAMA system where forecast probability is close to its success rate. Grey shading indicates areas of good reliability.
Moving to a dynamical model has several other benefits. First, there will be incremental improvements in skill and reliability over time as computing power increases, observations over data sparse areas become more accurate due to satellites and understanding of the climate systems improves. Second, it opens the door to new forecast products such as wind, solar energy, humidity or potentially even derived products such as evapotranspiration. Finally, the dynamical system provides the opportunity to develop multi-week and monthly outlooks which would fill the gap between 7-day weather forecasts and 3-month or longer seasonal outlooks.
The 2013 Winter outlook
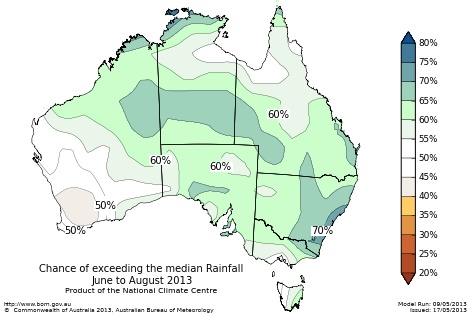
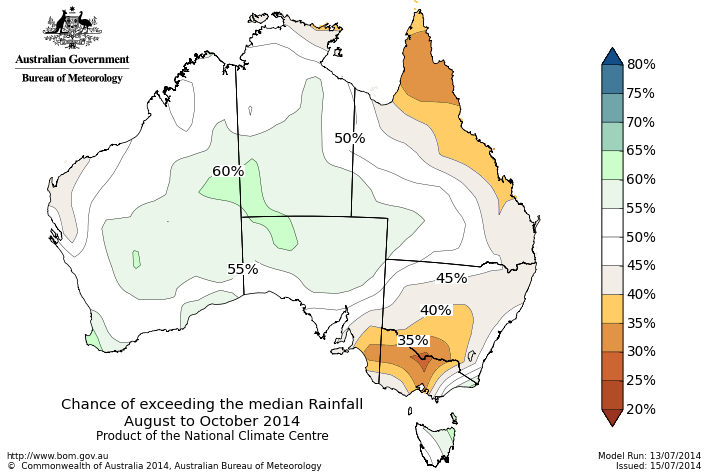
- A wetter than normal season is more likely for large parts of northern and eastern mainland Australia (see Figure 3)
- Warmer days are more likely over the north, south and west coasts of Australia, with cooler days more likely over large parts of the southeast mainland (see Figure 3)
- Warmer nights are more likely over the tropical north, western WA and southern Australia (see Figure 3)
 b)
b) 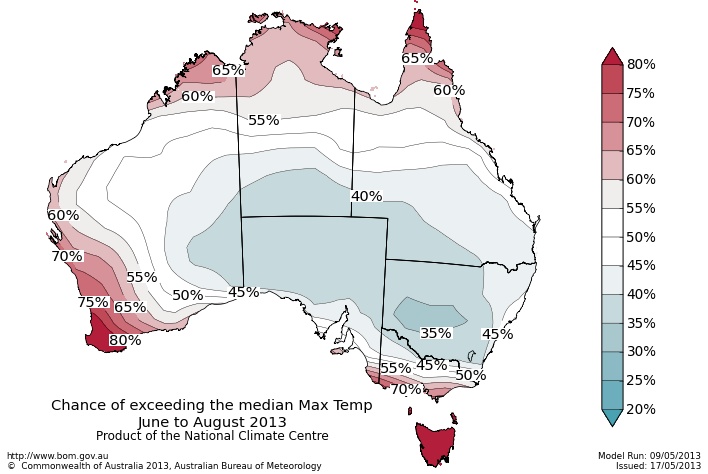
c) 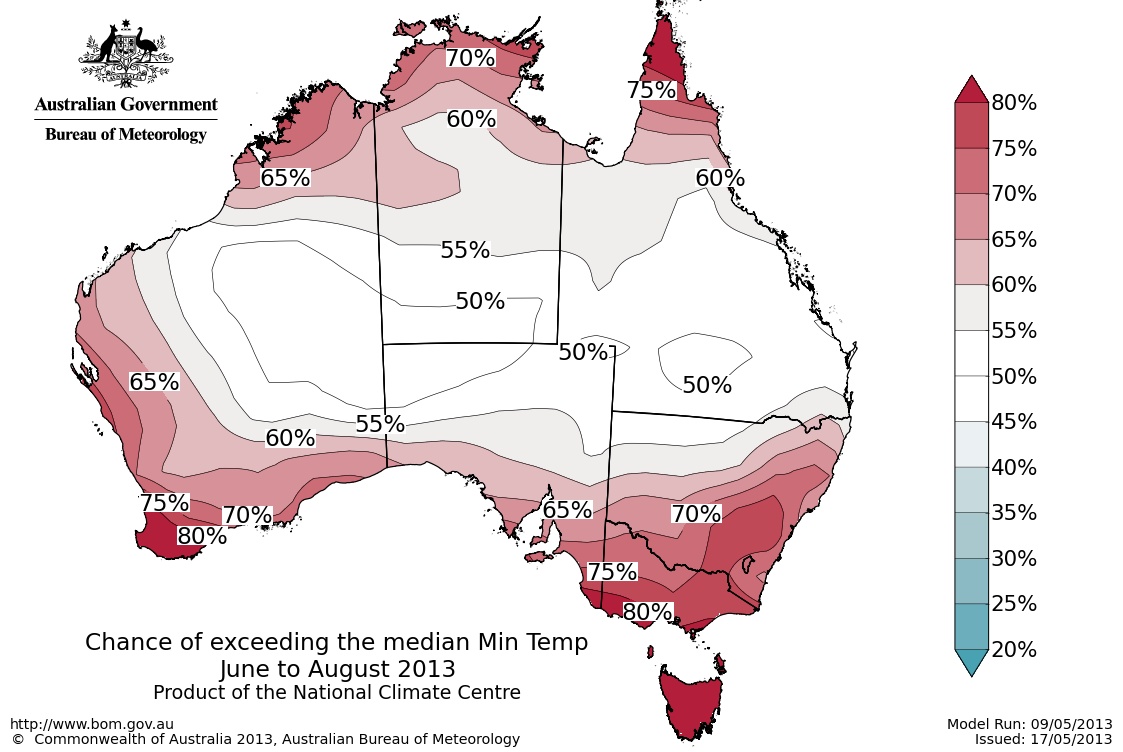
Figure 3. Probability of above median a) rainfall, b) maximum temperature and c) minimum temperature.
This first seasonal outlook from the new dynamical model highlights the value of such a system. Rather than being based upon the ocean conditions of the past few months, it forecasts the continuing development of a negative Indian Ocean Dipole pattern and hence is forecasting wetter than average conditions over central and southern Australia. While it is too early to determine if this outlook will be successful, rains in early June have already seen above average totals in some areas.
Warmer than normal ocean temperatures around the continent were also forecast by the model and so despite more forecast rainfall and associated cloud reducing the likely temperatures inland, areas closer to the coasts and the warmer local sea surface temperatures are forecast to keep the coastal fringes relatively warm. Such a pattern would not always be captured by a statistical model.
Readers are referred to the Bureau’s latest seasonal outlooks via the ‘agricultural’ or ‘climate and past weather’ service links or by visiting http://www.bom.gov.au/climate/ahead/
Contact details
|
Dr Jeff Sabburg |
Dr Aaron Coutts-Smith |
Reviewed by
Name Dr Andrew Watkins
Organisation Bureau of Meteorology
GRDC Project Code: MCV00015,
Was this page helpful?
YOUR FEEDBACK