Management effects on barley varieties - Nitrogen management and time of sowing
| Date: 09 Feb 2011
Varieties listed in this paper are covered by PBR
Background
This trial forms part of a continued GRDC funded tri-state project (DAV00138, previously DAV00104) involving NSW DPI and SARDI. Both projects have been designed to investigate the responses of new and current barley varieties to specific aspects of agronomy in a no-till farming system. These include responses to time of sowing, nitrogen and disease management (particularly Scald).
The previous project investigated the interaction between row spacing (15cm, 22.5cm and 30cm spacings) and weed competition (Brome and Rye grass), nitrogen management and tolerance to pre-emergent herbicides (Triflur X, Lexone and BoxerGold). The results can be found in previous BCG Season Research Results Booklets during 2007-2009.
This paper reports on the findings from three field trials managed by BCG in 2010.
Aim
To evaluate the response of barley varieties to:
• different sowing times.
• applied nitrogen (N) rates at sowing.
• delayed N application.
Method
Nitrogen trial
Two replicated field trials were established in cereal stubbles at Culgoa and Lubeck. In a randomised complete block design with 3 replicates, nitrogen (8) and variety treatments (4) were completely randomised within each replicate. Each replicate was laid out over 3 ranges, to try to get all treatments as close to one-another as possible which makes for good comparisons between response curves for each variety. The same design was used at each site.
Culgoa
The up-front nitrogen treatments were deep-banded at seeding. The in-crop applications were applied using a hand-held garden spreader on the 24 June. The site received 5mm of rainfall on the following day.
Lubeck
The seeder used to sow this trial was not equipped for deep banding subsequently, the up-front nitrogen treatments were pre-drilled prior to seeding. The in-crop applications were applied using a hand-held garden spreader on the 29 June. The site received 25mm of follow-up rainfall over the following four days.
Time of sowing
Seven varieties (Hindmarsh, Buloke, Commander, Fleet, Flagship, Maritime and Gairdner) were sown at three times (20 April, 19 May, 2 June) on a clay loam at Culgoa. Using a split-plot design, each time of sowing (3) was randomly allocated to main plots and varieties (7) were randomised within each main plot.
For all sowing times, seed bed moisture at planting was sufficient to ensure germination. The site was relatively clean: no other herbicides were required post emergence during the season.
Severe locust damage occurred between 29 April and 14 May. This significantly affected the establishment of the April sown plots. Recovery from locust grazing was poor, as a result, the emergence and biomass data collected from the affected plots was removed from the analysis. Grain yields from these plots were, however, included in the analysis.
Table 1: Paddock history and soil analysis at Culgoa and Lubeck.
|
Analysis
|
Culgoa
|
Lubeck
|
|
|
2009 crop
|
Chem Fallow
|
Barley
|
Oaten Hay
|
|
Sowing date
|
20 April, 19 May, 2 June
|
20 May
|
13 May
|
|
Trials
|
Time of sowing
|
Nitrogen response
|
Nitrogen response
|
|
Soil type
|
Clay Loam
|
Wimmera Clay
|
|
|
Growing Season Rainfall (GSR)
|
248 mm
|
311 mm
|
|
|
Annual Rainfall
|
511 mm
|
627 mm
|
|
|
Colwell P (mg/kg)
|
32
|
34
|
21
|
|
Organic Carbon
|
1.03%
|
0.98%
|
1.44%
|
|
PAW* at sowing (0-100cm)
|
49 mm
|
16 mm
|
62 mm
|
|
Total available N (0-100cm)
|
134 kg N/ha
|
68 kg N/ha
|
53 kg N/ha
|
|
pH (water) – topsoil (0-10cm)
|
8.7
|
8.3
|
7.2
|
*PAW = Plant available water
All trials were managed for broadleaves and diseases such as Scald. Granular Urea was the product used for all treatments.
An analysis of variance was used to test for significant effects of treatments and interaction between treatments. Least significant differences were calculated at the 95% confidence rate.
Weather conditions and rainfall at Culgoa were measured using a Campbell Scientific Aust. ET107 automatic weather station
Gross income (yield t/ha x grain price) was determined after classifying individual plots as Malt or Feed based on quality parameters. Grain prices used was the cash price from AWB Birchip on the 23 December, consistent with the rest of this publication.
Table 2. Matrix of the treatments for the three trials.
|
Trial Name
|
Varieties
|
Variables
|
Location
|
|
Time of sowing
|
Hindmarsh
Buloke
Commander
Flagship
Fleet
Maritime
Gairdner
|
20 April
19 May
2 June
|
Culgoa
|
|
Nitrogen responsiveness and timing
|
Hindmarsh
Buloke
Commander
Gairdner
|
Nil
Up-front
(20,40,60,100,150kg N/ha)
Mid-tillering
(100kg N/ha)
Split
(40kg N/ha at sowing + 60kg N/ha at mid-tillering)
|
Culgoa
Lubeck
|
Results
Did varieties differ in their response to N?
For a variety to be more or less “nitrogen efficient” than another, it simply means it achieves the same yield on less N (assuming everything else is equal). Despite there being a positive response to applied N at both sites in 2010, there was no variety that was statistically more N-efficient than the other. Comparing the biomass and grain yields between varieties there was no advantage in changing the N management to suit the different varieties.
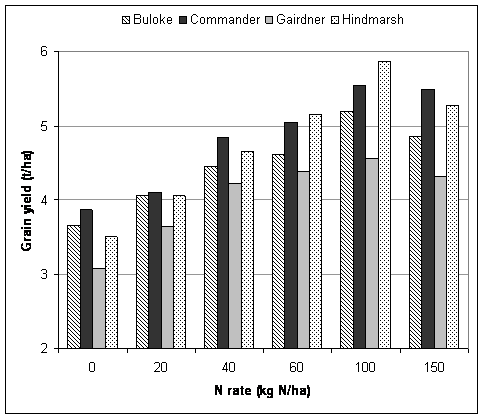
Culgoa
With a low to moderate starting soil N, applying N at sowing increased grain yields and protein incrementally with N rate (Figure 1). Yields were strongly influence by varieties (P<0.001, LSD 0.25, c.v 8.1%) and the rate of N (P<0.001, LSD 0.30, c.v. 8.1%). However, all varieties responded the same to increasing amounts of N (P=0.66). For example, applying 60kg N/ha produced the same yield increase for Hindmarsh as it did for Buloke.
Figure 1. Culgoa grain yields
Plant establishment of all varieties were reduced with increasing rates of N, especially at the 150kg N/ha rate. The reduction was not observed in the number of shoots, measured at GS30 (N-rate x Var: NS, P=0.30), and heads, at flowering (N-rate x Var: NS, P=0.25), which would indicate that the crop was able to compensate by producing more shoots at the higher N rates. The worst establishment occurred at the 150kg N/ha rate. This effect was shown in the slight reduction in yield at the higher rate compared to the 100kg N/ha.
The same trend as yield was observed in grain protein, with differences found between varieties (P=0.003, LSD 0.67, c.v. 10%) and N rate (P<0.001, LSD 0.82, c.v. 10%). Figure 2 shows Hindmarsh achieved protein levels for Malt (9-12% protein) at all rates except 20 and 150kg N/ha. Buloke met the Malt grade at all rates of N (except the nil). Commander’s proteins did not achieve greater than 9% at any rates below 100kg N/ha.

Figure 2. Grain protein levels of barley varieties with increase rates of N applied at sowing at Culgoa.
Lubeck
Responses of the varieties to various rates of N were similar at Lubeck as observed at Culgoa (Figure 3). Grain yields increase with more N however plateau at 4.5t/ha. Yields were strongly influenced by the rate of N (P<0.001, LSD 0.5, c.v 15.2%) and varietal choice (P=0.002, LSD 0.4, c.v. 15.2%). As was the case at Culgoa, no variety responded differently to the rate of N than another (Variety x N rate was not significant).

Figure 3. Change in grain yield with increasing rates of nitrogen applied at sowing at the Lubeck.
Plant establishment issues were more severe at Lubeck than Culgoa. The mean plant density was 75 plants per metre square much less than compared to Culgoa (101pl/m2). Higher rates of N had the greatest effect. It could be expected that such reductions would have reduced yields somewhat. Though there was certainly a level of compensation, grain yields were below expectation. This raises the question what other factors may have been affecting the yields.
A higher organic carbon (1.44%) at sowing could have contributed more mineralised N during the growing season, increasing the amount available N to the crop. This could have been the reason why yields did not continue to increase at higher rates (60 and 100kg N/ha rates). The site also experienced water-logging during August and September which could have meant some applied N was lost through denitrification and or leaching.
As was the case at Culgoa, grain protein also increased with N rate (Figure 4). Interestingly, protein levels did not increase dramatically despite no extra yield response occurring at the 60, 100 and 150kg N/ha rates. This would tend to favour a denitrication or leaching theory.

Figure 4. Change in grain protein between varieties with increasing rates of nitrogen applied at sowing at the Lubeck site (not significant, c.v. 4.6%).
Did the timing of Nitrogen affect growth yield or quality?
Grain yields and proteins of four varieties were compared when 100kg N/ha was applied at three different growth stages at both sites. The different timings were at sowing, mid-tillering and a spilt application (40N sowing, 60N mid-tillering).
At Culgoa, delaying N until mid-tillering increased grain yields of each variety compared with if it was applied at sowing (P=0.002, LSD 0.26t/ha, c.v. 5.7%) (Figure 5). Using a split approach, yields increased from the upfront treatment in all varieties but Hindmarsh.

Figure 5. The effect of different N timings on grain yields of different barley varieties (P = NS, LSD = 0.53).
In terms of grain protein, Buloke proteins were similar at each N timing, whereas, protein levels of Commander and Hindmarsh were reduced with the later applications (P=0.057, LSD 0.9%, c.v 4.7%) (Figure 6). Differences in Gairdner were not significant.

Figure 6. Effect of N timing on grain protein
At Lubeck, there was no significant differences found in grain yield or protein.
Did time of sowing affect varietal performance?
Varietal differences occurred in plant establishment, with Hindmarsh having the highest plant density and Gairdner the lowest. Most varieties were below the target plant density of 140 plants/m2, but establishment was considered adequate in all varieties except for Gairdner. The Gairdner seed was certified but considered to be less viable than expected when sowing rates were calculated. The mean plant density for the trial was 120 plants/m2. Given the varietal differences, the emergence data was tested as a co-variate in other analyses and was found to be not significant.
Fleet produced the most biomass at flowering, significantly more than all other varieties. This difference was not converted into higher grain yield, despite the wet spring. The higher biomass could have potentially used more moisture at a critical time such as just prior to flowering, potentially reducing yields, or just be a varietal characteristic. Notably, the highest yields seem to be achieved when flowering biomass was around 1200g/m2. No differences between varieties were observed in biomass at the end of tillering (GS30). There was no interaction between sowing time and variety in any of those measurements. Figure 7, shows the flowering biomass of all the varieties were similar despite different sowing times.

Figure 7: Biomass at flowering for the different varieties sown in May and June.
In terms of grain yield, Hindmarsh was the most successful, out-yielding all other varieties except Commander, which was similar. Maritime and Gairdner were the lowest yielding varieties. A strain of Net Form of Net Blotch (NFNB) specific to Maritime caused a complete loss of green leaf late in the season, despite fungicides being applied. No other variety was affect by the disease. This could explain why the yields of Maritime were less than the other varieties despite it being a wet year.
As expected, sowing time did influence the flowering (anthesis) date. However, grain yield was not related to flowering date in 2010 (Figure 8). The spread of flowering for each sowing date is due to varietal differences. Previous project findings have shown grain yields decrease with later flowering, especially in seasons that experience dry finishes. However, in average to wet years, early sown crops will typically yield less because they use too much water early, or do not grow for long enough to use all the water available in the season. Given water was not limiting yield throughout this season, the reduction in grain yield for the April sowing could have been caused by the locust damage.

Figure 8. The relationship between the flowering date on grain yield
Of the seven varieties, Hindmarsh was the earliest to flower within each sowing time, initiating anthesis on the 23 September for both April and May sowing times. An earlier flowering time may have occurred in the April sowing had locust infestation not occurred. Maritime, Fleet and Gairdner all flowered on similar days for each sowing time. Gairdner reached anthesis earlier than Fleet and Maritime in the April sowing. There was a greater spread of flowering dates between varieties in the May sowing compared with the April and June sowing.
A moderate frost (-10C) was recorded on 1 October at the Culgoa site. When this occurred, all April-sown varieties were in the mid-late flowering stage. The May sowing, except for Hindmarsh (late flowering) and Fleet (mid flowering), had just begun to flower. There was no notable frost damage in the trial, though some early-sown wheat trials on the same site were affected.
Hindmarsh and Commander performed well at all times of sowing. Both varieties were outstanding in the May and June sowings (Figure 9). Gairdner and Maritime were the worst performing varieties, even when sown early. Both Gairdner and Maritime yields fell away at the later time of sowing. Flagship and Fleet yielded similarly to Commander, especially at the later sowing times. The differences between varieties were less pronounced in the April sowing than they were in the May and June sowings.

Figure 9. The effect of sowing time on grain yield at Culgoa (P<0.001, LSD = 0.61, c.v. 7.8%).
How did the varieties perform?
Theoretical gross incomes were calculated for both sites using the yield and quality of each variety at the optimal N rate. For Culgoa, the highest yield and best quality for all varieties was achieved at the 100kg N/ha rate (Table 3). While at Lubeck, all varieties performed best at the 60kg N/ha rate.
Table 3. Theoretical gross incomes of the varieties achieved from applying the 100kg N/ha rate at Culgoa.
|
Variety
|
Grain Yield (t/ha)
|
Grain Protein (%)
|
Grade
|
Price
($/t)
|
Gross income ($/ha)
|
|
Buloke
|
5.2
|
10.7
|
Malt 1
|
253
|
1,316
|
|
Commander
|
5.5
|
9.9
|
Malt 1
|
253
|
1,393
|
|
Hindmarsh
|
5.9
|
10.3
|
Hind 1*
|
228
|
1,345
|
|
Gairdner
|
4.6
|
11.6
|
Malt 1
|
253
|
1,164
|
*Hind 1 = Segregated grade of Hindmarsh barley that achieved Malt 1
At Lubeck, a similar trend in crop production and quality was found, although the test weights in all varieties were less than 62.5 which is the minimum standard for Malt 2. This meant that no variety achieved Malt classification. So the highest yielding variety achieved the highest gross income as the price was the same for all. The price used in Table 4 uses the grain receival price at AWB Birchip on the 24 December. There was no nearby receival point taking Feed 2.
Table 4: Theoretical gross incomes of the varieties achieved from applying the 60kg N/ha rate at Lubeck.
|
Variety
|
Grain yield
(t/ha)
|
Protein (%)
|
Test weight (kg/hl)
|
Grade
|
Price
($/t)
|
Gross income ($/ha)
|
|
Buloke
|
4.2
|
11.1
|
60
|
Feed 2
|
131.00
|
550
|
|
Commander
|
5.0
|
10.4
|
62
|
Feed 2
|
131.00
|
655
|
|
Hindmarsh
|
4.6
|
11.2
|
63
|
Feed 2
|
131.00
|
603
|
|
Gairdner
|
3.9
|
11.2
|
61
|
Feed 2
|
131.00
|
510
|
Malt 1: Protein 9-12%, Retention > 70, Screenings <7%, Test Weight > 65kg/hl
Interpretation
N responsiveness
The data obtained in this study suggests there is no evidence that varieties, even with different characteristics, respond differently to N rates applied at sowing. Hindmarsh however, in the past two years of this study has been very responsive to N. At both sites, Hindmarsh had greatest change in yield from increasing rates of N at sowing, which is consistent with the Woomelang findings last year. If further investigations support these findings, there could be a greater yield potential for Hindmarsh than other varieties.
Nitrogen timing
In recent years there has been a compromise between early vigour and growth and spreading risk by delaying N. Early vigour and growth is great for reducing the impacts of diseases such as rhizoctonia, while delaying N will help reduce financial risks in drier seasons. In a wet year, it could be expected that there would be a yield penalty from delaying N however, findings in 2010, a wet year, has shown delayed N can increase yields. At both sites, topsoil N may have been sufficient to maintain growth until the mid-tillering. Delaying N until mid-tillering, converted more of the N into biomass later in the season (flowering) than early biomass (GS30). This extra biomass was converted into yield as reflected by the yield difference.
If other management issues such as weed or disease burdens exist, using a split N approach may improve establishment, providing good benefits both ways.
Time of sowing
The biggest factor that affected grain yield was varietal selection. In a wet year, you would expect the varieties more suited to higher rainfall zones (e.g. Commander, Gairdner and Maritime), to stand out. However, the early maturing variety Hindmarsh yielded very well in 2010, but because of the price differential between Malt and Feed (~$90/t difference), it was more profitable to grow Commander. If the in-crop N application had not occurred and Hindmarsh had been segregated Malt 1, (~$25/t difference), the profitability would have been similar. If either variety can be grown, Commander would be better suited to earlier sowing, while Hindmarsh will continue to yield well when sown later.
Contact
Simon Craig
Ph: (03) 5492 2787
simon@bcg.org.au
Was this page helpful?
YOUR FEEDBACK