Farming systems design and water use efficiency (WUE) Challenging the French & Schultz Wue model
| Date: 13 Jun 2008
Dr Daniel Rodriguez, DPI&F and APSRU, Toowoomba, and Prof Victor Sadras, SARDI
Introduction
In the wheat-belt of eastern Australia, rainfall shifts from winter dominated in the south (South Australia, Victoria) to summer dominated in the north (northern New South Wales and Queensland). The seasonality of rainfall, together with frost risk, drives the choice of cultivar and sowing date, resulting in a flowering time between October in the south and August in the north. In eastern Australia wheat crops are therefore exposed to contrasting climatic conditions during the critical period for grain formation i.e. a window of about twenty days before and ten days after flowering, which affect yield potential, and the efficiency in the use of water (WUE). Understanding how those climatic conditions affect crop processes and how they vary from north to south and from season to season can help growers and consultants to set more realistic target yields across sites, locations and seasons.
In this work, we will (i) discuss some of the consequences of the shift from winter to summer rainfall between southern and northern regions in terms of implications for management and breeding (Table 1); (ii) make a note of caution on the use of simple rules of thumb (French & Schultz) for benchmarking WUE; and (iii) discuss the importance of more integrative and dynamic modelling approaches to explore alternatives to increase WUE at the single crop and whole farming systems level i.e. $/ha.mm.
Crop production is a function of the ability of crops to capture resources, chiefly solar radiation and water, and the efficiency in the use of those resources to produce dry matter and grain. Water limitation dominates crop production in Australia. Water availability is limited by low and highly variable rainfall, often in combination with soils where plant available water is restricted by physical and chemical constraints for root growth and function. Nutrient deficiencies and soil-borne diseases are also widespread and can further restrict water availability. In the 1980’s French and Schultz proposed the use of water-use efficiency as a benchmark for wheat crops in southern Australia. They plotted yield against water use from an extensive set of crops and concluded that the best yield of a cereal crop we can get (the slope of the relationship) is 20kg/ha.mm; and that the x-intercept of this line, accounts for soil evaporation (or unproductive loss of water), i.e. in a range of 30-170mm, depending on soil type and rainfall. Particularly the simplicity of having a single benchmarking figure of “attainable transpiration efficiency” (20kg grain/ha.mm) to estimate attainable wheat yields, has proven tempting and somehow useful for farmers and consultants to identify yield gaps, though extremely limiting and misleading when we need to understand underlying causes of underperforming crops and potential solutions to apparent yield gaps.
An alternative way to understand yield in water-limited environments
A better approach to understand yield in water limited environments could be made by analysing the components of the following simple equation:
Yield = ET * T/ET * TE * HI eq. 1
Where ET (evapo-transpiration) is the total water used in growing a crop (mm), ET consists of productive water use (transpired water), and water losses i.e. primarily soil water loss through soil evaporation, though in some cases run-off and deep drainage below the rooting depth of the crop could also be significant. T/ET is the fraction of ET captured as productive water use by the crop (i.e. taken up by the roots and transpired through the leaves); TE is the efficiency with which the plant can accumulate total growth for a given amount of transpired water (kg/ha.mm); and HI, is the harvest index, which is the fraction of total crop mass at harvest allocated to the grains i.e. grain yield divided by the total crop mass (excluding roots). In many ways this simple equation overcomes many of the shortcomings of the French & Schultz approach, i.e. by dissecting the contributing factors to WUE (kg/ha.mm), which are known to be responsive to different drivers (Hammer 2006). Reformulating the equation 1:
Yield/ET = WUE = T/ET * TE * HI eq. 2
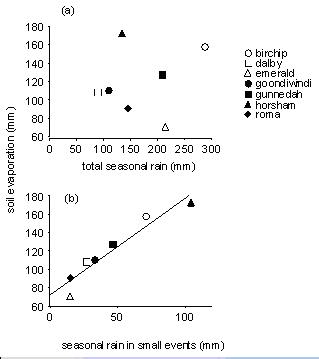
In equation 2, the fraction T/ET depends on losses of water through soil evaporation, run-off, and deep drainage. Some of these losses, particularly run-off, can be easily managed by increasing ground cover in zero or reduced till systems, or by any other practice that tends to improve rainfall capture i.e. rainfall infiltration. However, we now know that the size structure of rainfall events can also be of paramount importance (Sadras and Rodriguez, 2007). Rainfall has three key features: amount, seasonality, and event size. Although the importance of how much rain falls is obvious, the seasonality and size of events can also be significant. The most widespread source of inefficiency in rainfall use i.e. soil evaporation – is favoured by frequent, and often small rainfall events (Fig 1). In southern locations, water supply is dominated by in-season rainfall, with characteristically small events and high evaporative losses. As rainfall becomes more summer dominant and with preponderance of reduced amount of rainfall in small rainfall events (less than 5mm), the potential for losses trough soil evaporation are dramatically reduced.
Figure 1: Simulated soil evaporation is (a) unrelated to seasonal rainfall and (b) closely related to rainfall in small events (i.e. equal or below 5 mm).
The shift from winter to summer rainfall along eastern Australia not only affects plant water availability but also TE, i.e. the efficiency with which the plant can accumulate total growth for a given amount of transpired water (kg/ha.mm). TE primarily depends on the dryness of the air (i.e. atmospheric demand, which can be characterised by the vapour pressure deficit of the air), and the light transmissive properties of the atmosphere (i.e. the proportion of solar radiation that is direct and diffuse, characterised by the fraction of diffuse radiation). At around anthesis, in a transect going from Horsham (Vic.) to Emerald (Qld), median vapour pressure deficit increases from 0.92 to 1.28 kPa, and the fraction of diffuse radiation decreased from 0.61 to 0.41. These spatial gradients in climatic drivers can account for a significant southward increase in maximum TE i.e. 2.6% per degree latitude. Recently, Rodriguez and Sadras (2007) combined the value of these key climatic drivers, around the anthesis field wheat crops, and derived an index of wheat yield potential under rainfed conditions. According to this index maximum rainfed yields would decrease as we go north from Dubbo to Roma and Emerald. 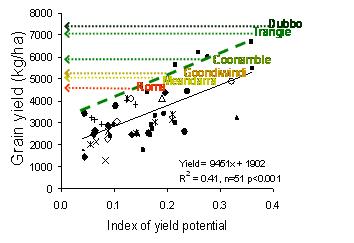
Figure 2: Relationship between observed wheat yields and an index of environmental potential. The green line indicates the relationship between the highest observed yields in field trials and the index for a number of locations along eastern Australia.
We can make a couple of points now: (i) in addition to rainfall and soil water availability, higher temperatures, increased air dryness and the light properties of the atmosphere will play a role at determining maximum achievable yields and maximum achievable values of WUE; (ii) assuming a constant WUE benchmarking value across eastern Australia, as in the French & Schultz approach, can be highly misleading.
Clarifying note: diffuse radiation is solar radiation reaching the earth's surface after having been scattered from the direct solar beam by suspended particles (dust, water in clouds, etc) in atmosphere. Environments in which diffuse radiation is high e.g England, Tasmania, Victoria, crops can have higher values of canopy photosynthesis. 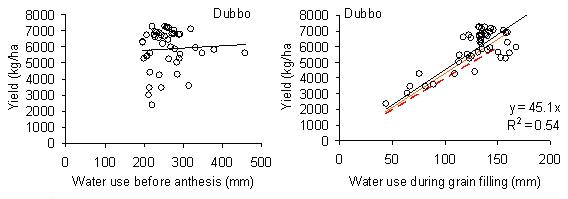
Figure 3: Relationship between wheat simulated wheat yields and water used before (a), after (b) anthesis, at Dubbo, NSW.
In Eq. 2 HI is the harvest index, which is calculated as the ratio between the grain yield and the total biomass produced by the crop at harvest (including the grain). For most crops HI is related to the environmental conditions during the grain filling period, i.e. from anthesis to physiological maturity. Cool and wet seasons in which the crop develops slowly and produces an extended grain filling period are usually associated to high HI and high yields. This brings another point, the importance of transferring the use of available soil water from vegetative (or before anthesis) to the grain filling period (Fig. 3). Though, again, as per the environmental effects on WUE described above, the efficiency of the transferred water can be expected to be highest in Dubbo and lower for more northern locations.
The transfer of water to the later stages of the crop can be achieved in a number of ways, for example, reducing tillering and/or reducing the planting density, using skip row systems in sorghum, or increasing the inter-row distances in wheat, particularly during expected dryer seasons, shallow soils or soils having sub-soil constraints, low initial soil waters and dry plantings.
Different crops will also have a contrasting partition of water use between pre and post anthesis (Fig 4), and will leave different amounts of water in the soil by harvest (Fig 5).
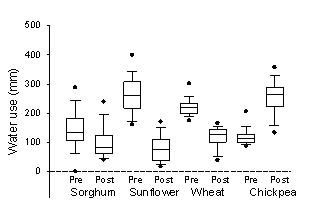
Figure 4: Simulated water used pre and post anthesis by sorghum, sunflower, wheat and chickpea crops at Dubbo, NSW. 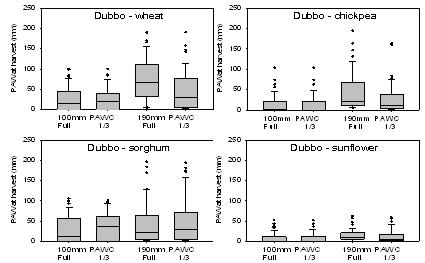
Figure 5: Simulated plant available water (PAW, mm) after the harvest of wheat, chickpea, sorghum and sunflower crops at Dubbo, NSW. Results are for a shallow (100mm) and medium depth (190mm) soil at full and 1/3 of plant available water capacity (PAWC) at planting. The boundary of the box closest to zero indicates the 25th lowest value, the line within the box marks the median (most likely value), and the boundary of the box farthest from zero indicates the 75th percent highest value. The whiskers above and below the box indicate the 90th and 10th extreme values, and the dots are outliers.
Measures of whole farming systems water use efficiency 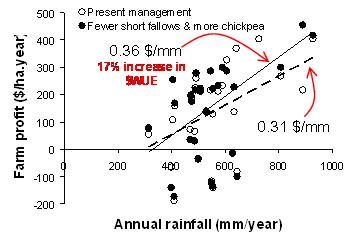
Figure 6: Relationship between farm profit and annual rainfall, for a 3000ha farm west of Goondiwindi during a wetter than average decade (1983-1992); under present management and when the number of long fallowed crops and number of chickpea were increased in the rotation.
Recent advances in whole farm systems modelling have allowed us to explore questions such us: What is right proportion of short fallow crops in the rotation? or What proportion of the resources i.e. land, machinery, labour should be invested into growing a particular crop?. Using APSFarm (i.e. APSRU’s whole farm systems simulator), we simulated a number of whole farm business economic parameters i.e. farm profit, down side risk (i.e. chance of making a loss), for a 3000ha cropping business west of Goondiwindi, during dryer than average, average and wetter than average decades. Results indicated that by increasing the proportion of long fallowed wheats and increasing the number of chickpeas in the rotation from 22 to 34% (i.e. increasing cropping intensity from 72 to 80%) during a wetter than average decade (1983-1992), the whole farm water use efficiency in ($/ha.mm rainfall), could be increased by 17% (Fig 6). This was reflected in an increase of up to $42/ha.y in profit. During average and dryer than average decades the profits increased by $35/ha.y and $4/ha.y, respectively (Fig 7). 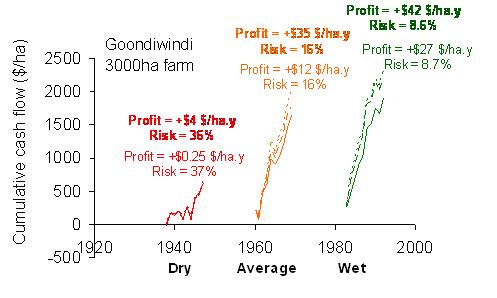
Figure 7: Cumulative cash-flow for a 3000ha farm west of Goondiwindi during a wetter than average decade (1983-1992); under present management and when the number of long fallowed crops and number of chickpea were increased in the rotation.
So far benefits of developing and discussing APSFarm results with groups of growers have been threefold: (1) in the process of model design and development APSFarm became the framework that ‘packaged’ the knowledge and discussion whilst allowing the actors to identify opportunities for change and improvement; (2) modelled results provided realistic measures of trade-offs between profit – risk – environmental impact across a number of possible farm-business alternative futures; (3) our farmers benefited from the test benching & fine tunning of cropping rules by reducing/accounting for the dimensionality of their complicated production systems.
Acknowledgements
This work was funded by the Queensland Department of Primary Industries and Fisheries (QDPI&F), and South Australian Research and Development Institute (SARDI) .
References
1. French RJ, Schultz JE (1984) Water use efficiency of wheat in a Mediterranean type environment. I. The relation between yield, water use and climate. Australian Journal of Agricultural Research 35, 743-764.
2. Hammer G (2006) Pathways to prosperity: breaking the yield barrier in sorghum. Agricultural Science 19, 2, 16-220
3. Sadras VO, Rodriguez D (2007) Water use efficiency of wheat in eastern Australia II. Water-limited: the influence of rainfall patterns Australian Journal of Agricultural Research 58, 657-669.
4. Rodriguez D, Sadras VO (2007) The limit to wheat water use efficiency in eastern Australia I. Gradients in the radiation environment and atmospheric demand. Australian Journal of Agricultural Research 58, 287-302.
Contact details
Dr Daniel Rodriguez
Principal Scientist, and Focus Team Leader Agricultural Systems Modelling
Department of Primary Industries & Fisheries
PO Box 102 Toowoomba Qld 4350
Ph: 07 4688 1437
Mb. 0434075094
Email: Daniel.Rodriguez@dpi.qld.gov.au
Was this page helpful?
YOUR FEEDBACK