Soil probes for better crop decisions
Author: Leighton Wilksch (Agbyte) | Date: 09 Feb 2016
Background
Soil moisture probe (SMP) technology has been around for more than 20 years in irrigated viticulture and horticulture, but its use in broadacre agriculture has only really been for the past five years. Whilst the actual technology of how capacitance probes measure soil moisture has changed very little in this time, the way the data is logged, transmitted and viewed has changed significantly.
Data from SMPs is now used by grain growers to quantify how much moisture is in the soil, what depth it is at, where plant roots are active and how much moisture is being used by the crop, particularly during the crucial flowering to grain fill stage.
Multiple years’ of data can give a clear picture of how much soil moisture there is at any point in time compared to previous seasons. This can assist in making decisions associated with when and what to plant during autumn, how much nitrogen to apply and potential for the crop to reach target yield.
Methodology
The location of a SMP is important to getting the best out of the data. Generally a grower will be installing one soil moisture probe and therefore getting it in the ‘median’ soil type of the farm is important. Sometimes if a grower is installing two SMPs, they may want to install one in a poorer soil type (sand) if that soil type makes up a sizeable proportion of the farm.
Increasingly we are seeing local networks of SMP (and weather stations) pop up that allow a grower to invest in one site, but have access to multiple sites. For example, on the northern Yorke Peninsula, there are a number of networks that have three to five neighbouring growers that each have a SMP installed in different soil types. In any one season, there will also be different crop types planted over the top of the SMP. Data can be displayed on the same webpage so that each grower can look at the others graphs and essentially extrapolate the information across their farm where they may have a similar soil type/crop type to their neighbour. This also allows for discussion amongst the group which has been found to be useful for getting a better understanding of plant available water and its use by the crop.
When installing the soil moisture probe, it can be most helpful to get an understanding of the type of soil the probe is going into. This means recording horizon changes down the profile and even stratifying out a soil sample in order to get it analysed for chemical and physical constraints; similar to a Yield Prophet test. This kind of data has proved to be useful for understanding why roots might be constrained in certain conditions such as high electro conductivity (EC); a measure of dissolved salts, boron or a compacted clay layer that only allows for slow percolation of moisture. Particle size analysis can also be done to give a confident estimate of moisture holding capacity of each horizon. Such tests may add approximately $500 to the cost of a site, but it is relevant information.
The soil moisture probe is typically installed some way from a fence that is away from a main road, away from trees, and does not have regular vehicle traffic (including tilled fire breaks). The SMP site needs to be measured so that it is away from the tramline tracks and the top of the probe is buried below the maximum tillage depth; usually 10-15cm for knife points or 5-10cm for disc systems. A cable is then trenched from the SMP to the fence where a telemetry unit sits that logs the data and pushes it (via a modem with SIM card) to a server. Radio systems are available but, in my experience, a modem system offers more versatility and is cost effective.
Modern telemetry units are able to take on board more and more sensor types. In my time dealing with SMPs (since 2008), this aspect has seen the greatest change. Telemetry systems used to be able to only take one type of data source, now they can take multiple (pulse output – rain gauge, SDI-12 – SMP, wind, T/RH and now even a camera image). If weather sensors are attached, the units are often programmed to log and upload data every 15 minutes (near-real time), which can lead to data usage issues if not set up correctly.
The way the data is displayed is also another factor worth considering. Graphing and displaying SMP data can be challenging as there are often many lines on a graph (one for each sensor down the length of the SMP) and as they move independently of one another. It can get quite confusing. It pays to ask those who have used various platforms to get a feel for what works and what does not.
As most SMP manufacturers have the majority of their business focussed on irrigated food production, it can be difficult to get sense out of some software for dryland situations.
Weather data can be displayed as current conditions as well as having post-processing done to deliver useful derivatives such as Delta T, frost index, growing degree days, dew point, leaf wetness, disease models and fire danger index. There are also software platforms available that can offer email/SMS alerting to notify when certain thresholds are reached, such as below 0⁰C for longer than one hour.
Results and discussion
Graph types are most often displayed as ‘stacked’ which show the individual sensors of the SMP (Figure 1) and ‘summed’ which is an interpolated sum of all the individual sensors which basically shows a ‘fuel gauge’ view (Figure 2). The specifics of how many millimetres of plant available water there is can sometimes get a bit confusing with some of the data displays. Capacitance probes measure percentage of soil moisture and the software can convert that into millimetres of soil moisture; sometimes with varying degrees of success.
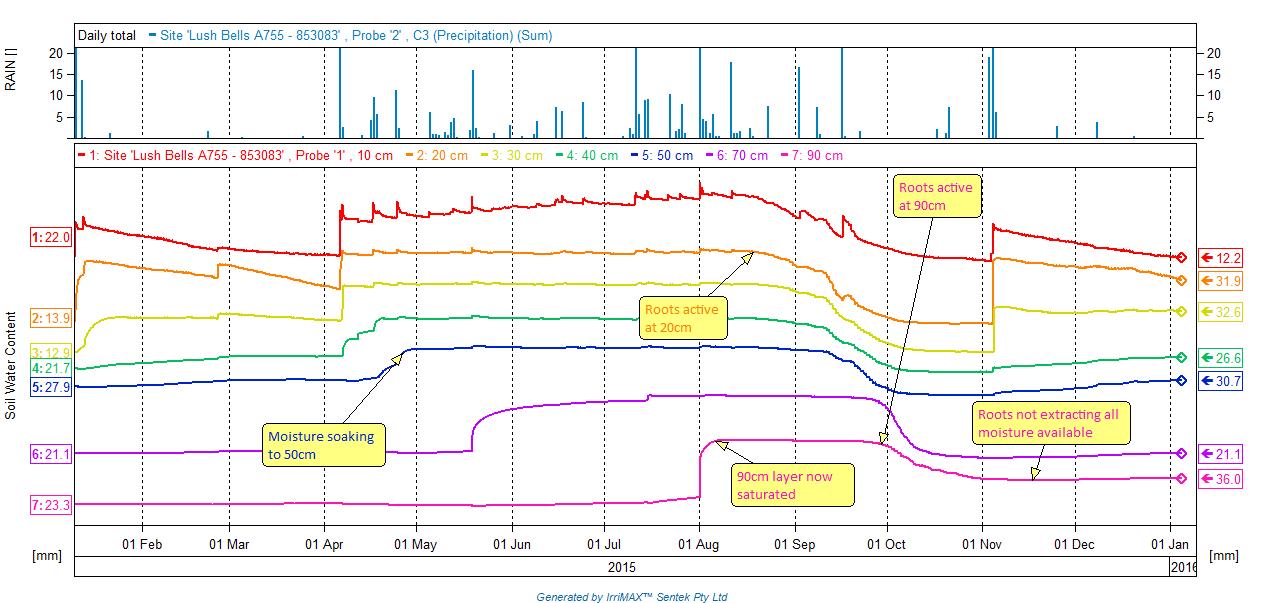
Figure 1: A stacked graph showing individual sensor depths.
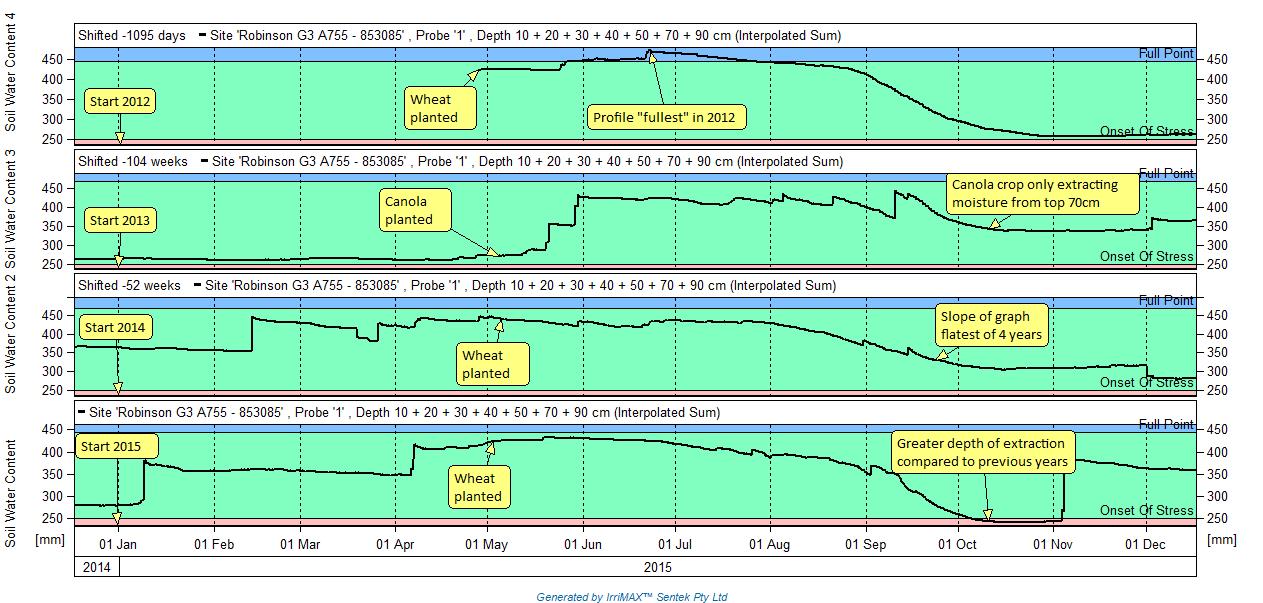
Figure 2: A summed graph with year on year comparisons by time-shifting each season so that it aligns with the same month as the panel below it.
For most users, having a graphical display of where soil moisture is relative to an upper limit (saturation) and a lower limit (onset of stress) allows for easy interpretation and decision making. A line graph also allows for a visual record of where soil moisture has been and where it is going. This is particularly useful for understanding the rate of ‘drawdown’ following winter as the crop fills during spring. The slope of the summed graph gives clues to how fast a crop is using moisture; referring to the stacked graph will show where moisture is and where the roots are active. Figure 3 shows a crop of sunflowers planted in late September 2015 on Kangaroo Island. As roots move deeper they extract moisture during the day (transpiration) and shut down at night, the next sensor down then exhibits the stepping as the roots move deeper.
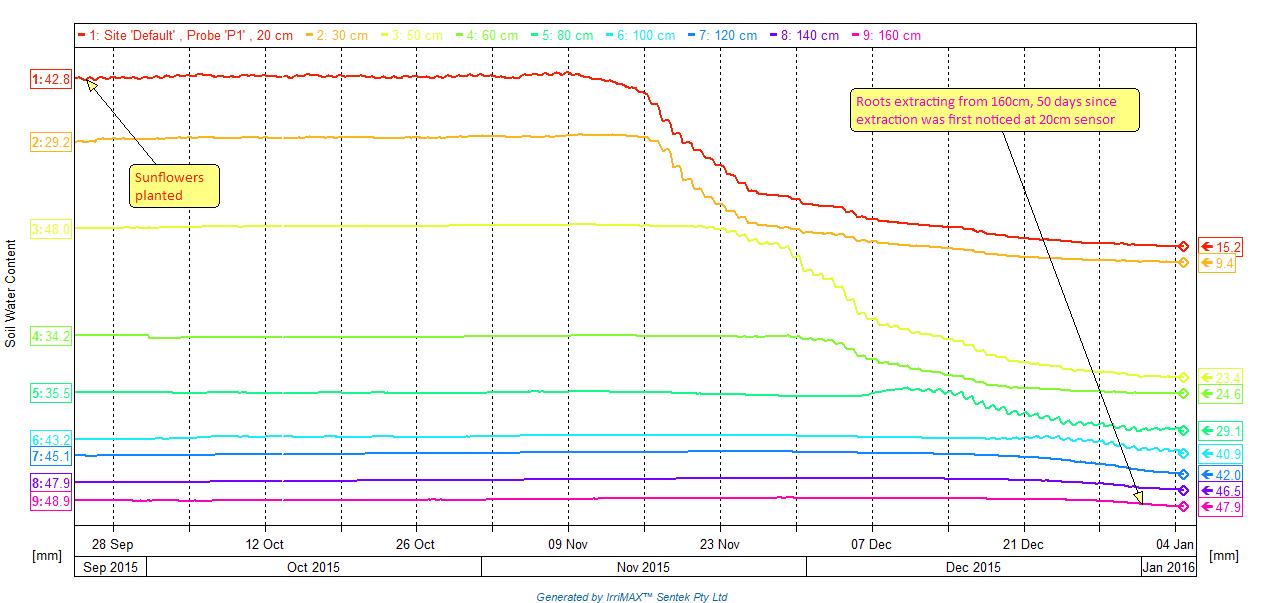
Figure 3: The activity of roots exhibited as diurnal stepping showing daily cycles of evapotranspiration.
Observing this diurnal fluctuation gives real time feedback of where roots are active, which can be useful information to help with making topdressing decisions. For example, if roots are active at 70cm because the top layers are already dry, then it will take a reasonable amount of rainfall in a front to get value out of spreading nitrogen in autumn. 2015 saw some atypical water movements with the soil profile, filling during August when there was good rain, but not soaking much below 40cm. Using a soil moisture probe assisted grain growers to make sound decisions about applying, or not applying, nitrogen during this period, based on their target yield and how much nitrogen (N) they had already applied.
Future work is focussing on getting a better display of millimetres of daily moisture use by the plant and aligning this with an accurate soil characterisation. By incorporating in real-time weather data, evapotranspiration can be calculated allowing for highly accurate analysis of plant moisture use. Some users are now installing SMPs to a greater depth. Often the first generation of SMPs were placed 80-100cm deep, now some sites are heading to 1.6m to better understand what is occurring at depth.
Pitfalls that can occur with SMPs are that installation needs to be sound to keep vermin away from the cabling and spray drift away from the telemetry unit. It is also important to keep the depth of the probe to a minimum to ensure that as much data from the top soil is collected, but deep enough to avoid jeopardising the SMP by hitting it with planting machinery.
Users also need to take time to get a full picture of what is occurring below the surface, this may take three to four years. Value can be gotten from the data in year one, but it increases in value in the longer the site is installed. Be aware that there can be weird movements of the graphs due to soil temperature fluctuations, lateral movement of moisture (often months after rainfall) or even no movement in middle layers (40-70cm) if they are relatively dry but roots are extracting from deeper (more than 90cm). Finally, be prepared that any technology pieces that are exposed to moisture, heat, dust and insects and are reliant on the mobile data network can and will have issues with data transfer from time to time.
Conclusion
Consider installing SMPs in conjunction with neighbours to get best value out of data. Get a sound understanding of the soil type you are installing into. Look at the data regularly and seek interpretation from those who have experience with the data. Consider hooking it up to a weather station so that you can access data that impacts your farming business daily.
Useful resources
360 Monitoring Alliance website
Contact details
Leighton Wilksch
Agbyte, Paskeville, Yorke Peninsula, SA
0408 428 714
Was this page helpful?
YOUR FEEDBACK