Why was our Free Trade Agreement (FTA) made that way? - the China farm sector
Author: Tom Taylor (Head of International Economics, NAB) | Date: 15 Sep 2015
Take home messages
- Australian farm exports to China were already growing fast before the FTA was agreed upon.
- China has a key focus on food security for its population, lifting incomes in rural areas and supporting incomes in the politically challenging areas of its peripheral regions.
- China has developed many policies; reserve price schemes, quotas, deficiency payments and subsidies that all impact on how it does business with the world.
- Farm support schemes in China face many challenges (and these are growing) from issues such as resources pressures, changing Chinese diet and the distortions the support systems create. More trade reform will be needed when the FTA is reviewed in three years.
- The FTA has many benefits for some Australian farm industries but little or nothing for others.
- The three per cent tariff on barley will be gone when the deal is signed.
- Sheepmeat – 12 to 23 per cent tariffs removed in eight years.
- Beef – 12 to 25 per cent tariffs removed in nine years.
- Live animals – removal of up to 10 per cent tariff over four years.
- For wheat and canola there has been no change.
- Wool is our biggest export to China ($2 billion +), this market has not been growing fast and there is no change to the trade system for this commodity.
- Chinese wheat prices on their internal markets are well above world levels.
- The Chinese diet is shifting away from grain toward more protein and fruit, grain use is increasing in respect to animals on feed.
- With the review of the FTA in three years there could be more gains for the Australian farm sector.
Australian farm exports to China and the FTA
Australian farm exports to China were already growing fast before the FTA agreed (Figure 1).
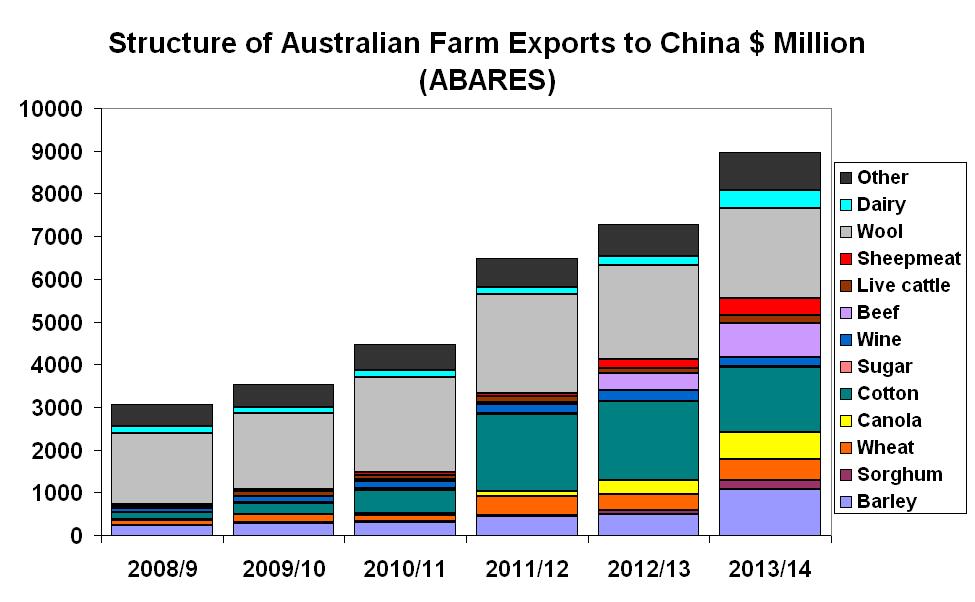
Figure 1: Structure of Australian farm exports to China ($ million, Source: ABARES).
Wool still easily the number one Victorian farm export to China, but other trades are growing (Figure 2).
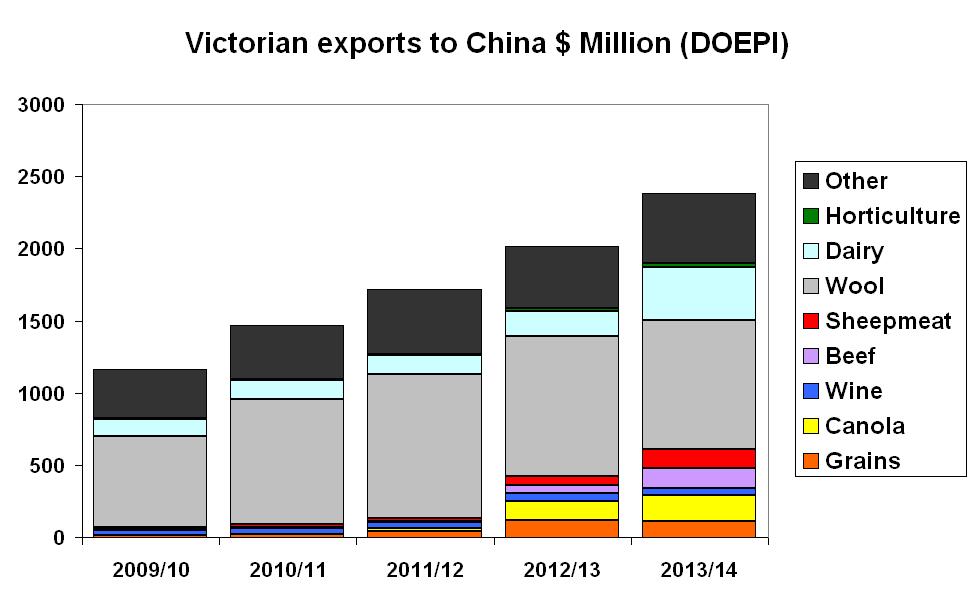
Figure 2: Victorian exports to China ($million, Source: DOEPI).
Growth trends in Victorian farm export volumes into China (Figure 3).
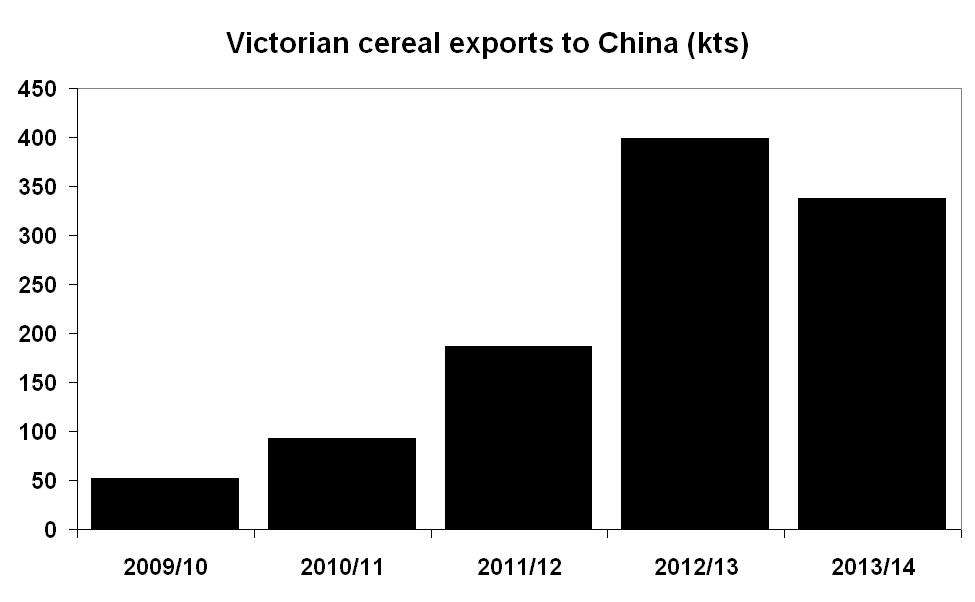
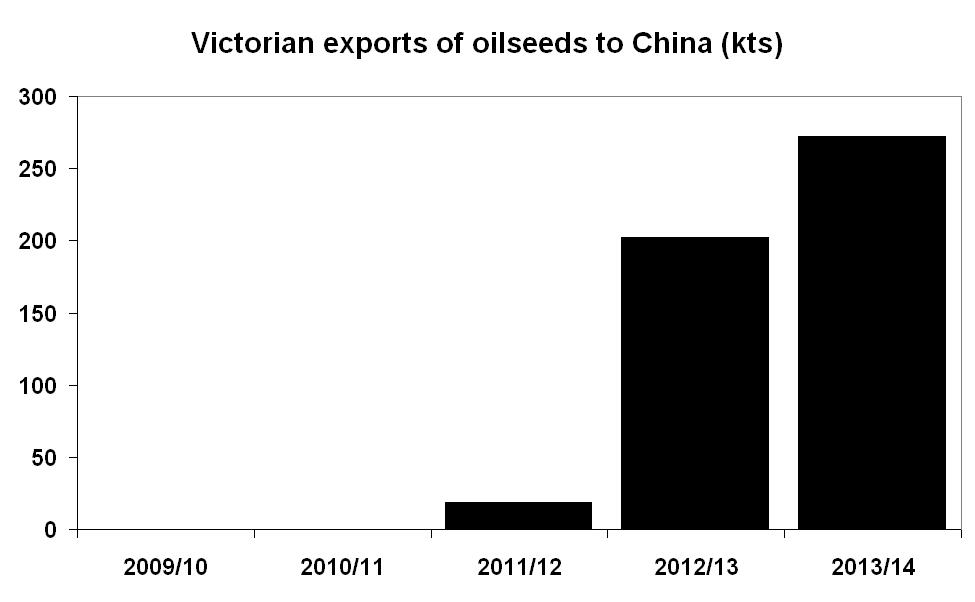
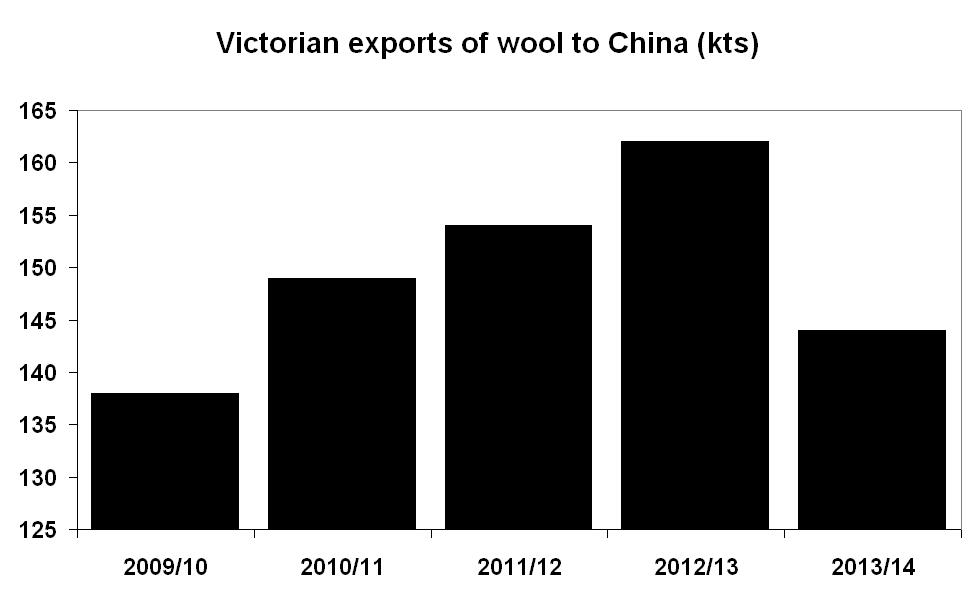
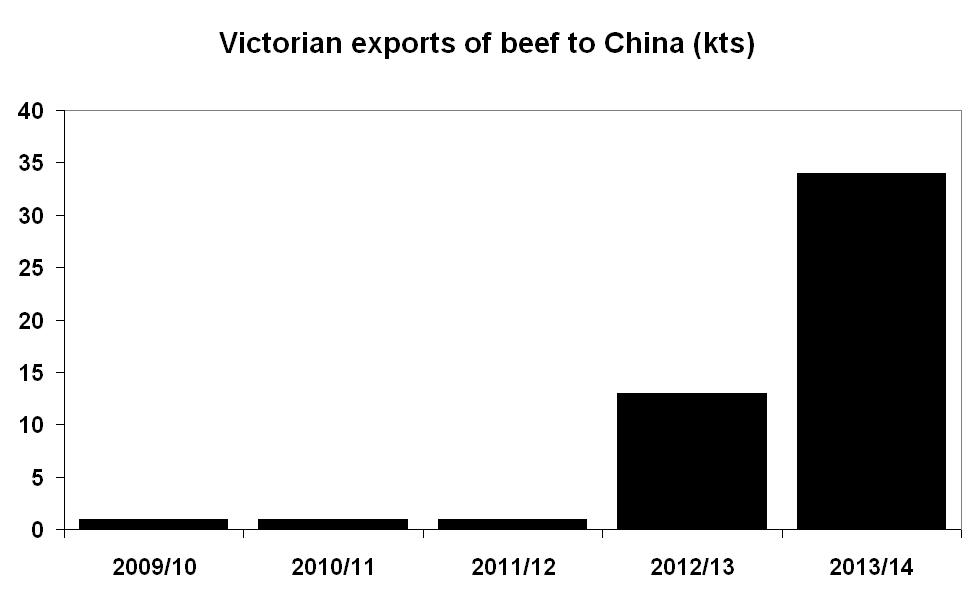
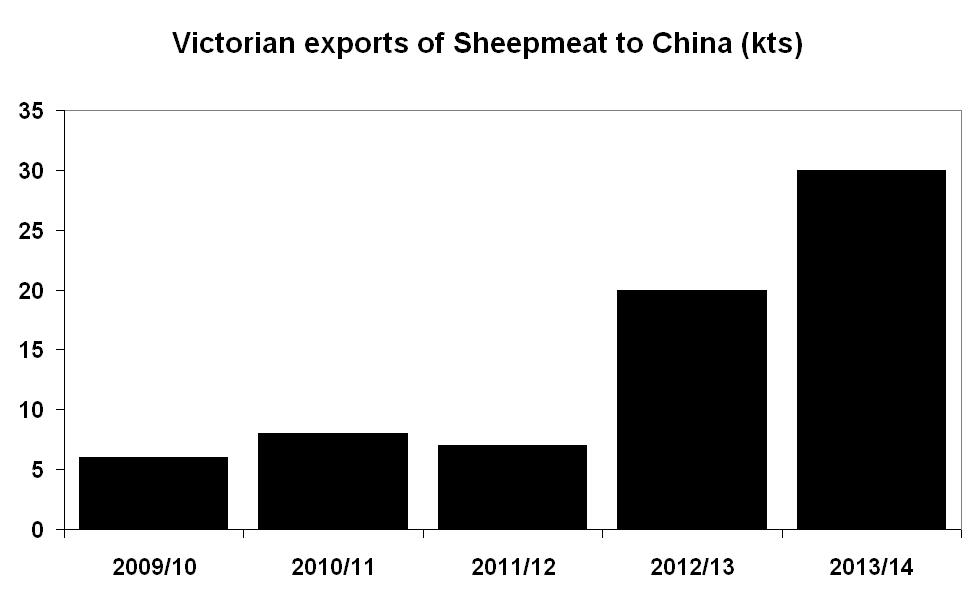
Figure 3: Growth trends in Victorian farm exports (kts) a) cereals b) oilseeds, c) wool, d) beef, e) sheepmeat.
Benefits from the FTA for some export markets:
- Barley and sorghum: three per cent and two per cent tariffs respectively, gone when deal signed.
- Beef: 12 to 25 per cent tariffs removed in nine years.
- Sheepmeat: 12 to 23 per cent tariffs removed in eight years.
- Horticulture: removal of all tariffs over four to eight years (citrus 30 per cent, nuts 25 per cent).
- Pork: removal of all tariffs (up to 20 per cent) over four years.
- Dairy: removal of 10 to 20 per cent tariffs over four to 11 years.
- Hides and skins: removal of five to 14 per cent tariffs over seven years.
- Wine: removal of 20 per cent bottled tariffs (bulk 14 per cent) over four years.
- Live animals: removal of up to 10 per cent tariff over four years.
Export markets whose tariffs remain the same following the FTA:
- canola
- cotton
- sugar
- wheat
- rice
- vegetable oils
Wool is our biggest export to China ($2 billion +) (Figures 4 and 5).
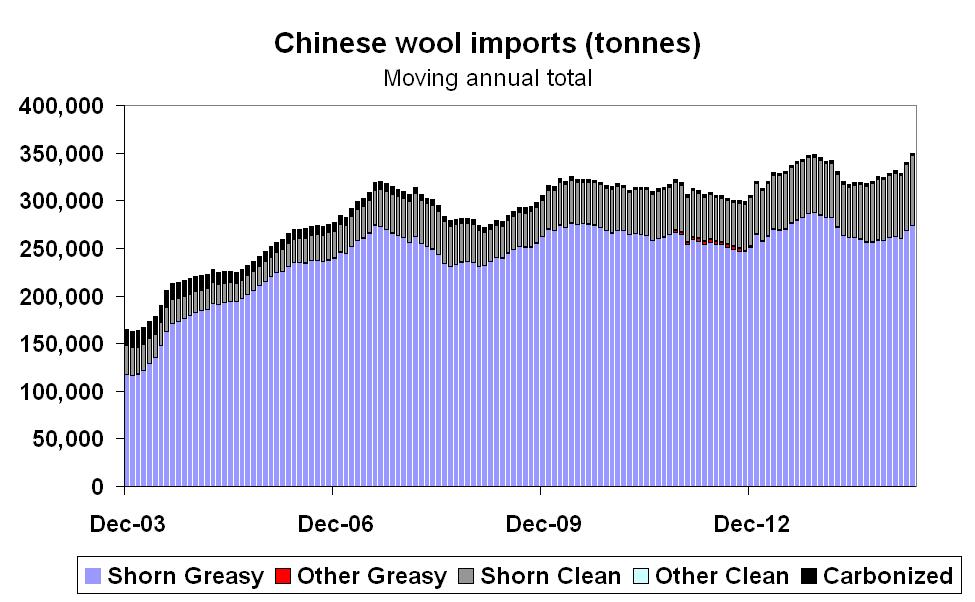
Figure 4: Chinese wool imports (tonnes).
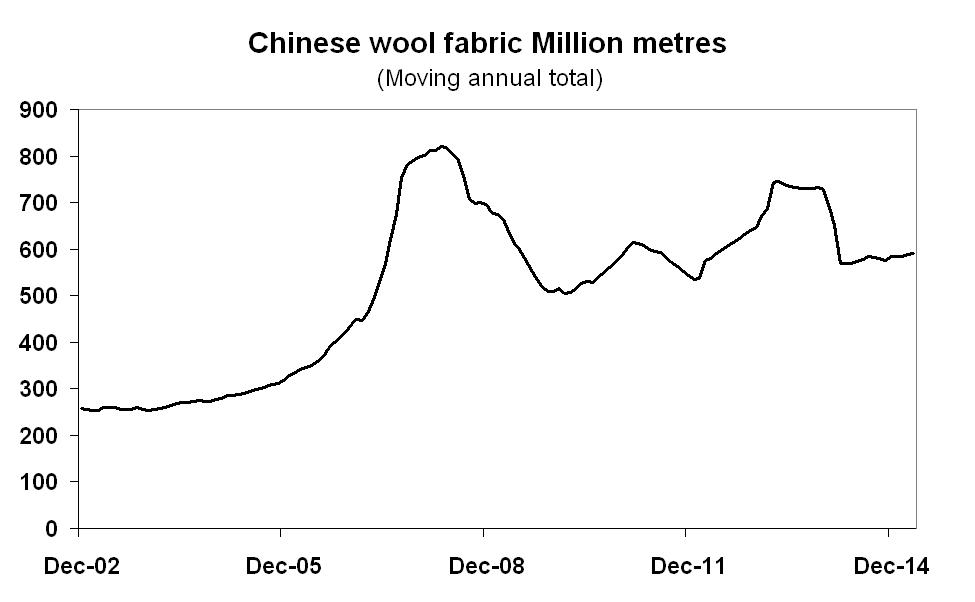
Figure 5: Chinese wool fabric (million metres).
- China is a big wool producer, 400 kts greasy per year.
- China has a 287 kt quota for wool.
- Imports within the quota pay one per cent tariff.
- Other imports pay 38 per cent tariff, but China has not levied this in the past.
- No change to this system.
- New 30 kt clean quota to grow by five per cent each year to 2024 with duty free access to Australia.
- Market has not been growing fast.
Some safeguards have been put in place for the Chinese beef and dairy sectors to prevent surge in duty free exports (Figure 6).
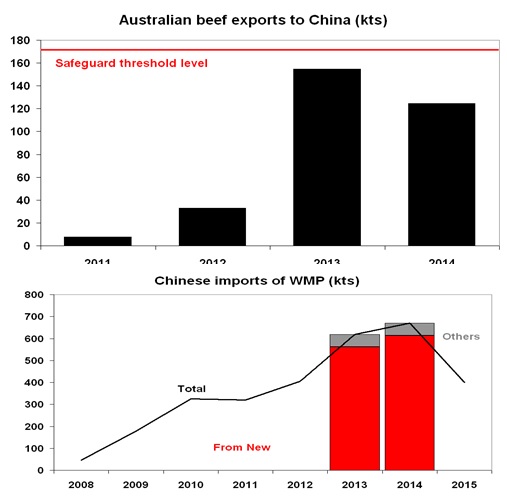
Figure 6: Exports and imports of beef products.
Beef industry safeguard:
- 170 kt starting level.
- Three per cent rise a year for 10 years.
- Automatic review for removal if no injury to Chinese.
Dairy industry safeguard:
- 17 ½ kt starting level.
- Five per cent rise a year.
- Automatic review for removal if no injury to Chinese.
Most tariffs for fruit and nuts are going to zero over four years (exception citrus) following the FTA:
- Tariffs on almonds, pistachios, walnuts and macadamias to zero in four years.
- Citrus fruit tariffs (11 to 30 per cent) to zero in eight years.
- Other fruit tariffs (10 to 30 per cent) to zero in four years.
- Vegetable tariffs (10 to 13 per cent) to zero in four years.
- Wine tariffs (14 to 20 per cent) to zero in four years.
All very positive but need to remember other market access issues such as phyto-sanitary agreements and procedures.
Ending tariffs is just part of what is needed to lift Australian fruit exports to China. Big fruit growing competitors like Chile and Peru also have free trade agreements with China and have much bigger export industries than Australia. Ten to 20 per cent tariffs are not as insuperable a trade barrier as the tariff-quota systems in grains, especially where state traders control much of the quota allocation. Free trade is just part of market access. Key is also getting phyto-sanitary agreements in place, the systems required by Chinese quarantine and keeping that clearance through quarantine.
Chinese farm policy objectives and measures
Start with a few proverbs:
- ‘When food is abundant there are many problems. When food is scarce, there is only one problem’.
- ‘The masses regard food as their heaven’.
- ‘When eating bamboo sprouts, remember the man who planted them’. ‘Food is the peoples’ primary necessity’.
- ‘If you have sufficient grain in your barn, you can live your life without any panic’.
- And then Chairman Mao ‘With enough grain reserves ready , our heart will be at ease’.
Explanation for some of the outcomes of the FTA? Why did some sectors do better than others? Need to look at:
- The Chinese Government’s objectives in its farm policy:
- Lifting incomes in rural areas and
- ensuring food security.
- Support incomes in politically tricky peripheral regions.
- The measures that have been adopted to meet these goals:
- Trade protection – tariffs and quotas.
- Support for farmers – reserve prices, deficiency payments and/or subsidies. These objectives and measures explain the differential benefits for Australian farmers in the FTA – need to look at it from viewpoint of Chinese priorities to see what they were willing to concede.
Goals of the Chinese agricultural policy:
- Lift incomes in rural areas to reduce poverty and spread benefits of growth through entire population (surveys show 20 per cent of rural population live below the poverty rate which equates to 200 million people).
- ‘Food security’ – generally defined to mean self-sufficiency in China but that assumption is increasingly questionable.
- Support incomes in politically sensitive peripheral provinces – cotton in Xinjiang and sugar in Guangxi.
- Import controls and high crop prices boost self-sufficiency but also damage population’s access to food by lifting prices and limiting availability of imported food types.
- Chinese ‘food security’ really focussed on cereals (rice, corn, wheat).
- Need to address nutrition as well as basic availability of cereals – higher incomes and changed diets causing growing health problems (obesity, diabetes).
- Problem for authorities – China a huge diverse country, its authorities face very different problems in different places – issues in wealthy coastal cities differ entirely from poor Western farming provinces.
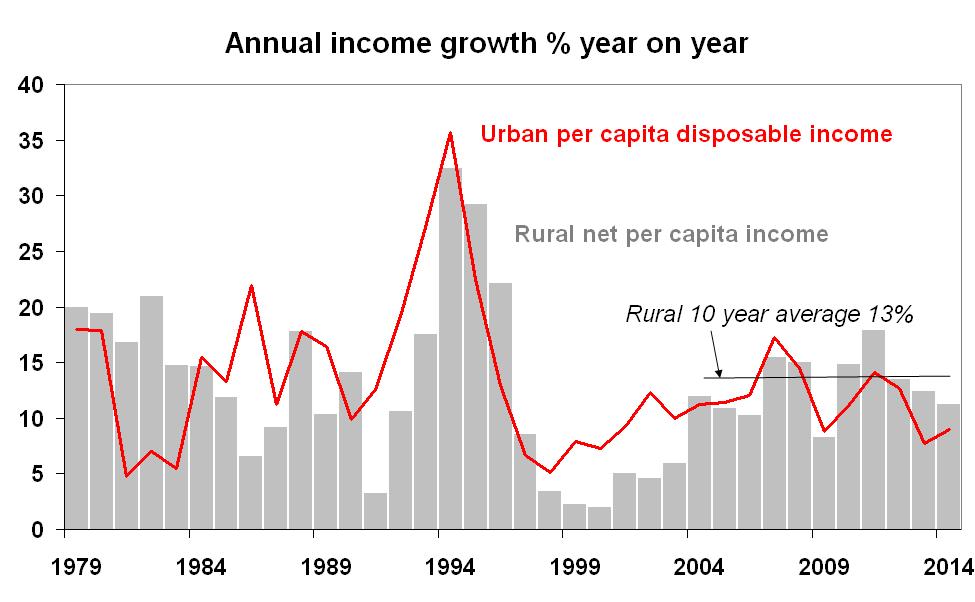
Figure 7: Income growth for urban and rural areas of China.
Food security – a difficult political issue in China.
- Fear that country could be caught if domestic crop failure coincided with world shortage - focus on the sheer size of Chinese grain needs relative to supply and history of natural disasters that have hit crop supplies in China.
- Chinese wheat consumption 122 million tonnes, world trade 157 million.
- Chinese rice consumption 151 million tonnes, world exports 42 million tonnes.
- Situation made worse if big producers stop exporting to conserve their own supplies and world prices spike (seen in the past).
- Urban poor in China are especially vulnerable - spending 40 per cent of their disposable income on food. Many rural poor are vulnerable too but often farmers are probably worse as lower crop volumes outweigh higher food prices.
- Chinese food security historically meant 95 per cent self-sufficiency target for basic grains (wheat, rice, corn) and target to maintain 120 million ha of arable farm land.
- But signs of backing off – soybeans already taken out of production and early 2015 policy document talks of ‘scientifically’ calculating self-sufficiency ratios (to lower it for corn?).
Self-sufficiency rates still very high outside soybean and cotton sectors (Figure 8).
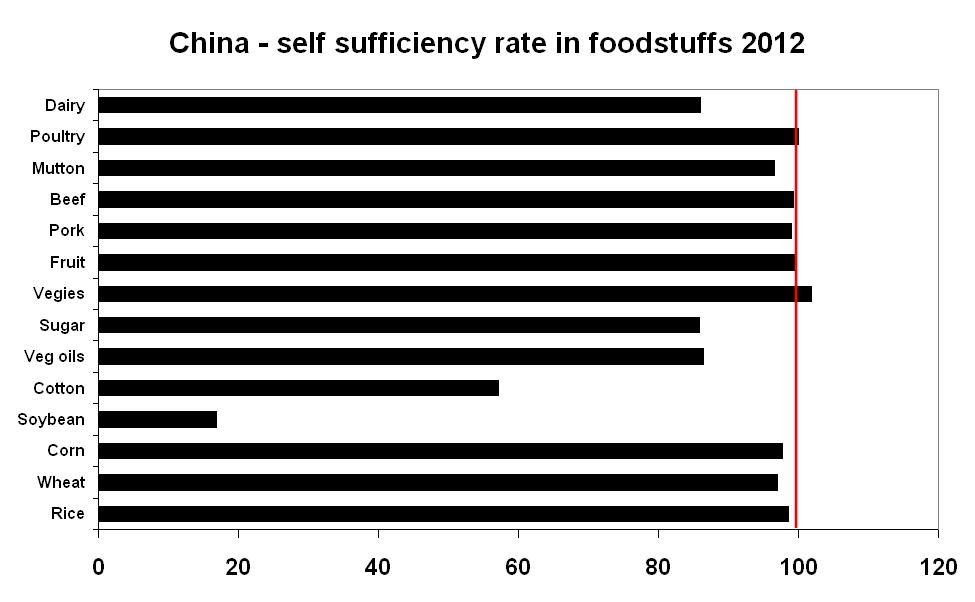
Figure 8: Self-sufficiency rates in foodstuffs 2012.
Soybeans easily the biggest import item (Figure 9).
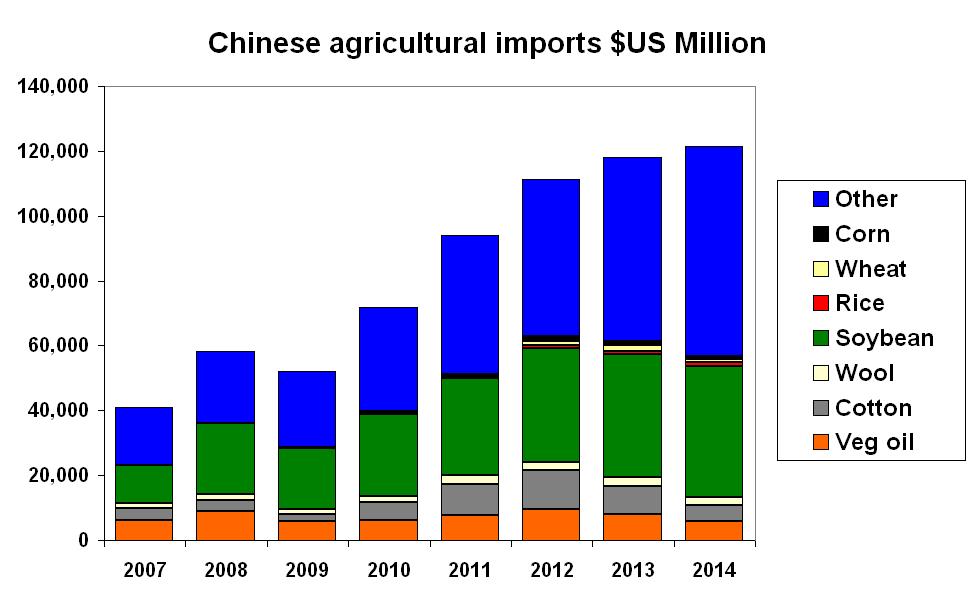
Figure 9: Chinese agricultural imports ($US million, 2007-14).
Trade measures – tariffs and quotas heavily protect favoured sectors
Most tariffs moderate but very high protection in sensitive sectors (Table 1 and Table 2).
Table 1: China bound WTO tariffs and percentage entering duty free.
| Average bound tariff | % duty free | MFN tariffs | % duty free | |
|---|---|---|---|---|
| Meat | 14.8 | 9.4 | 14.7 | 10.1 |
| Dairy | 12.2 | 0 | 12 | 0 |
| Fruit and veg | 15 | 4.8 | 14.8 | 5.9 |
| Cereals | 23.7 | 2.6 | 23.9 | 3.4 |
| Oilseeds | 11.6 | 6.2 | 10.6 | 5.4 |
| Sugars | 27.4 | 0 | 27.4 | 0 |
| Cotton | 22 | 0 | 22 | 0 |
| Other agriculture | 11.9 | 10.2 | 11.5 | 9.4 |
Table 2: Chinese agricultural tariff rate quotas.
| Quota volume | in-quota tariff | Over quota tariff | % with State Trades | |
|---|---|---|---|---|
| Wheat | 9636 | 1 | 65 | 90 |
| Corn | 7200 | 1 | 50 | 60 |
| Short rice | 2660 | 1 | 50 | 50 |
| Long rice | 2660 | 1 | 50 | 50 |
| Cotton | 894 | 1 | 40 | 33 |
| Sugar | 1945 | varies | 50 | 70 |
| Wool | 287 | 1 | 38 | |
| Tops | 80 | 3 | 38 |
History of low fill rates for grain quotas (Figure 10):
- Very low fill rates for some quotas – big role of State trading groups in grains criticised.
- Cotton and wool quotas always filled.
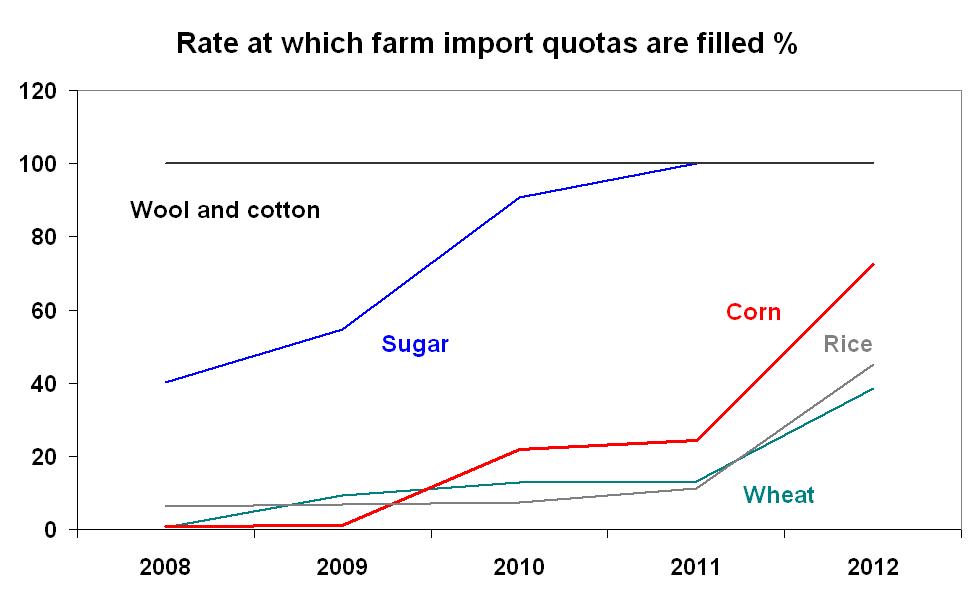
Figure 10: Rate at which farm import quotas are filled (%).
There has been sizable volumes of over-quota imports for sugar and cotton, despite big penalties (Figure 11).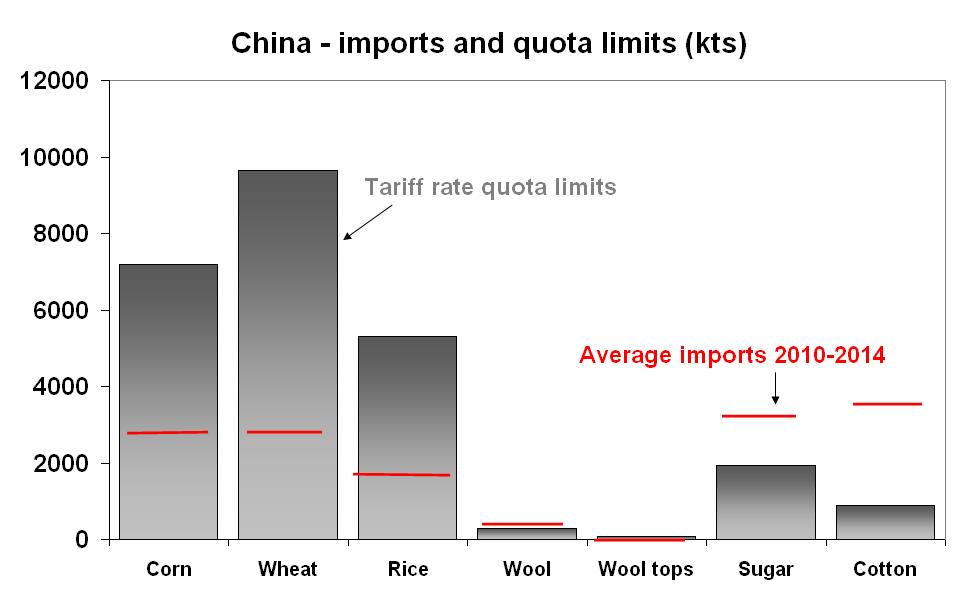
Figure 11: China – imports and quota limits (kts).
Market price and income support for basic crops
Government began supporting prices in 2004 by setting target minimum price for rice, buying up supplies at that price and putting them into public stocks for later auction. This scheme extended to wheat in 2006 and corn in 2008 and similar programs also extended to cover soybeans, canola, cotton and sugar.
Official target prices increased sharply through to 2014, trying to keep pace with rapid growth in farm costs and support incomes.
Basic problem – very high rates of cost increases in Chinese farming, need big increases in support prices to maintain farm incomes. Need to lift efficiency, scale, technology and productivity.
Structure of farm support programs in 2015, interestingly they are the same products as on Australia’s red list:
- Wheat – minimum reserve price plus quota.
- Corn – minimum reserve price plus quota.
- Rice – minimum reserve price plus quota.
- Canola – minimum reserve price, no quota.
- Sugar – ‘target price’ income support plus quota.
- Sugar – ‘target price’ income support plus quota.
- Cotton – ‘target price’ income support plus quota.
- Soybeans – ‘target price’ income support, no quota.
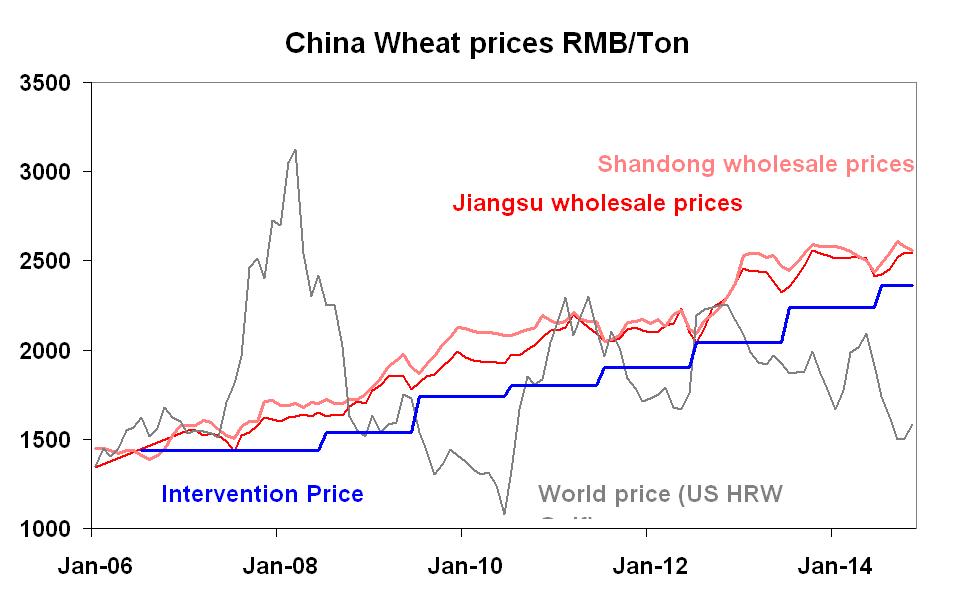
Figure 12: China wheat prices (renminbi (RMB)/tonne).
The Chinese domestic/international price gap even worse for corn (Figure 13).
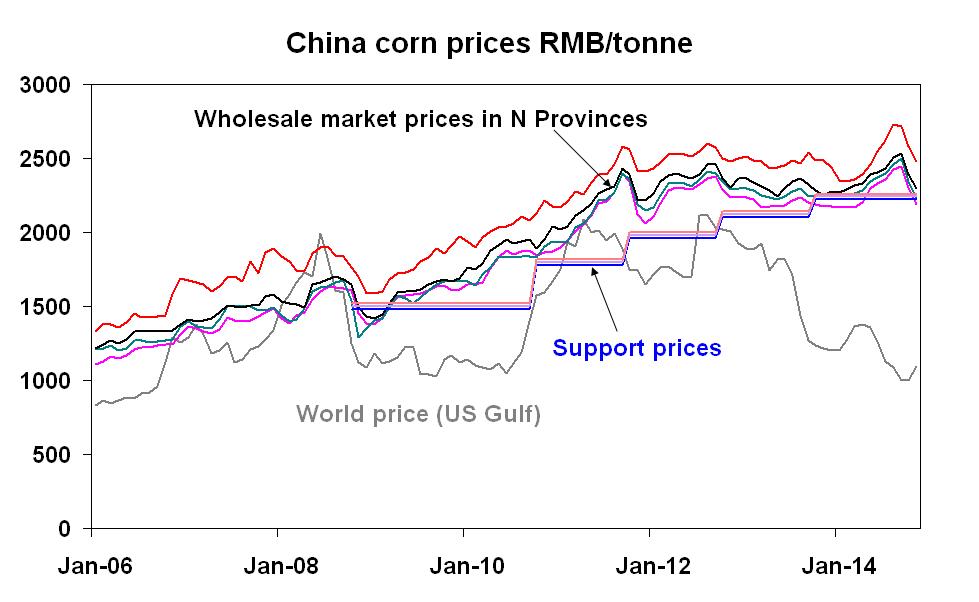
Figure 13: China corn prices (renminbi (RMB)/tonne).
Farm support system creating growing problems for the Chinese:
- Chinese support prices clearly well above world prices – big transfers from users (with reserve price) and from government (with deficiency payment).
- Growers continue to produce and the government stockpiles keep growing – hard to get rid of surplus in public stocks- two ceilings (WTO limits and import prices) meet rising floor of rising farm costs.
- Price gap with world got so big local buyers switched to imports, even after paying the high over quota tariff rate – so both imports and domestic over-supply going into stocks.
- High domestic prices penalise Chinese users of these crops – cotton spinners, grain millers, sugar mills – lose competitiveness to offshore rivals.
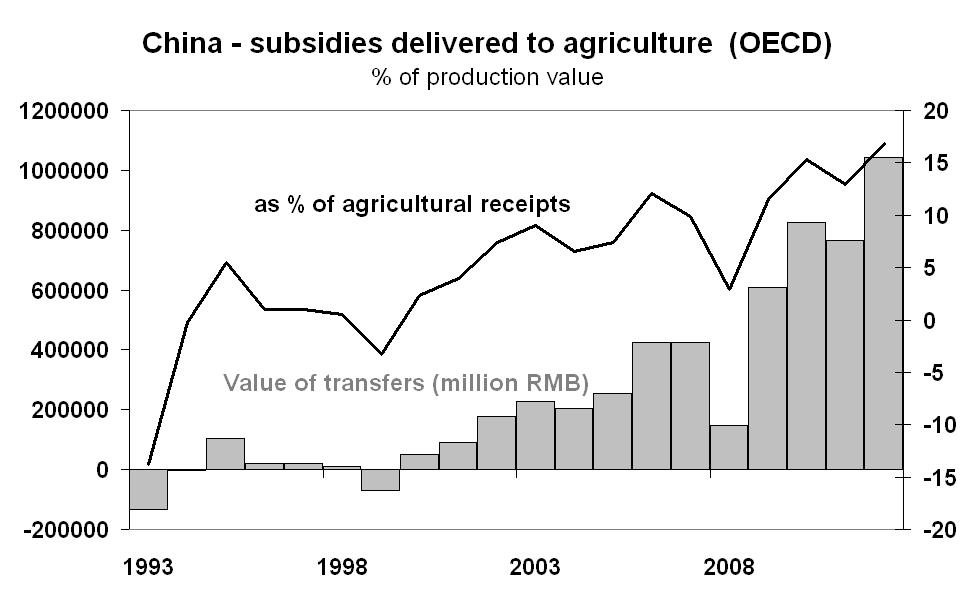
Figure 14: Chinese subsidies delivered to agriculture (OECD).
Cotton, milk and wheat are getting very big proportionate income transfers (Figure 15).
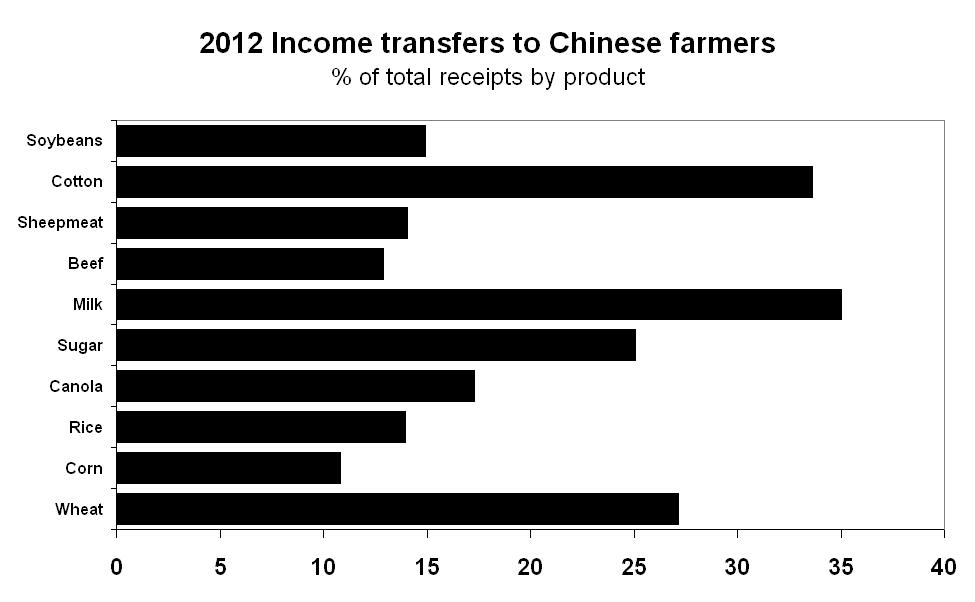
Figure 15: 2012 income transfers to Chinese farmers (% of total receipts by product).
China has seen accumulation of big stocks of basic farm commodities and high imports (Figure 16)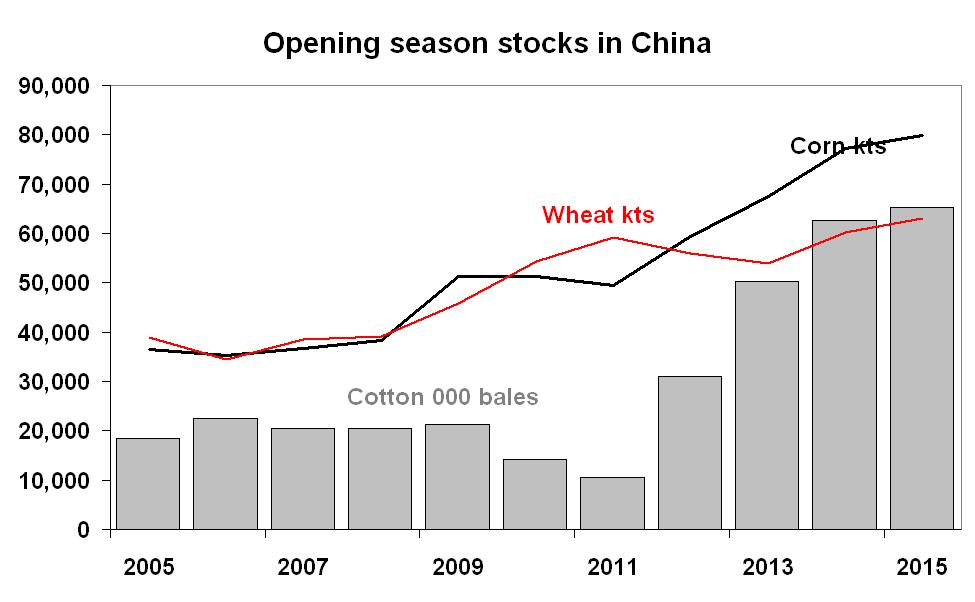
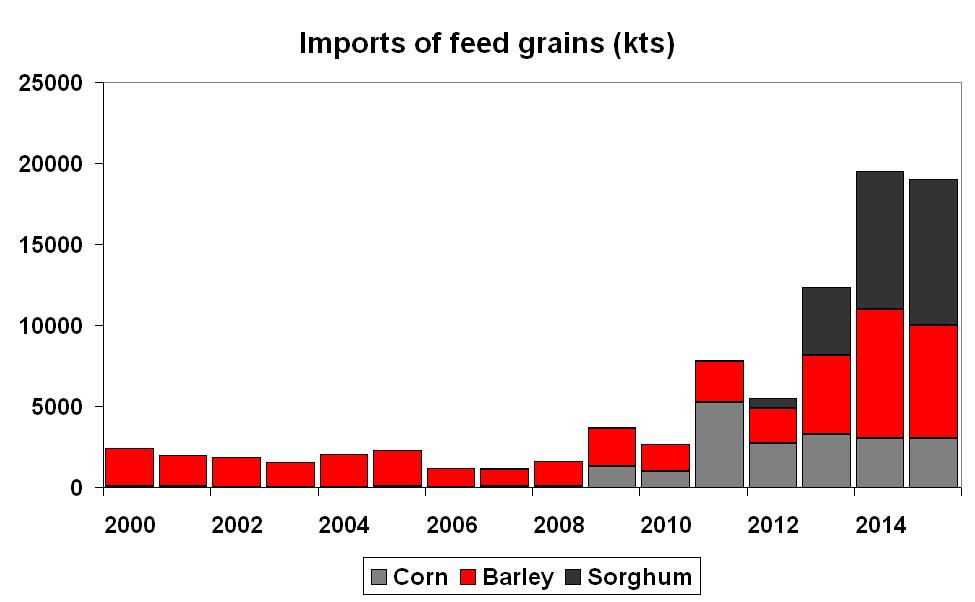
Figure 16 a): Opening season stocks in China and b) imports of feed grains (kts).
There is a role of quite small feed grains in the widening cereal trade deficit and replacing costy corn.
What to do now:
- Pilot programs replacing reserve price schemes with deficiency payments introduced for soybeans, cotton and sugar – not going very well.
- China has frozen support prices for key crops- for soybeans, rice, wheat, corn in 2014.
- WTO subsidy calculations use different base prices so gives China leeway to give farmers big income transfers without breaching WTO rules – latest Chinese returns cover domestic support to 2010 only and no problems.
- But US suspects commodity specific 8½ per cent limits being breached and reports of senior Chinese Ag officials thinking that could be the case too.
- Pressure private traders to buy inflated public crop stockpiles if they want to get access to imports coming in at low rates under the quotas.
- My guess – eventually move to buffer funds rather than reserve prices but a big task and lots could go wrong.
Changes in diet question relevance of Chinese farm support system
Food security objective increasingly anachronistic as:
- Food security really boils down to grain self-sufficiency.
- Chinese diet increasingly shifting away from such high reliance on grains.
- Rising share of grains not for human consumption but for animal feed – adding to costs of meat, dairy products.
- Diversity of conditions – need to address variety of nutritional problems from low calorie intake to excess with obesity, diabetes
- Can one food policy really solve all problems?
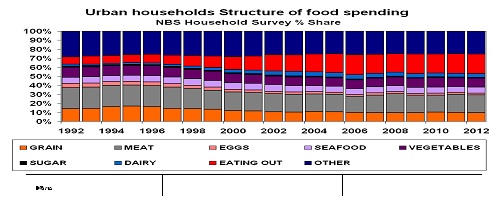
Figure 17: Urban households structure of food spending (bottom box is relative percentage spent on grains).
Chinese diet shifting away from grains towards consumption of protein and fruit (Figure 18):
- FTA offers great potential for Australian farm sector as we specialise in products facing strongly growing demand in China- protein, fruit, feed.
- Potential to supply both meat and dairy final goods as well as feed for the animal complex (canola, feed barley, sorghum).
- Competitors already have FTAs giving them competitive advantage in the market – NZ for meat and dairy, Peru and Chile for fruit and wine – we can level the playing field now.
- Make the case to Chinese that their food security best assured by partnership with Australian agri-sector (foreign investment) rather than relying on high cost local sectors producing protein.
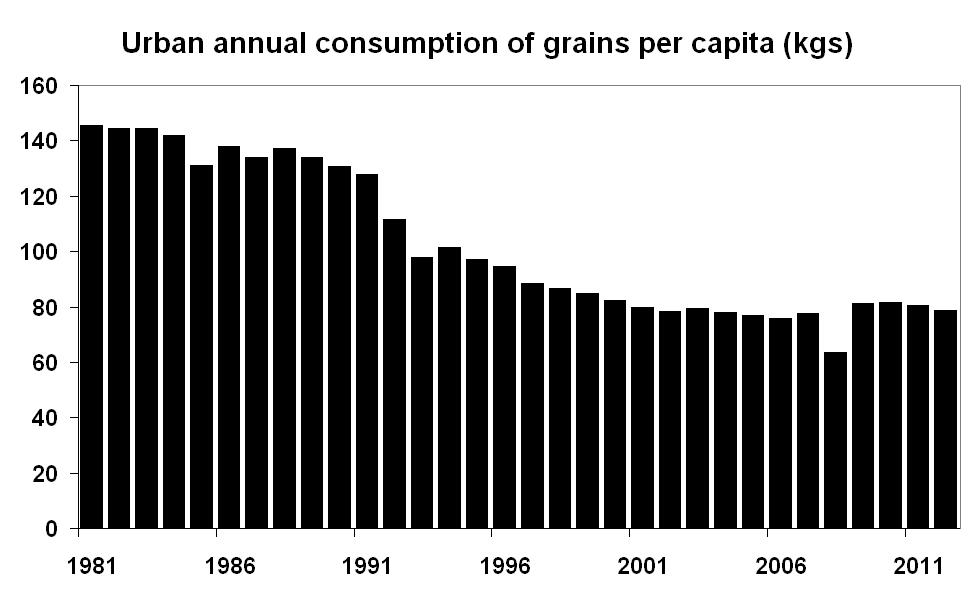
Figure 18: Trends in urban annual consumption of a) grains per capita (kgs) and b) meat and dairy (kgs).
Same shifting patterns of food consumption also seen in rural areas – to protein from grain. Scope for plenty more growth.
Rising meat and milk consumption reflected in big lift in cereals used as feed (Figure 19).
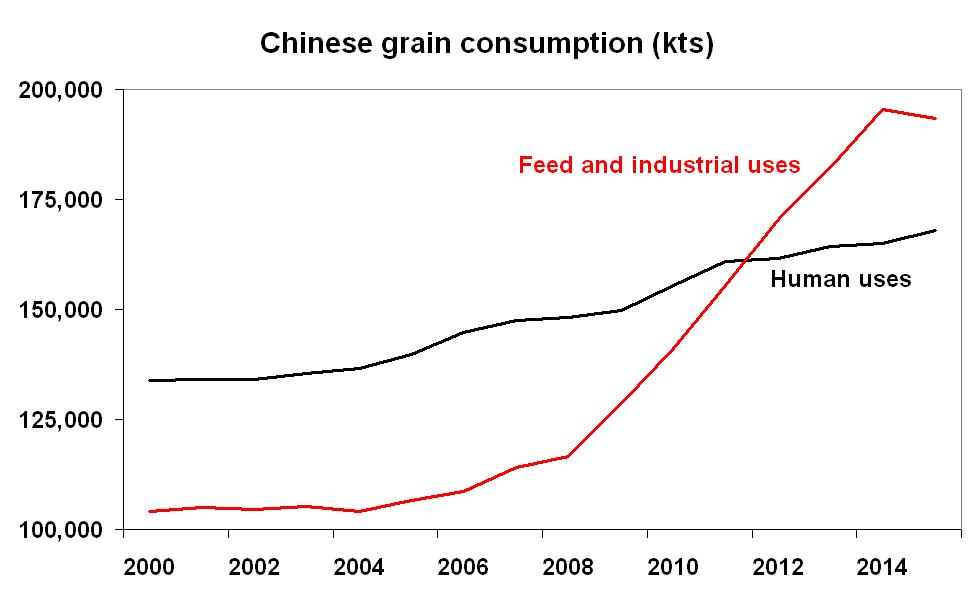
Figure 19: Chinese grain consumption from 2000 to 2014.
Canola has reserve price support and going into processing and feed sectors (Figure 20).
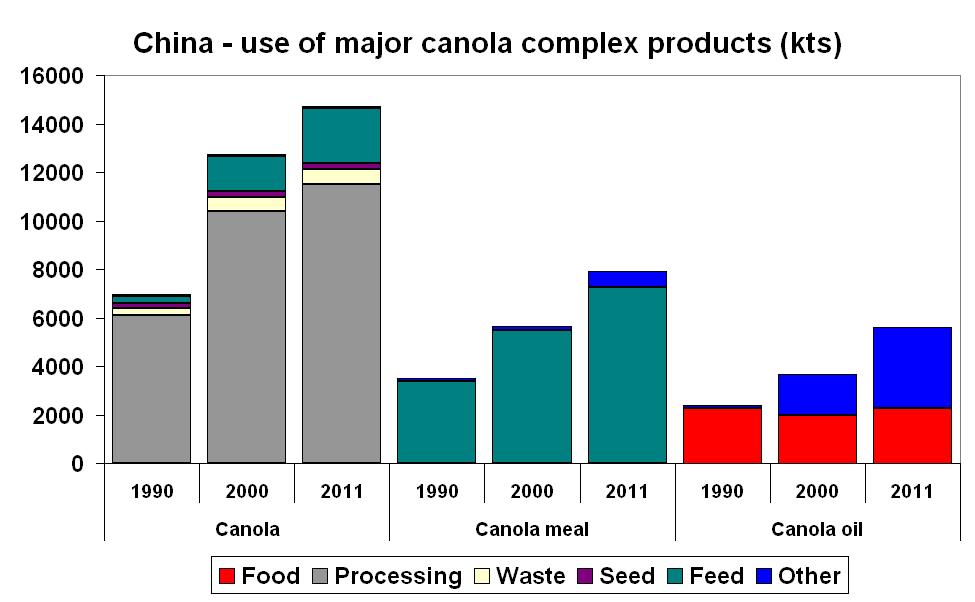
Figure 20: China’s use of major canola complex products (kts).
Two case studies (Urban Jiangsu Province and Rural Guyuan Province) show the range of issues in Chinese food security policy.
Urban Jiangsu province:
- Affluent coastal region.
- Major population centre - 70 million people.
- See impact on food spending as income increases.
- Very unequal distribution of income – top 20 per cent have six times the income of poorest 20 per cent.
- Share of grains, eggs and oils falls as income rises, more spent on meat, dairy, fruit, poultry, seafood (Figure 21 and Table 3).
- ‘Larger income growth for low income strata relative to high income strata would lead to a greater increase in food demand in urban Jiangsu than that occurring if income growth were uniform’- so food demand depends on pattern of growth.
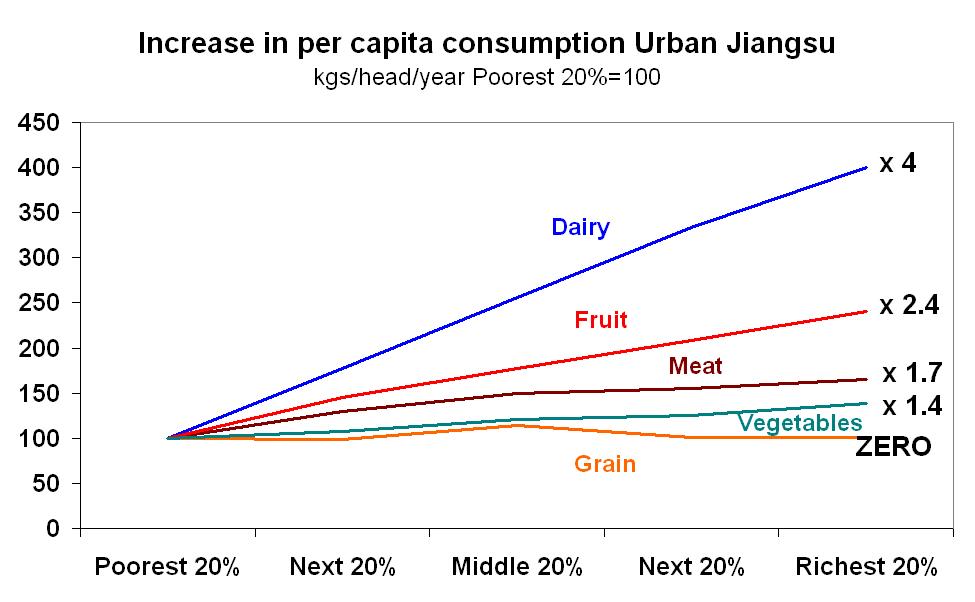
Figure 21: Patterns of food item consumption of different income groups (Poorest 20% = 100).
Table 3: Average food consumption (kg/person/year) of people from the Urban Jiangsu Province.| Grain | Meat | Dairy | Fruit | Vegies | Income effect | |
|---|---|---|---|---|---|---|
| Poorest 20% | 79 | 20 | 9 | 35 | 105 | 0.506 |
| Next 20% | 78 | 26 | 16 | 51 | 113 | 0.282 |
| Middle 20% | 90 | 30 | 23 | 62 | 127 | 0.328 |
| Next 20% | 80 | 31 | 30 | 73 | 131 | 0.26 |
| Richest 20% | 80 | 33 | 36 | 84 | 145 | 0.152 |
| Average | 81 | 28 | 23 | 61 | 124 | 0.326 |
Rural Guyuan province
- Very poor farming area (40 per cent population below the povery line) – grow wheat, corn and potatoes.
- Average total calorie intake matches Chinese recommended standard for basic health but protein and fat intake well below recommended levels (Figure 22).
- Very little animal protein consumed, well below recommended minima – meat only 7.5 per cent of total intake instead of 30 per cent advised.
- ‘Unbalance nutrition’ could lead to health problems, need to lift meat consumption and reduce primacy of grains.
- Very different food policy problems with messages for farm support.
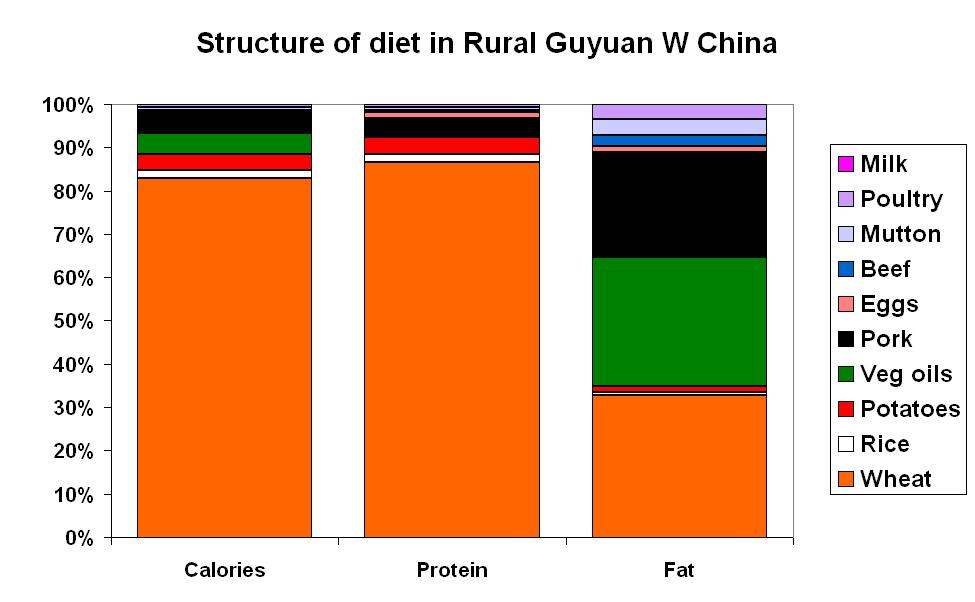
Figure 22: Structure of diet in rural Guyuan province (bottom block represents wheat).
Growing resource pressures will constrain Chinese farm output and will result in a need to import
Lifting land and water resources through importing land/water intensive goods:
- China has to feed 22 per cent of world population with only eight per cent of world’s fresh water and seven per cent of its cultivated land.
- Diet shifting toward much more resource intensive foods.
- Authorities increasingly see trade as a way to alleviate resource constraints – import very land and water intensive items.
- Goes against goal of promoting self-sufficiency but limited land and water plus growing food demand and shifting mix means China has to prioritise what it wants to be self-sufficient in:
- Animal feed versus meat and dairy – do you import feed or meat.
- Where do textile fibres fit in – not a food item.
- Prioritise basic grain growing with shrinking per capita consumption and low land needs or more resource intensive proteins where demand is growing fast.
Food demand has shifted towards products that are far more resource intensive to make (Figure 23).
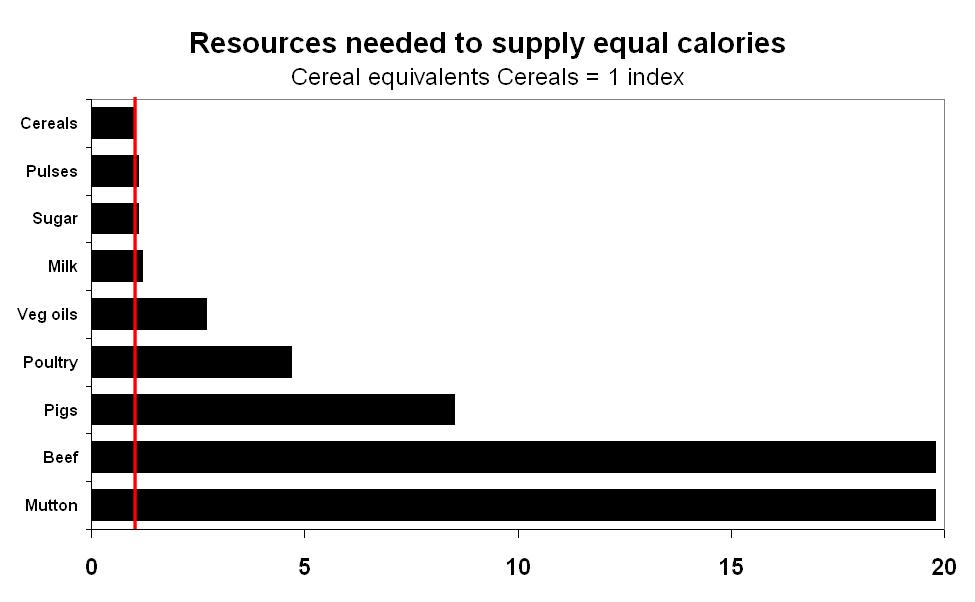
Figure 23: Resources need to supply equal calories (cereal equivalents, cereals = 1 index).
Resource constraints – water shortages:
- Major water problems in China – 23 out of 30 provinces have at least moderate water stress, Shanghai and Beijing have major stress.
- Pollution by industrial/urban waste, excessive groundwater extraction and fast growing industrial/urban demand are all major problems.
- Higher water demand per person living in urban areas than in rural and consumption grows with income – and both urbanisation and income are growing.
- Less clear that climate change itself is a negative – results vary, depends on which part of the country.
- Irrigated agriculture a major user of water and it’s not clear that it is the economically optimal user of that scarce resource e.g. Zhangye in Heihe River Basin, better to give the water to industry from farming.
Diet patterns with more protein need far more water to produce one tonne of product (Figure 24).
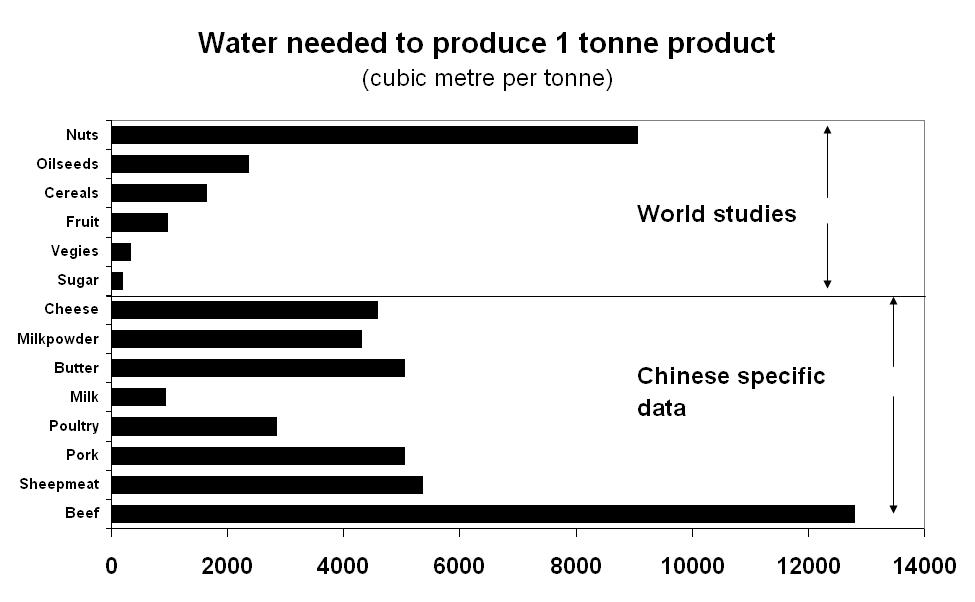
Figure 24: Water needed to produce one tonne of product (World studies versus Chinese specific data).
‘Virtual water imports’ could help address China’s resource problems:
- Study volume of water needed to grow certain crops and calculate how much water is then embodied in the farm products traded.
- Huge lift in volume of water imported into China in the form of crops – from 7km3 in 1986 to 137km3 in 2009.
- 97 per cent of that water is in grain crops, 91per cent in soybeans.
- Water coming from US, South America, Africa.
- If this kind of thinking gets accepted in China, could make them more willing to import protein in the form of beef, sheepmeat, nuts and dairy rather than rely on feed imports.
There is pressure on land resources too. The best cropland is near urban centres:
- Only 0.1 ha cropland in China per person, world average 0.2 ha/person and US has 0.53 ha/person.
- Rising yields helped but now growing problem of land degradation through pollution, desertification, salinity, soil erosion, etc.
- Also land lost to farm production through rapid urban growth – often the best land too.
- Find farm yields suffer near to big urban centres in coastal China (labour siphoned off) and cities are spreading.
- Even peripheral provinces like Yunnan facing rapid urban growth that will cut the amount of land left for growing crops.
Conclusion
- Very mixed outcome of FTA for Australian farm sector – dairy, meat, fruit all did well but sugar, cotton, canola and wheat got very little.
- This pattern reflects Chinese government priorities, sensitivities and policies – food security for basic grains and canola, political sensitivities in cotton and sugar growing regions and a wish to boost farm incomes.
- Existing farm system increasingly problematic:
- Causing distortions – above world prices leading to stockpiling of excess output and imports, penalising consumers and downstream users.
- Diet increasingly shifting away from grain basis toward protein and food – how relevant is rice-wheat based food security for many Chinese?
- Resource constraints biting – pressure on land and water supplies.
- Some modest reforms to scheme (freeze support prices, pilot income support arrangements) but the real problems remain.
- Could offer us scope for more gains when FTA reviewed.
Contact details
Tom Taylor
NAB
c/- Lloyd.M.Neilson@nab.com.au
Important information
DISCLAIMER: “[While care has been taken in preparing this material,] National Australia Bank Limited (ABN 12 004 044 937) does not warrant or represent that the information, recommendations, opinions or conclusions contained in this document (“Information”) are accurate, reliable, complete or current. The Information has been prepared for dissemination to professional investors for information purposes only and any statements as to past performance do not represent future performance.
The Information does not purport to contain all matters relevant to any particular investment or financial instrument and all statements as to future matters are not guaranteed to be accurate. In all cases, anyone proposing to rely on or use the Information should independently verify and check the accuracy, completeness, reliability and suitability of the Information and should obtain independent and specific advice from appropriate professionals or experts.
To the extent permissible by law, the National shall not be liable for any errors, omissions, defects or misrepresentations in the Information or for any loss or damage suffered by persons who use or rely on such Information (including by reasons of negligence, negligent misstatement or otherwise). If any law prohibits the exclusion of such liability, the National limits its liability to the re-supply of the Information, provided that such limitation is permitted by law and is fair and reasonable. The National, its affiliates and employees may hold a position or act as a price maker in the financial instruments of any issuer discussed within this document or act as an underwriter, placement agent, adviser or lender to such issuer.”
Was this page helpful?
YOUR FEEDBACK