Farming and the numbers - what farmers should know about the economy
Author: Saul Eslake (Economist) | Date: 31 Aug 2015
Take home messages
- Australia’s ‘resources boom’ is rapidly fading away.
- A lower A$ is now helping, in particular tourism, but will also provide a boost to other sectors including agriculture.
- The Reserve Bank won’t cut interest rates any further – but they will remain low by historical standards for a long time.
- Rapid growth and rising living standards in Asian economies presents enormous opportunities for Australian agriculture, but Australian agriculture needs to attract capital and boost productivity to capture them.
The global economy
The major ‘advanced’ economies are recovering – at differing rates – from the financial crisis of 2008-09.
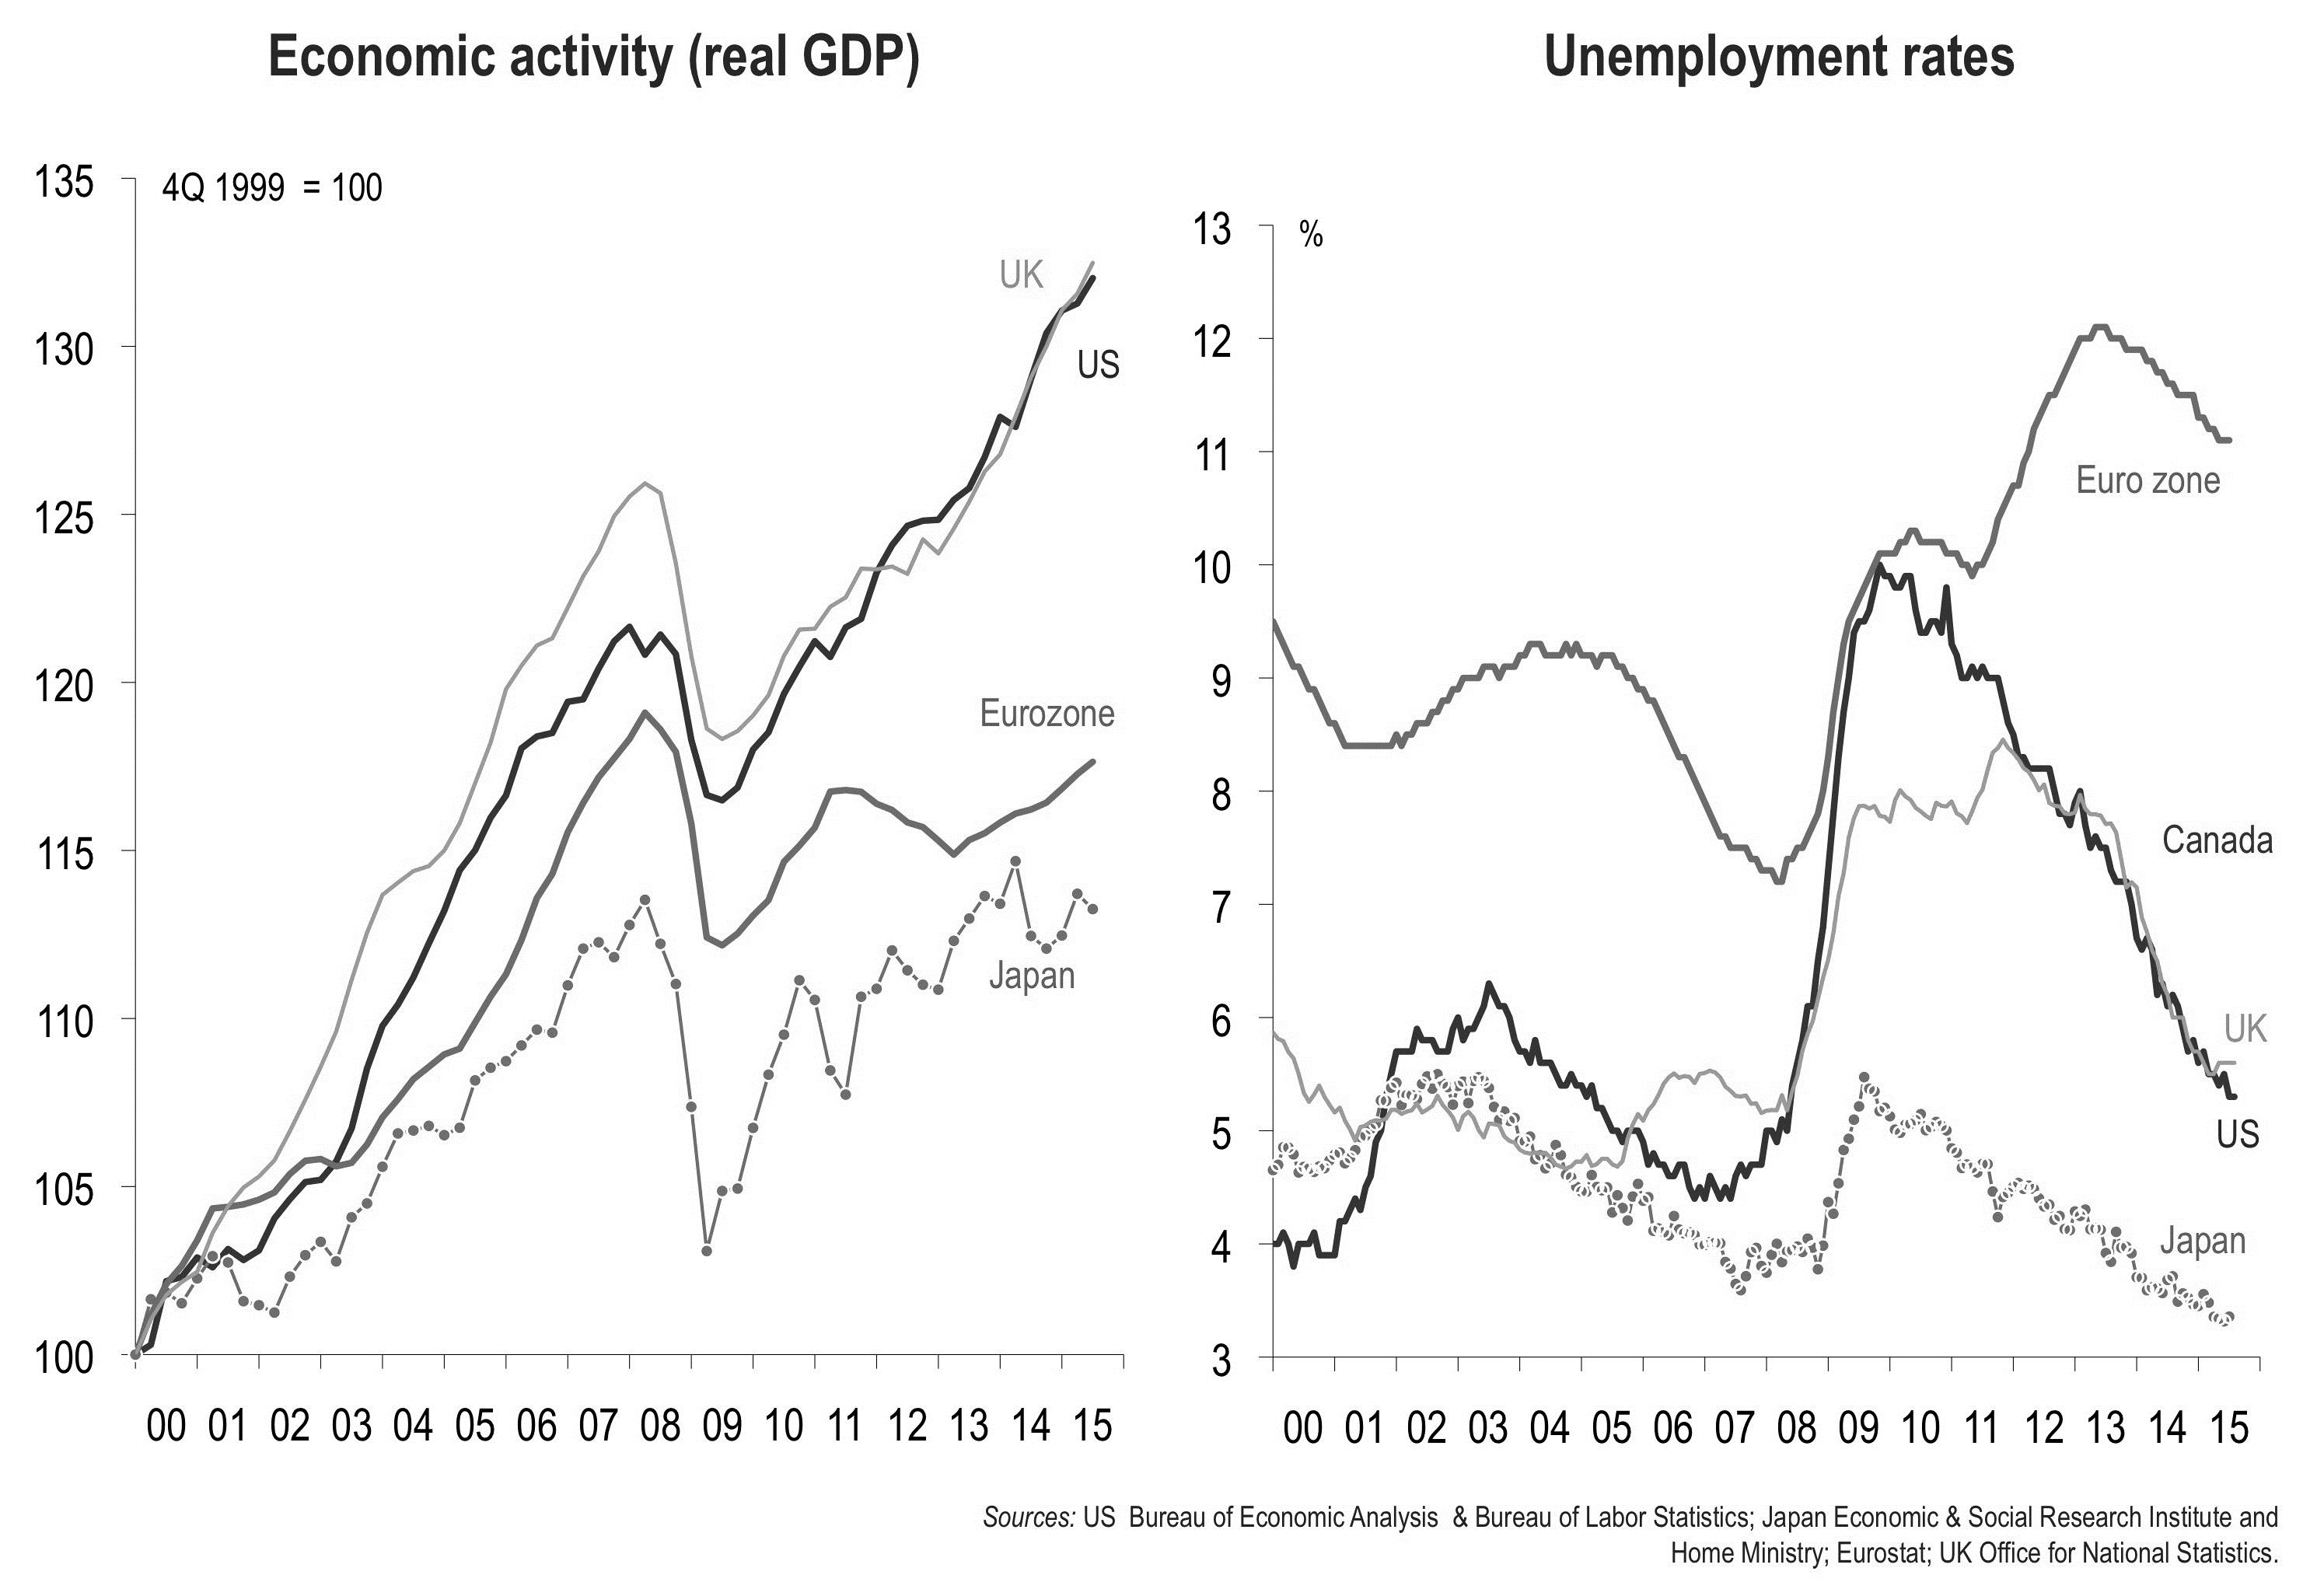
Figure 1(a): Economic activity for the major ‘advanced’ economies (2000-2015). (b): Unemployment rate for the major ‘advanced’ economies (2000-2015).
The ‘imbalances’ that helped cause the crisis are slowly being unwound.
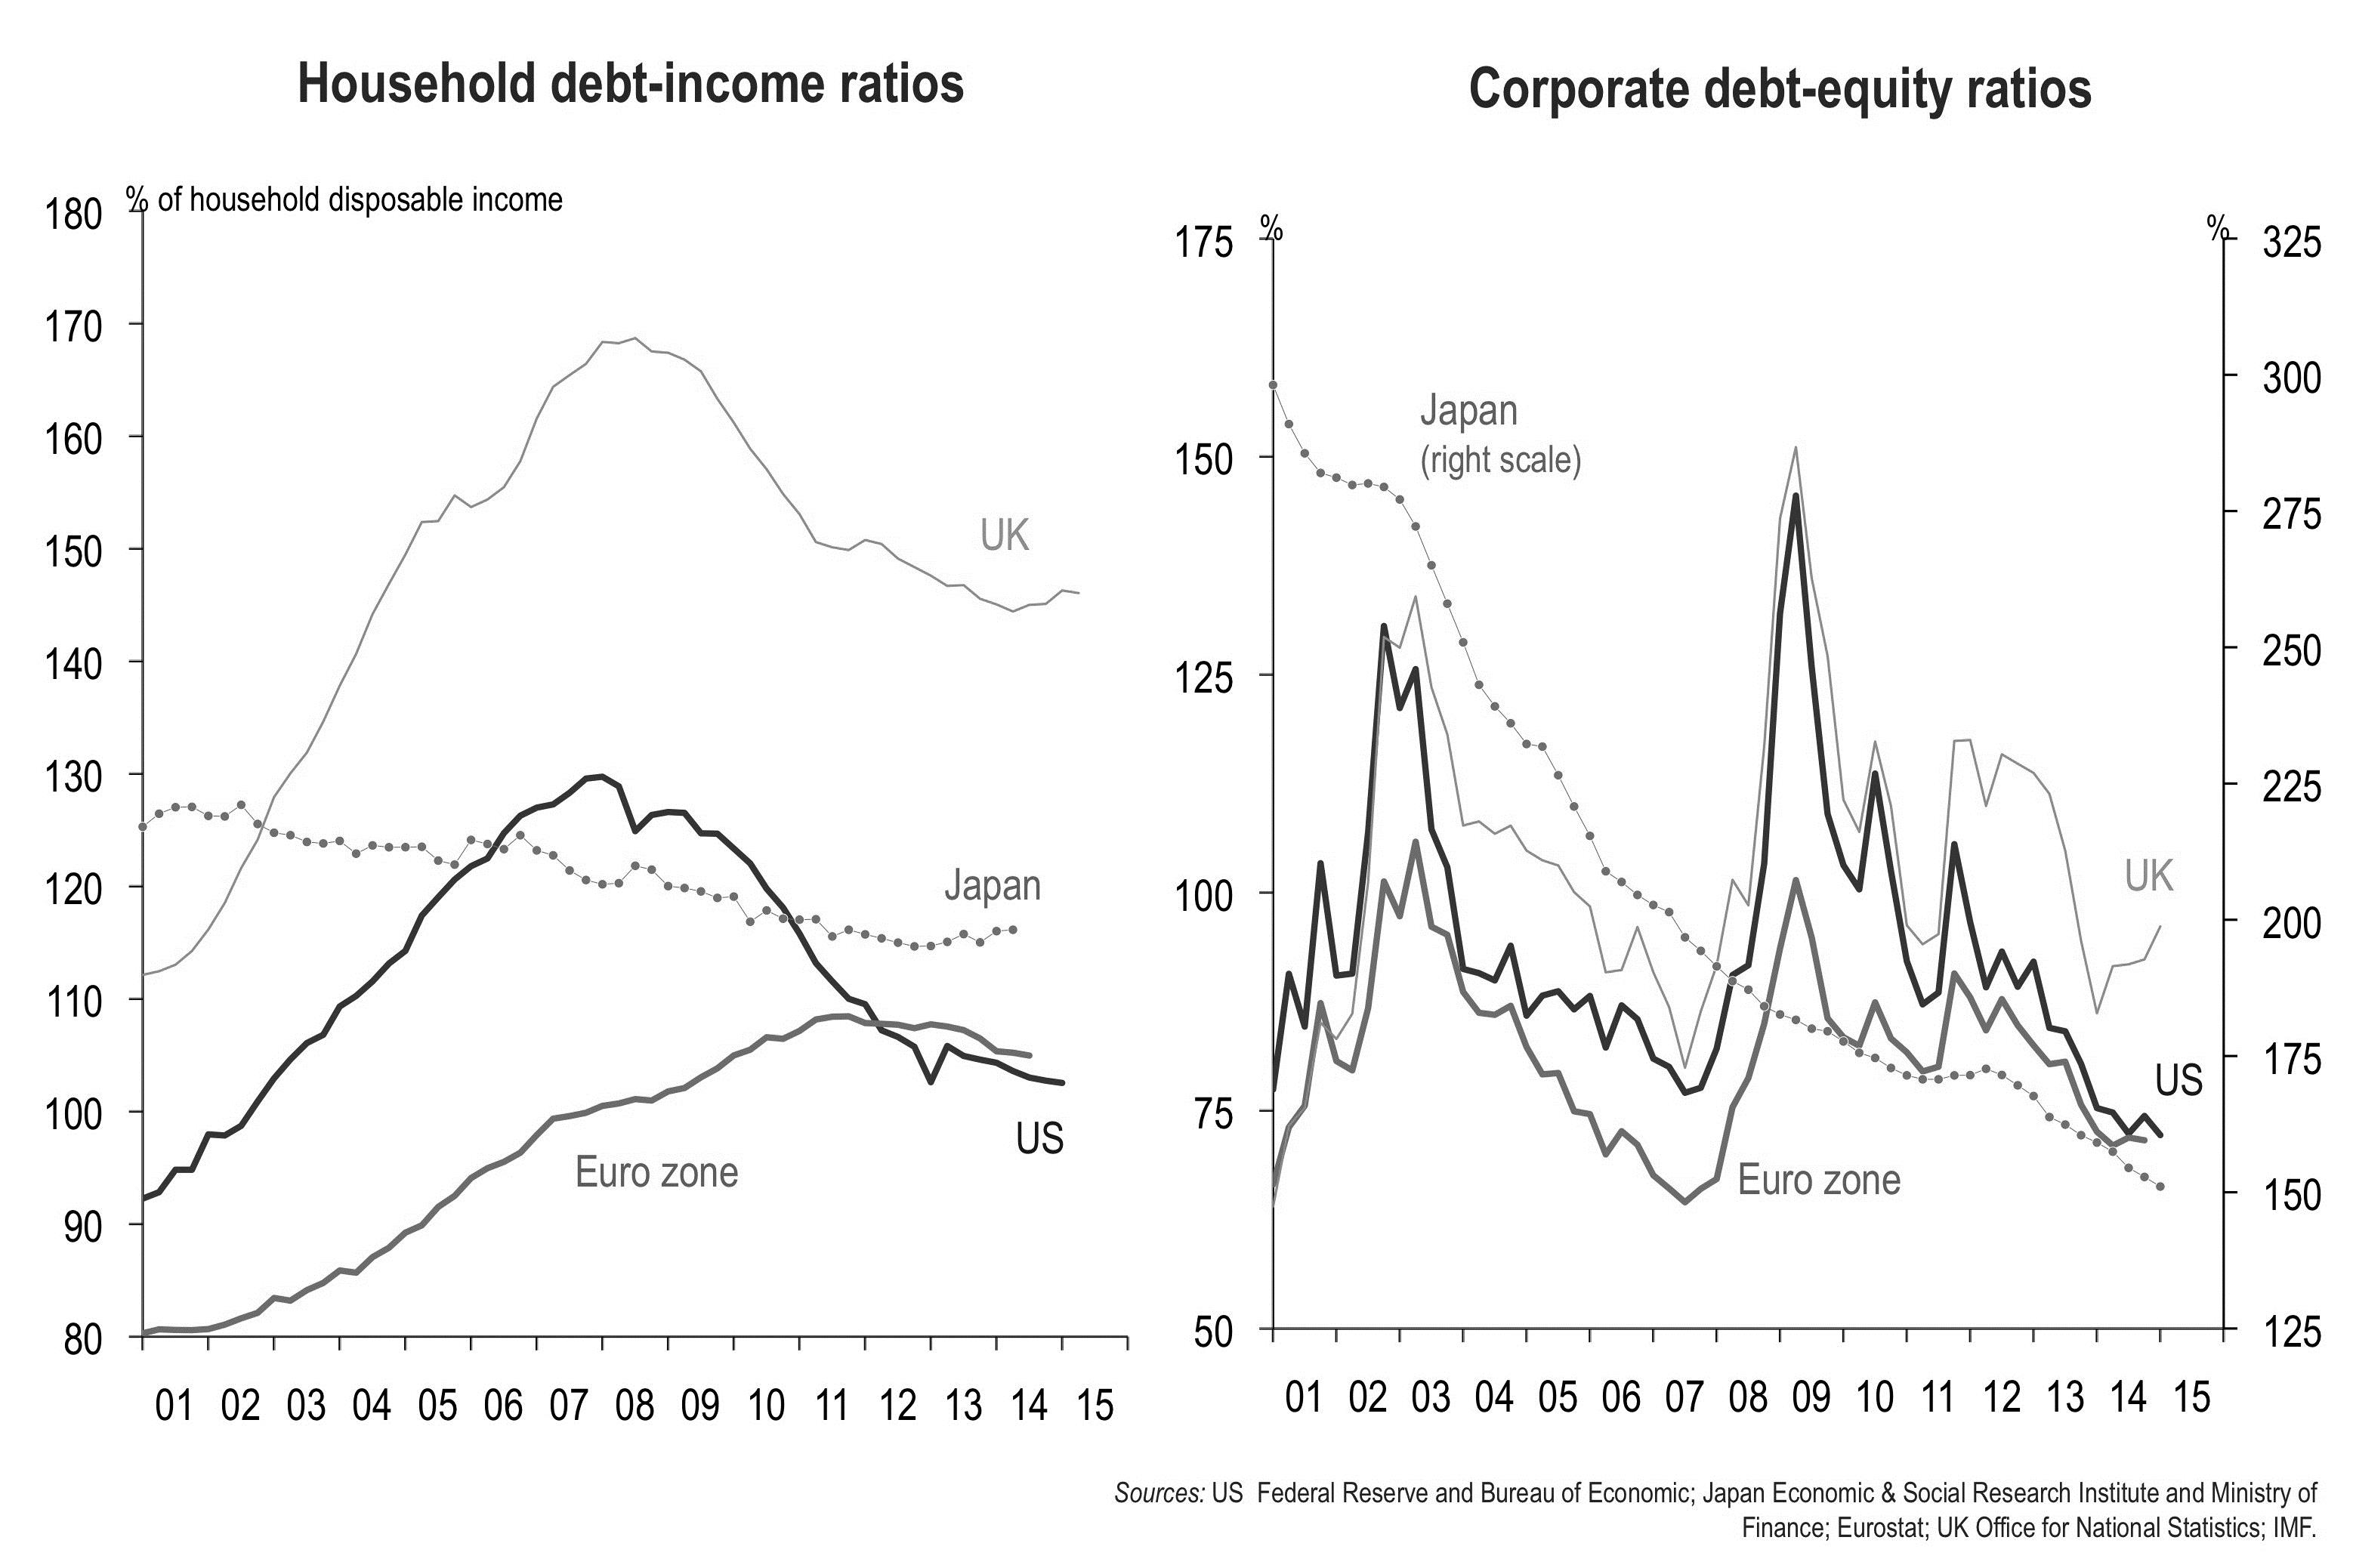
Figure 2(a): Household debt-income ratios. (b): Corporate debt-equity ratios.
Banks have started to lend again (except in the UK).
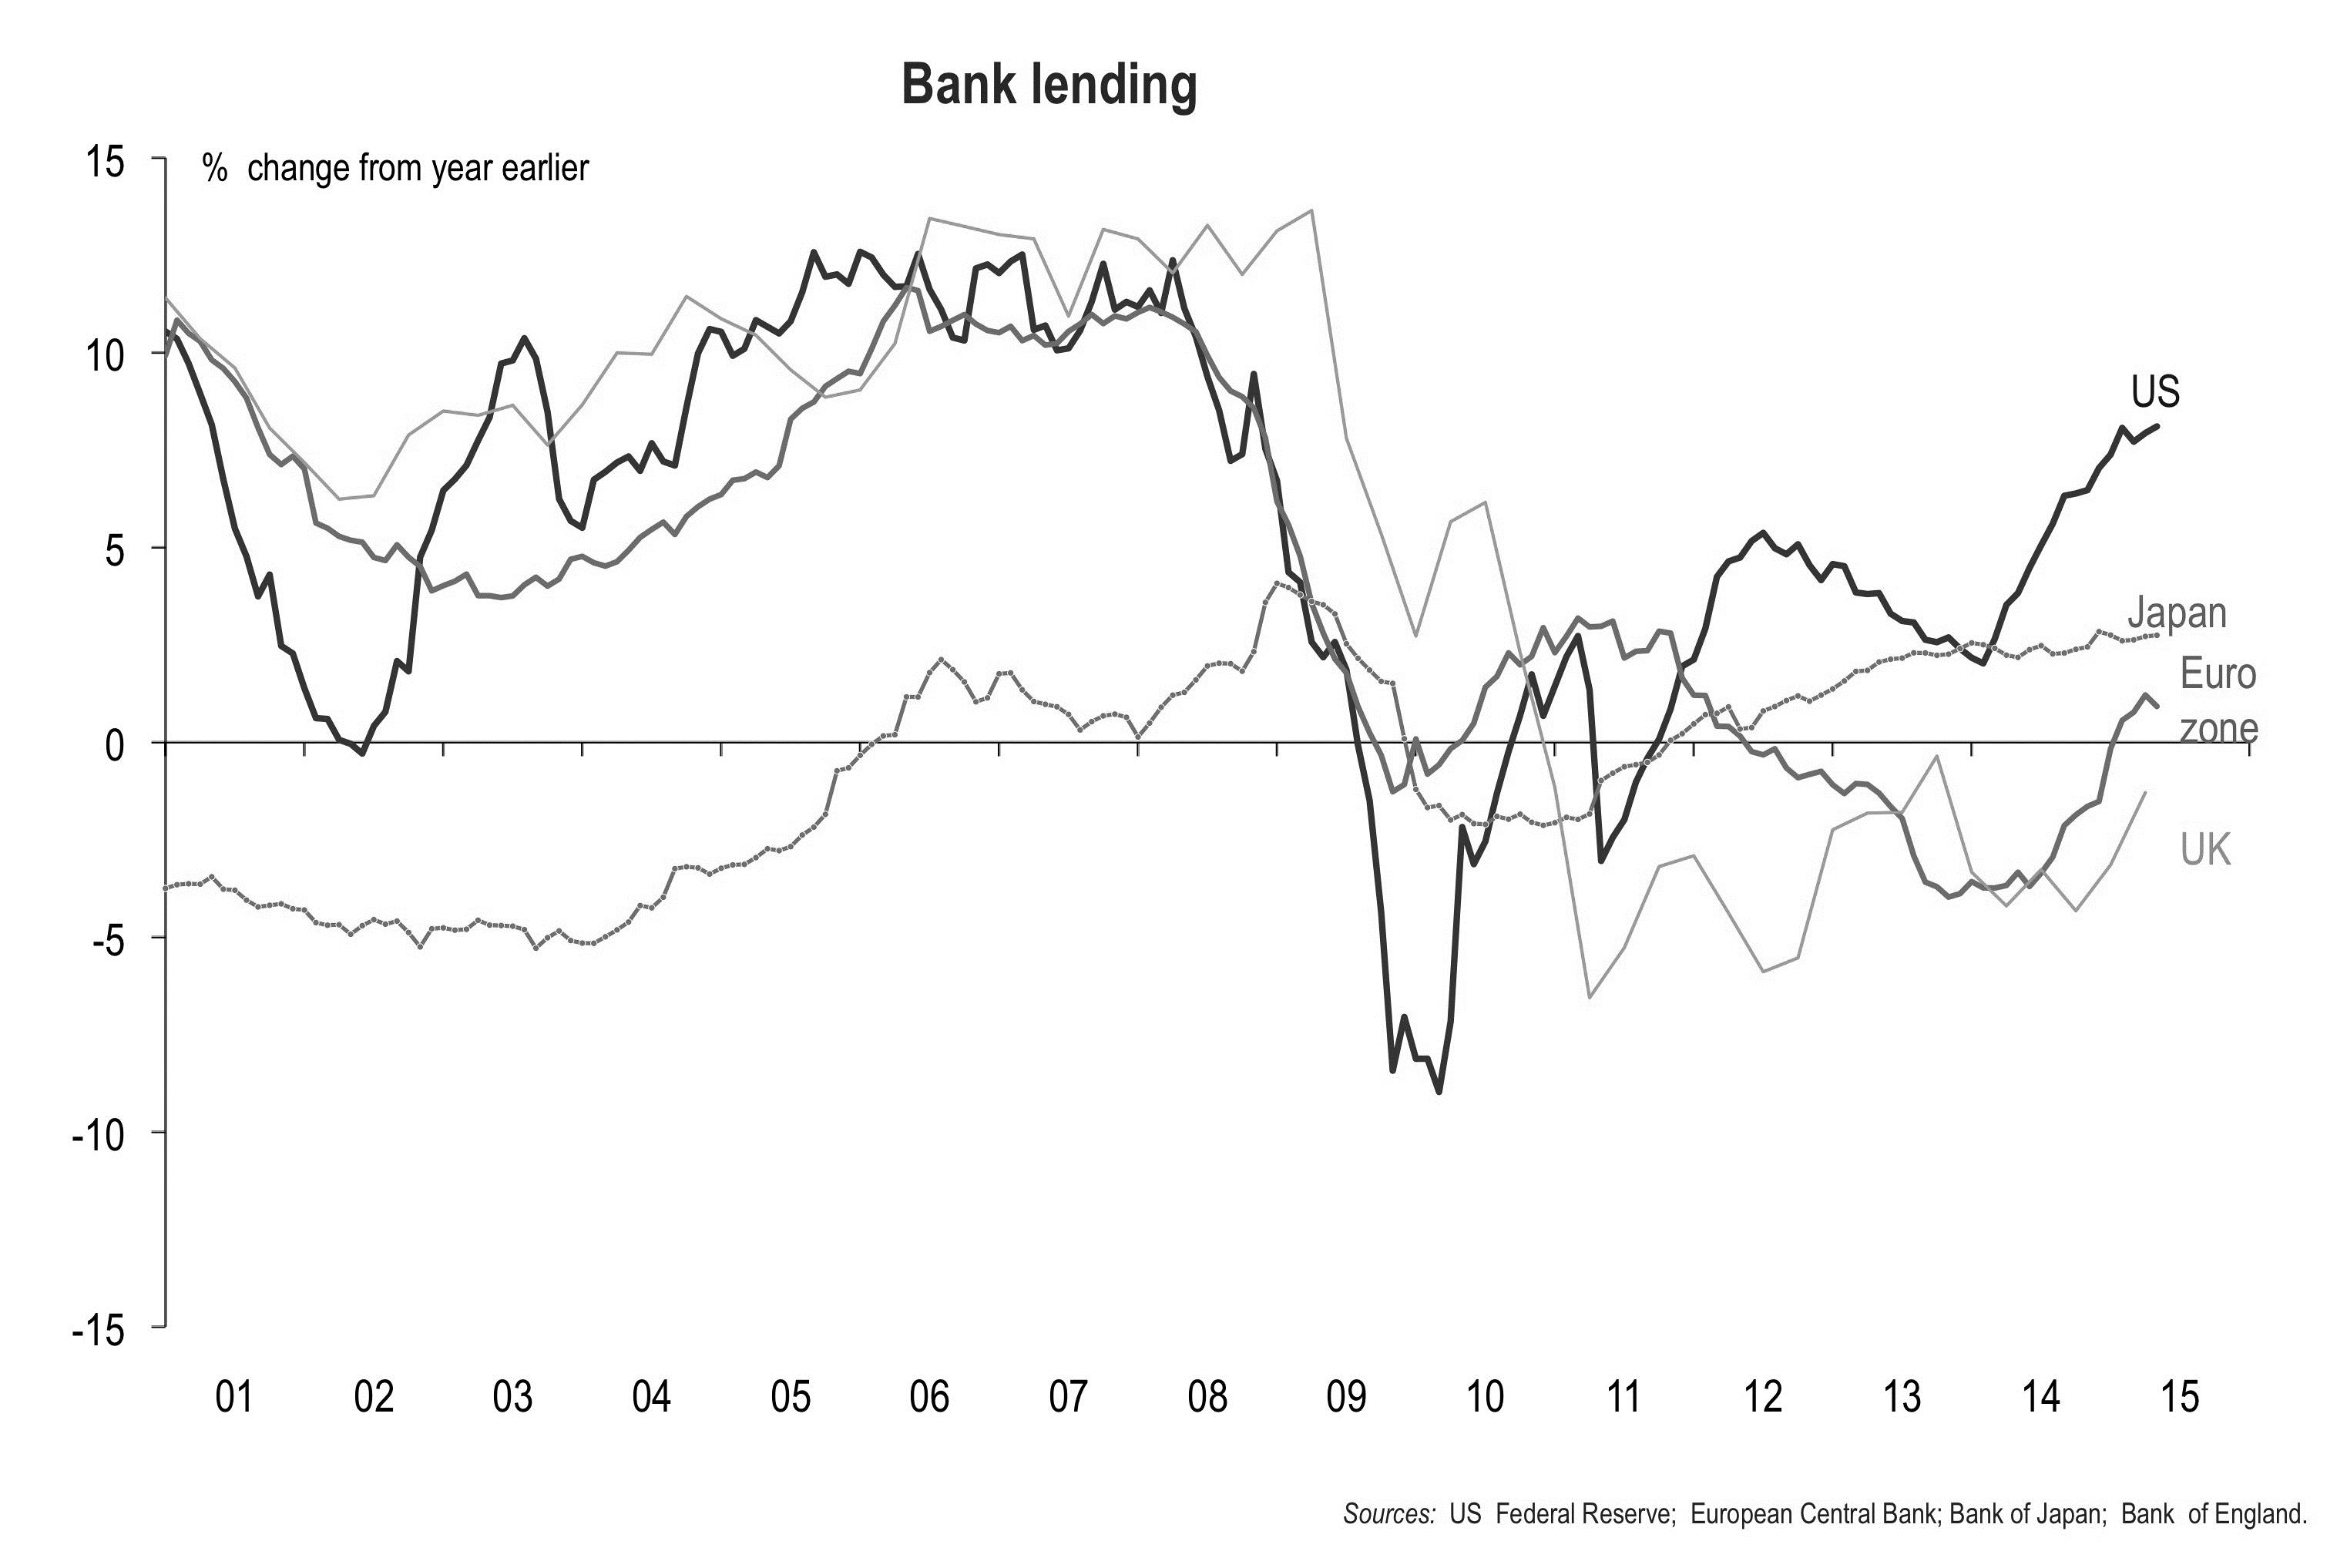
Figure 3: Bank lending for the major ‘advanced’ economies (2000 – 2015).
Inflation remains very low in all of the major ‘advanced’ economies but risks of outright deflation are receding.
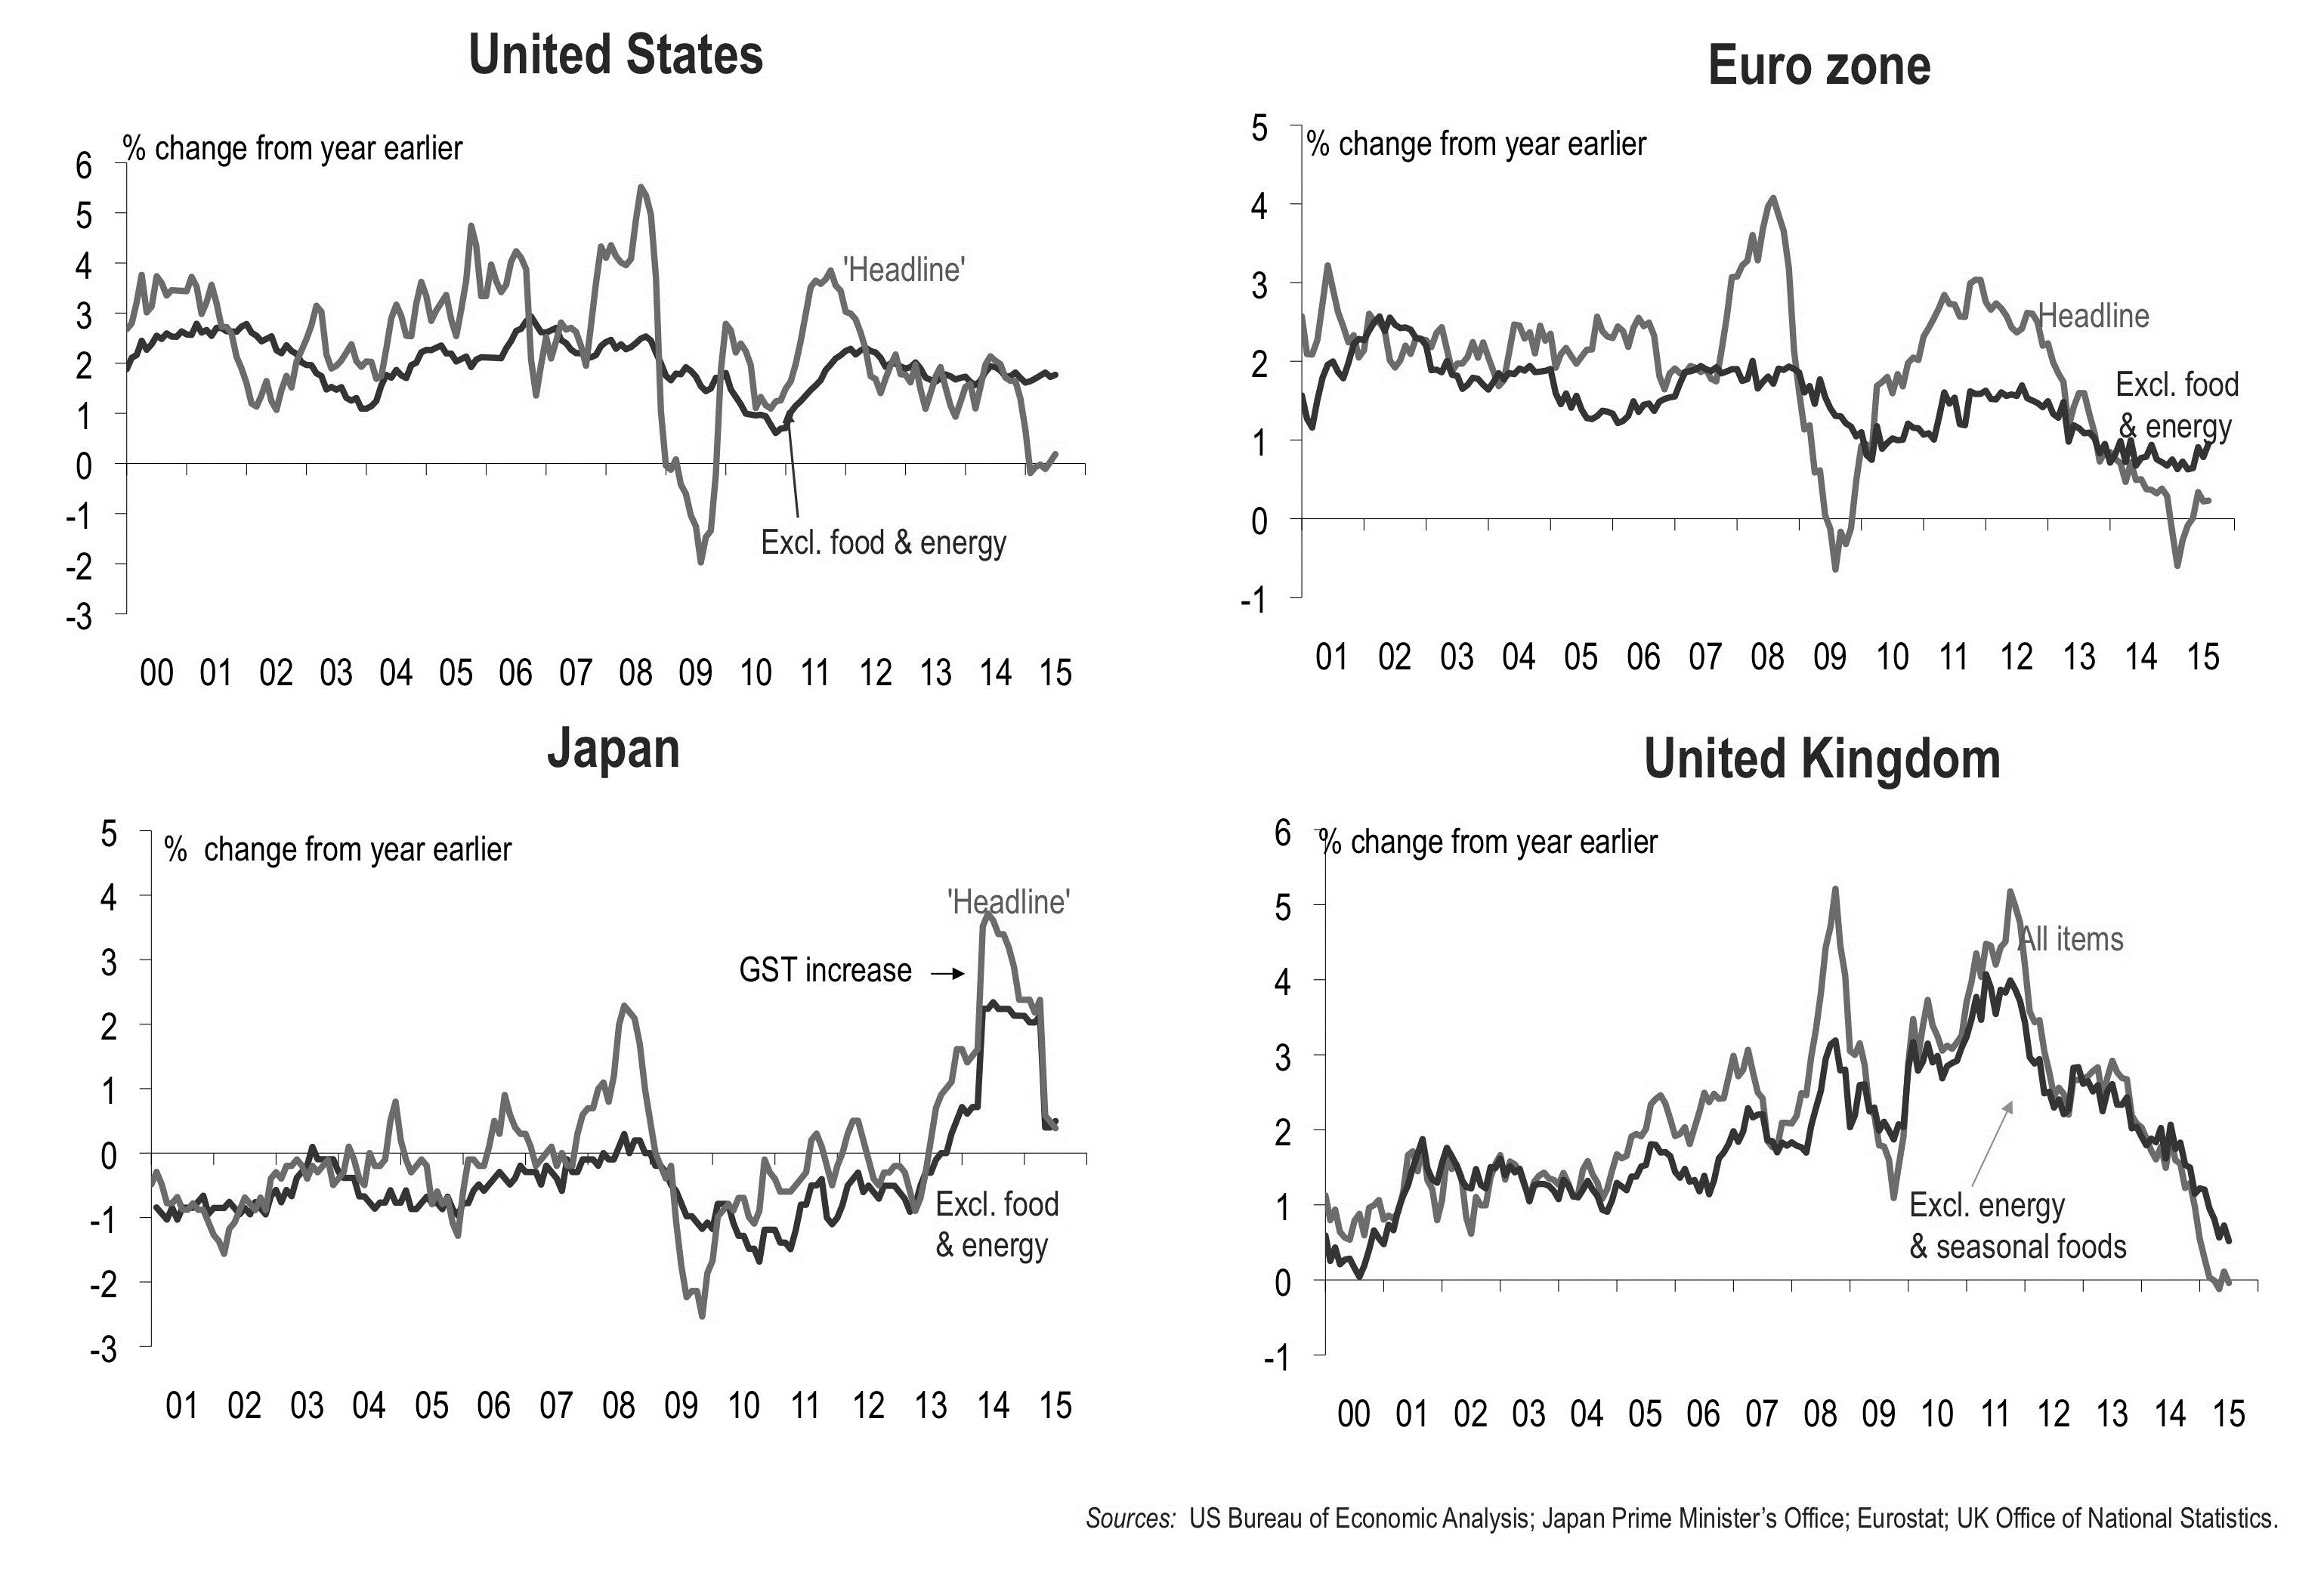
Figure 4: Inflation for the major advanced economies, (a): United States (b): Euro zone (c): Japan and (d): United Kingdom.
With its recovery furthest advanced, the US will be the first to begin returning monetary policy settings towards ‘normal’.
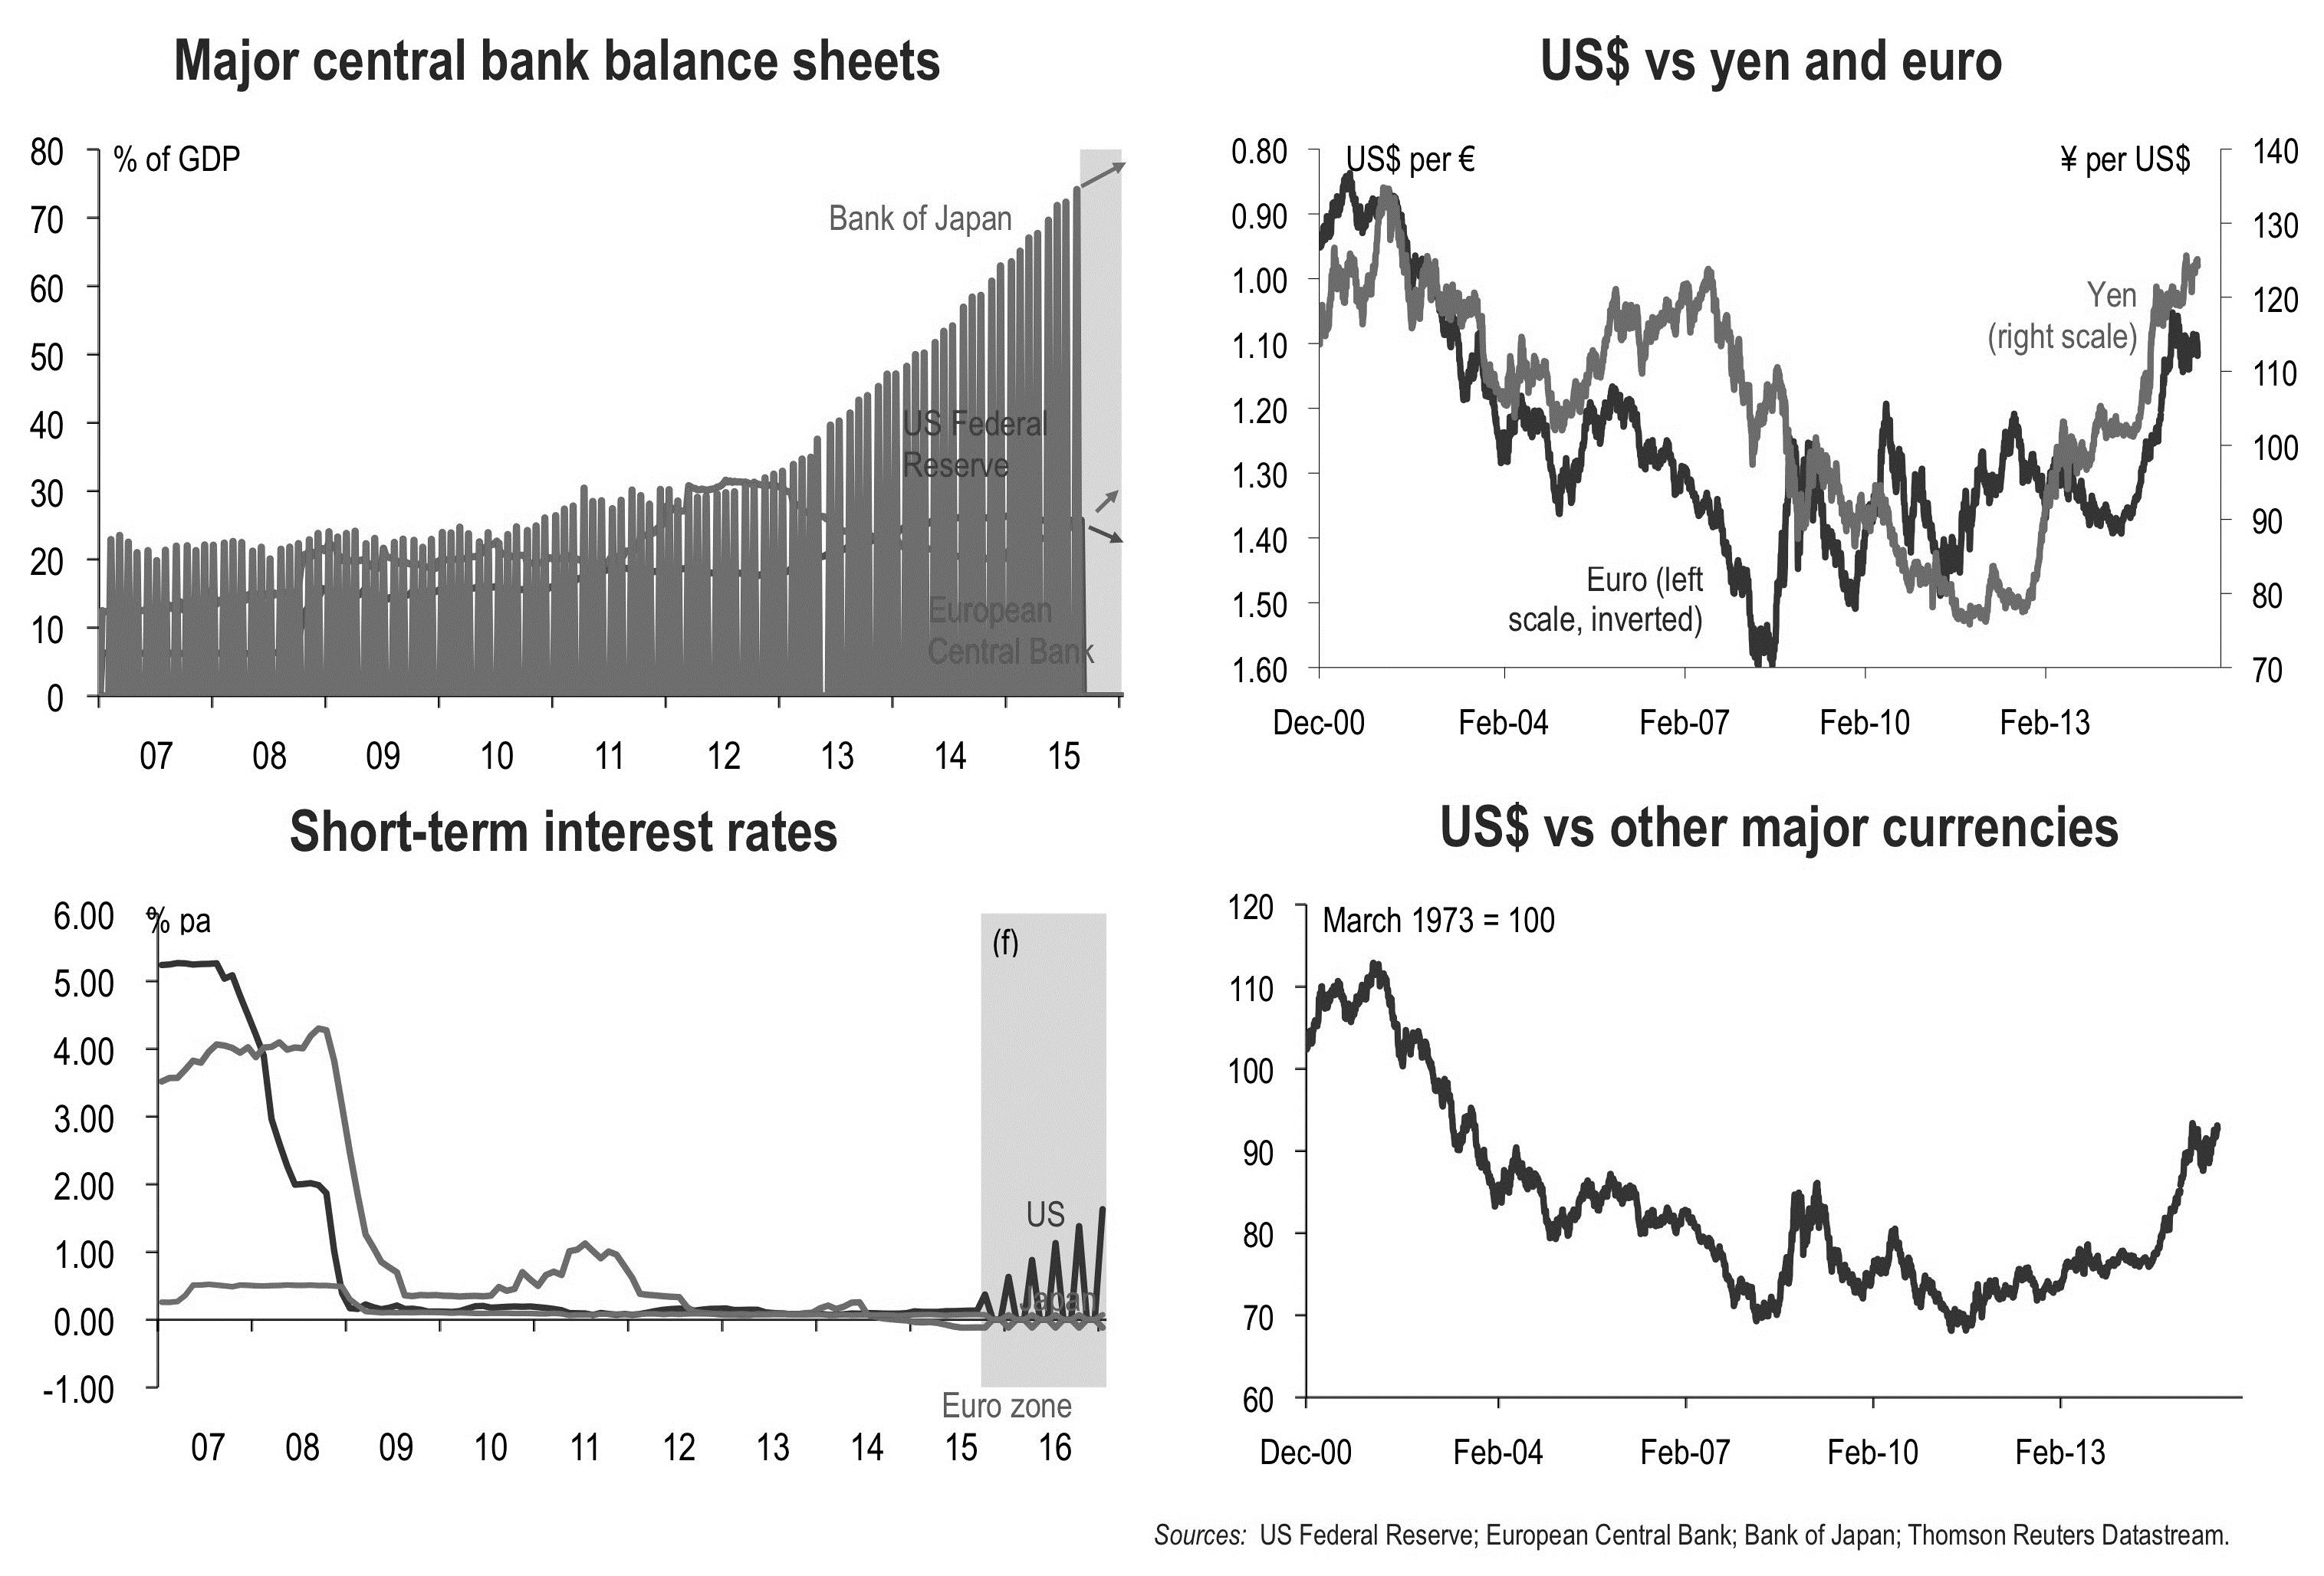
Figure 5: US indicators.
China’s economy is clearly slowing – but there’s no compelling reason to think a sharp downturn is likely any time soon.
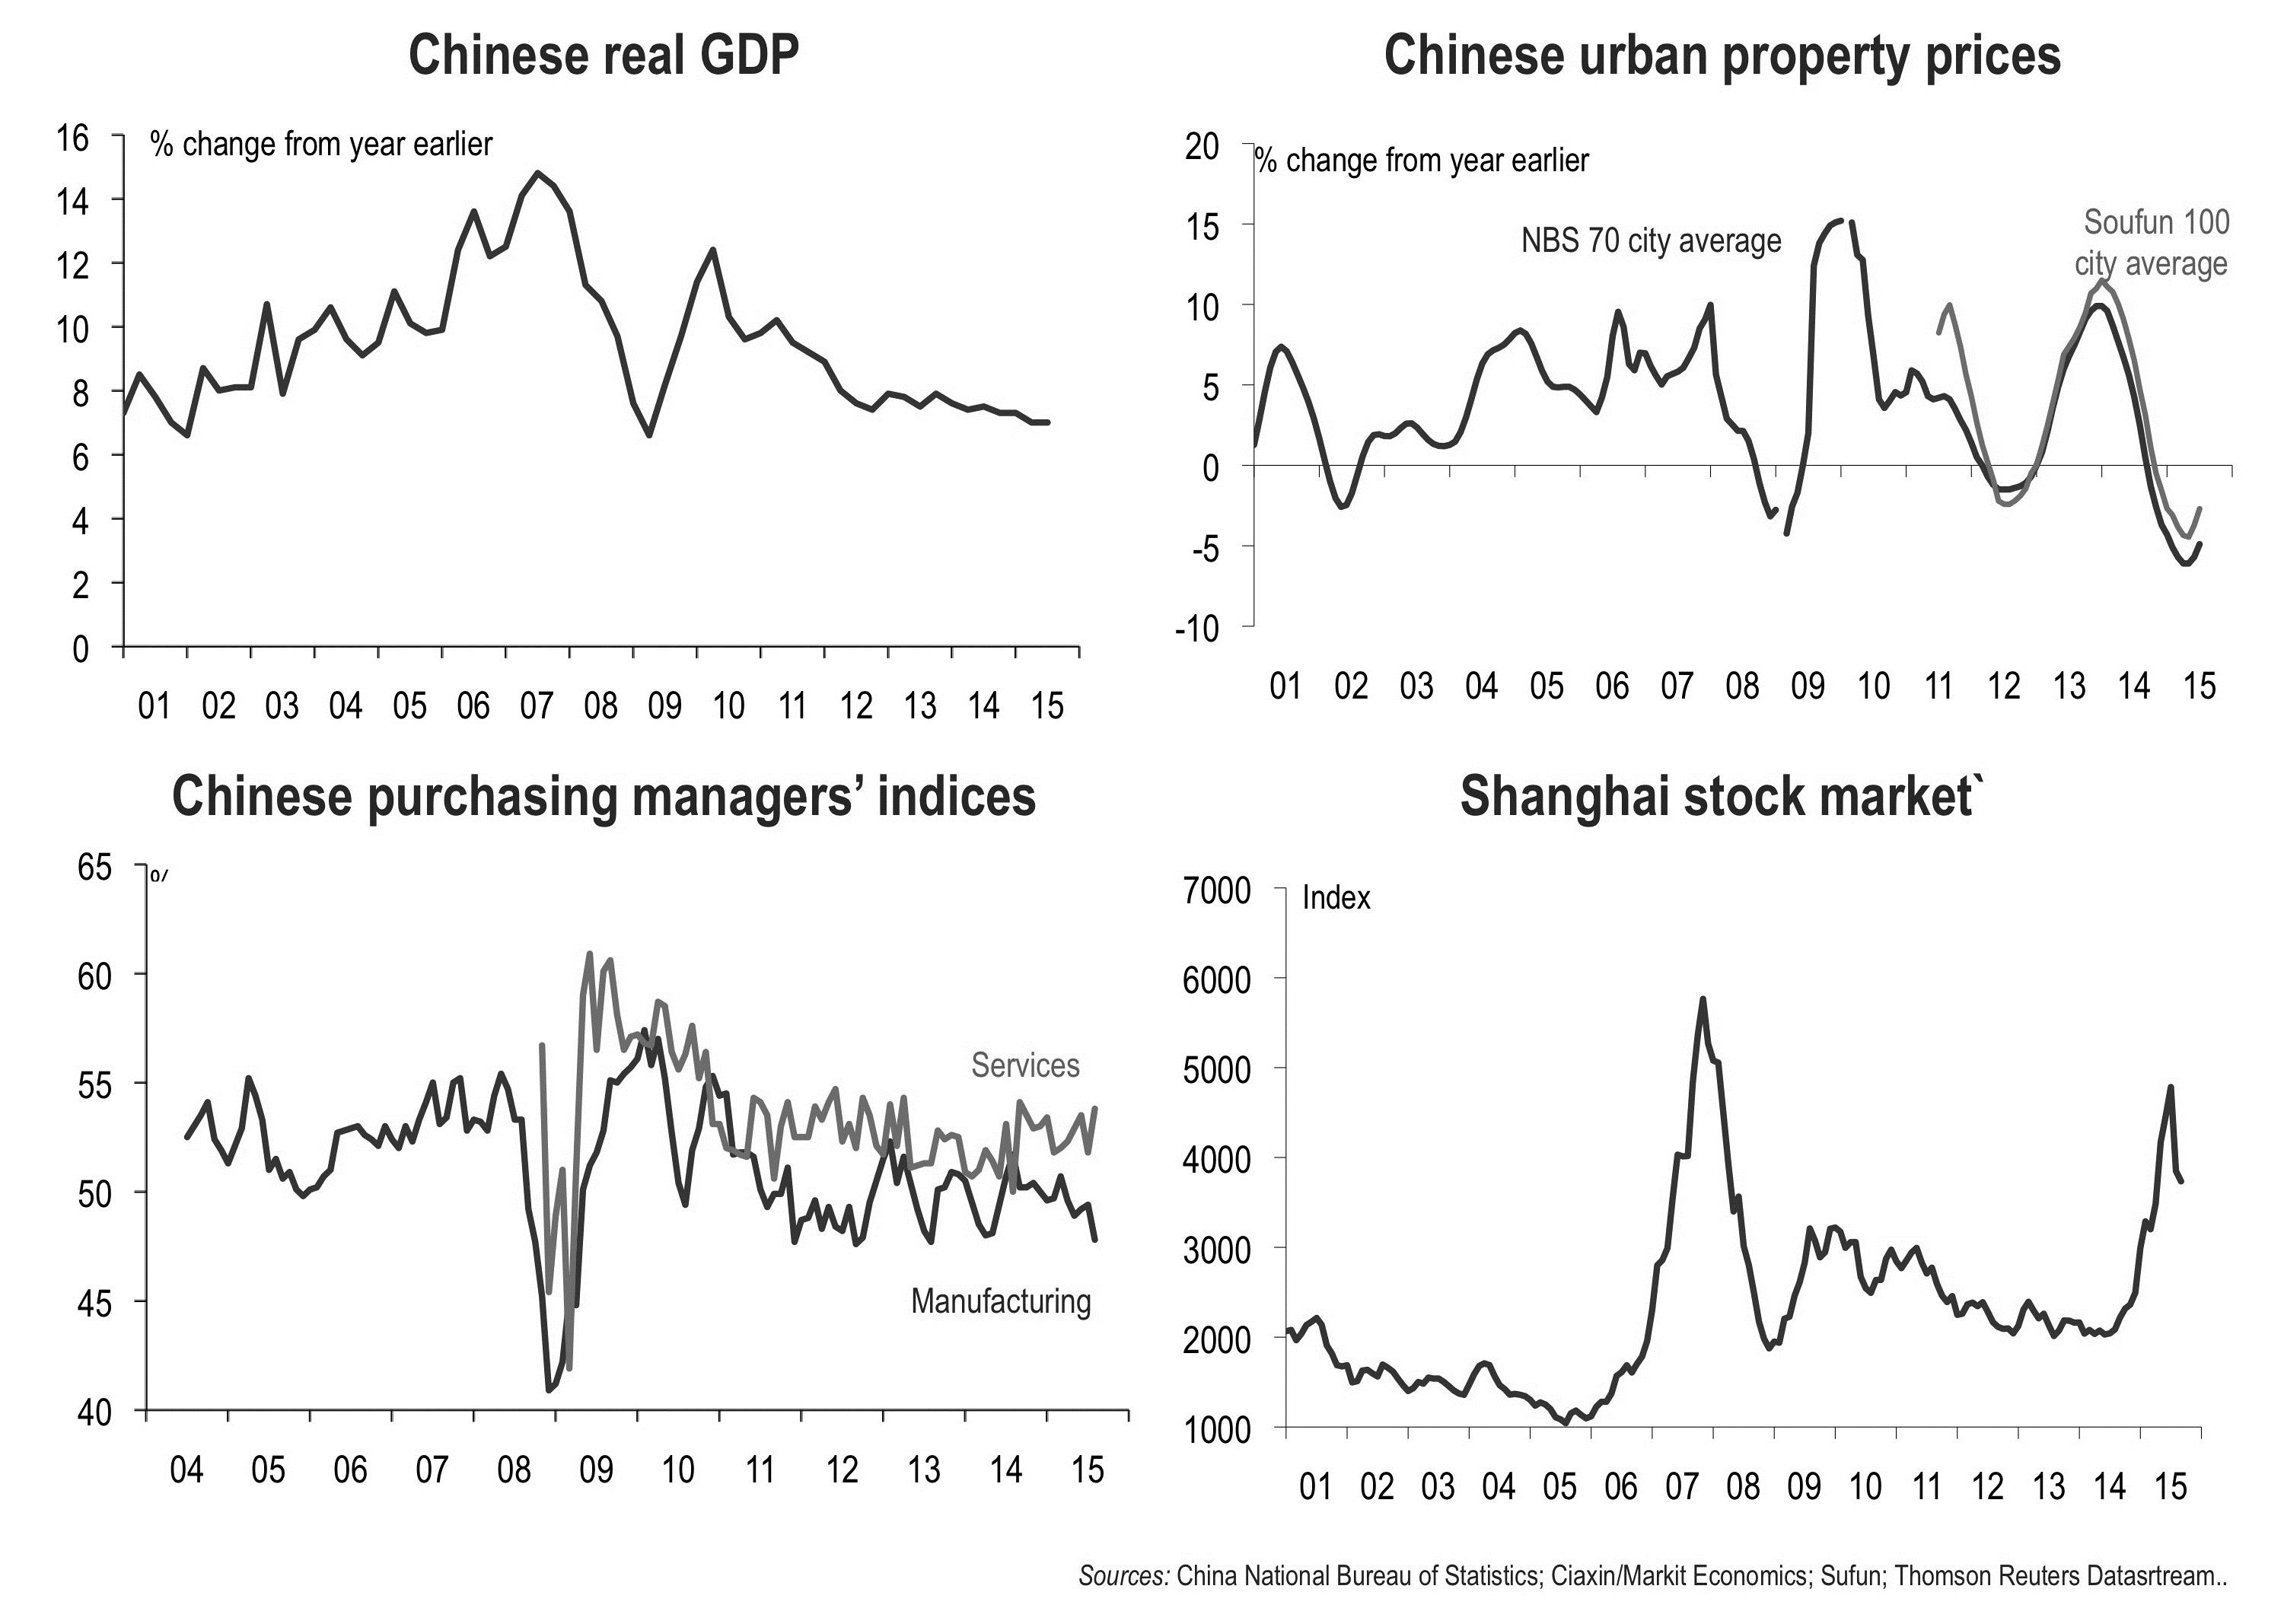
Figure 6: Indicators of China’s economy growth.
China’s slowdown is largely the result of long-term demographic and structural factors.
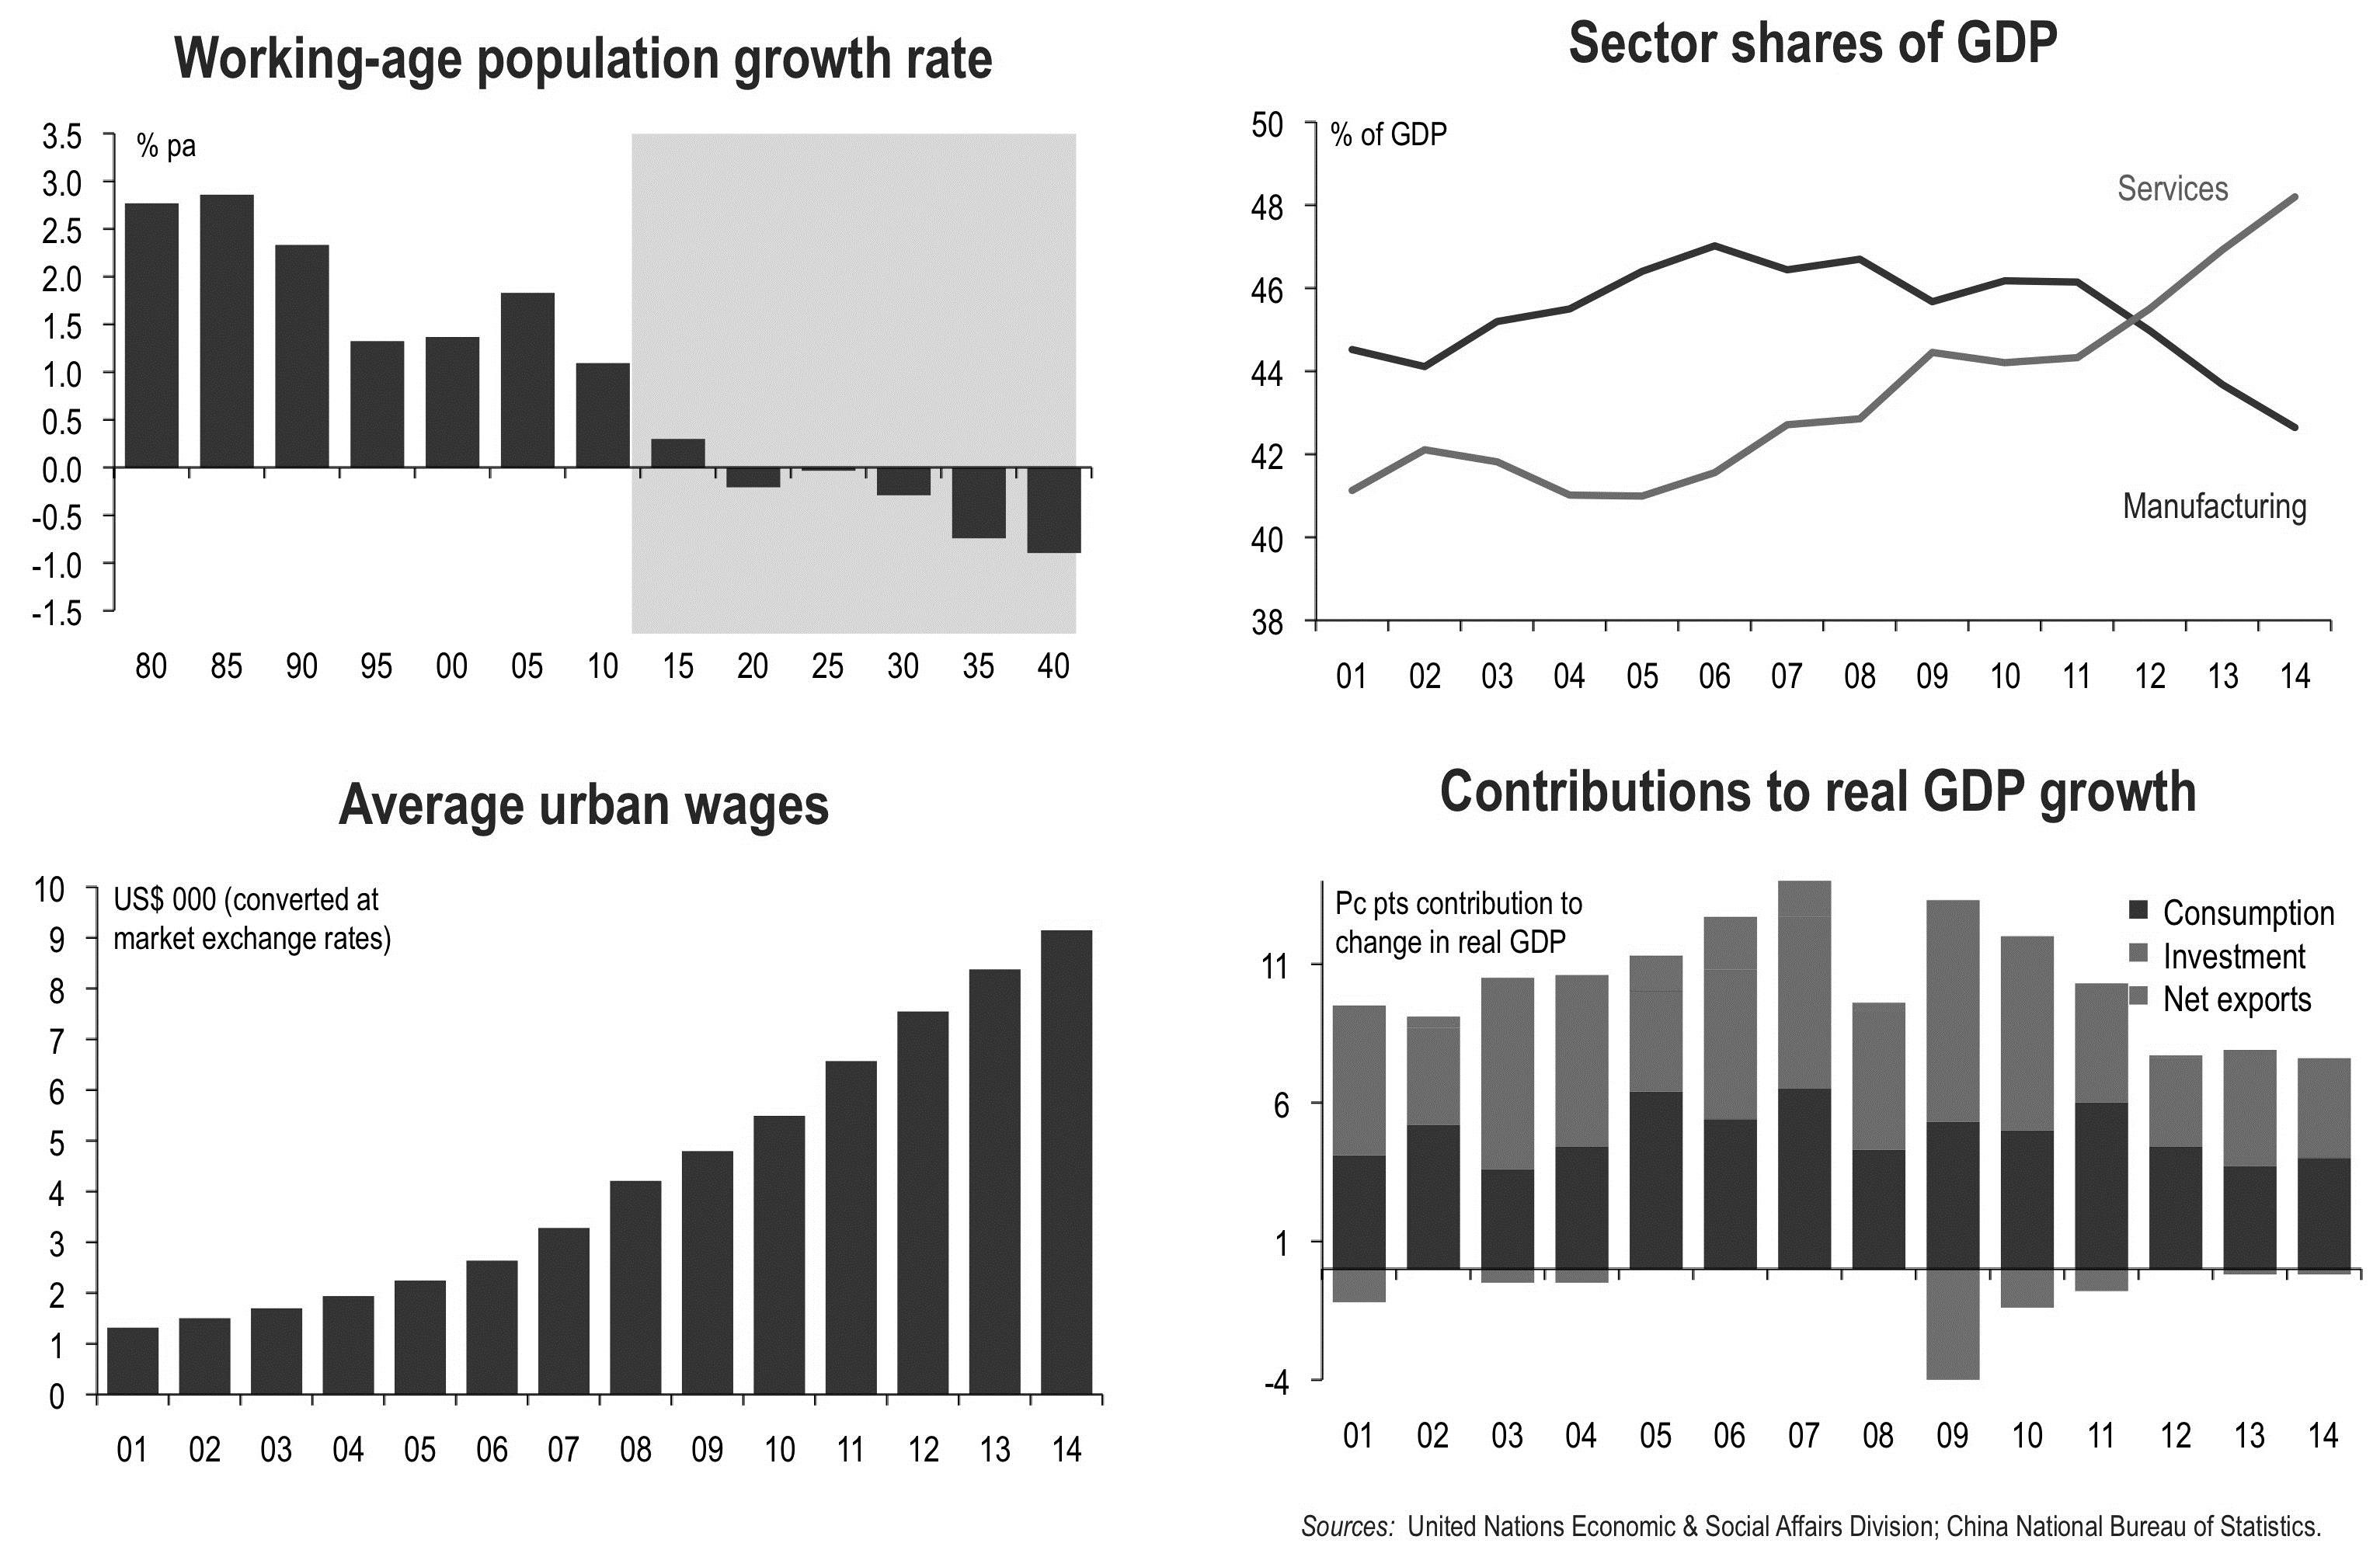
Figure 7: Factors that contribute to China’s slowdown.
China isn’t out to start a ‘currency war’.
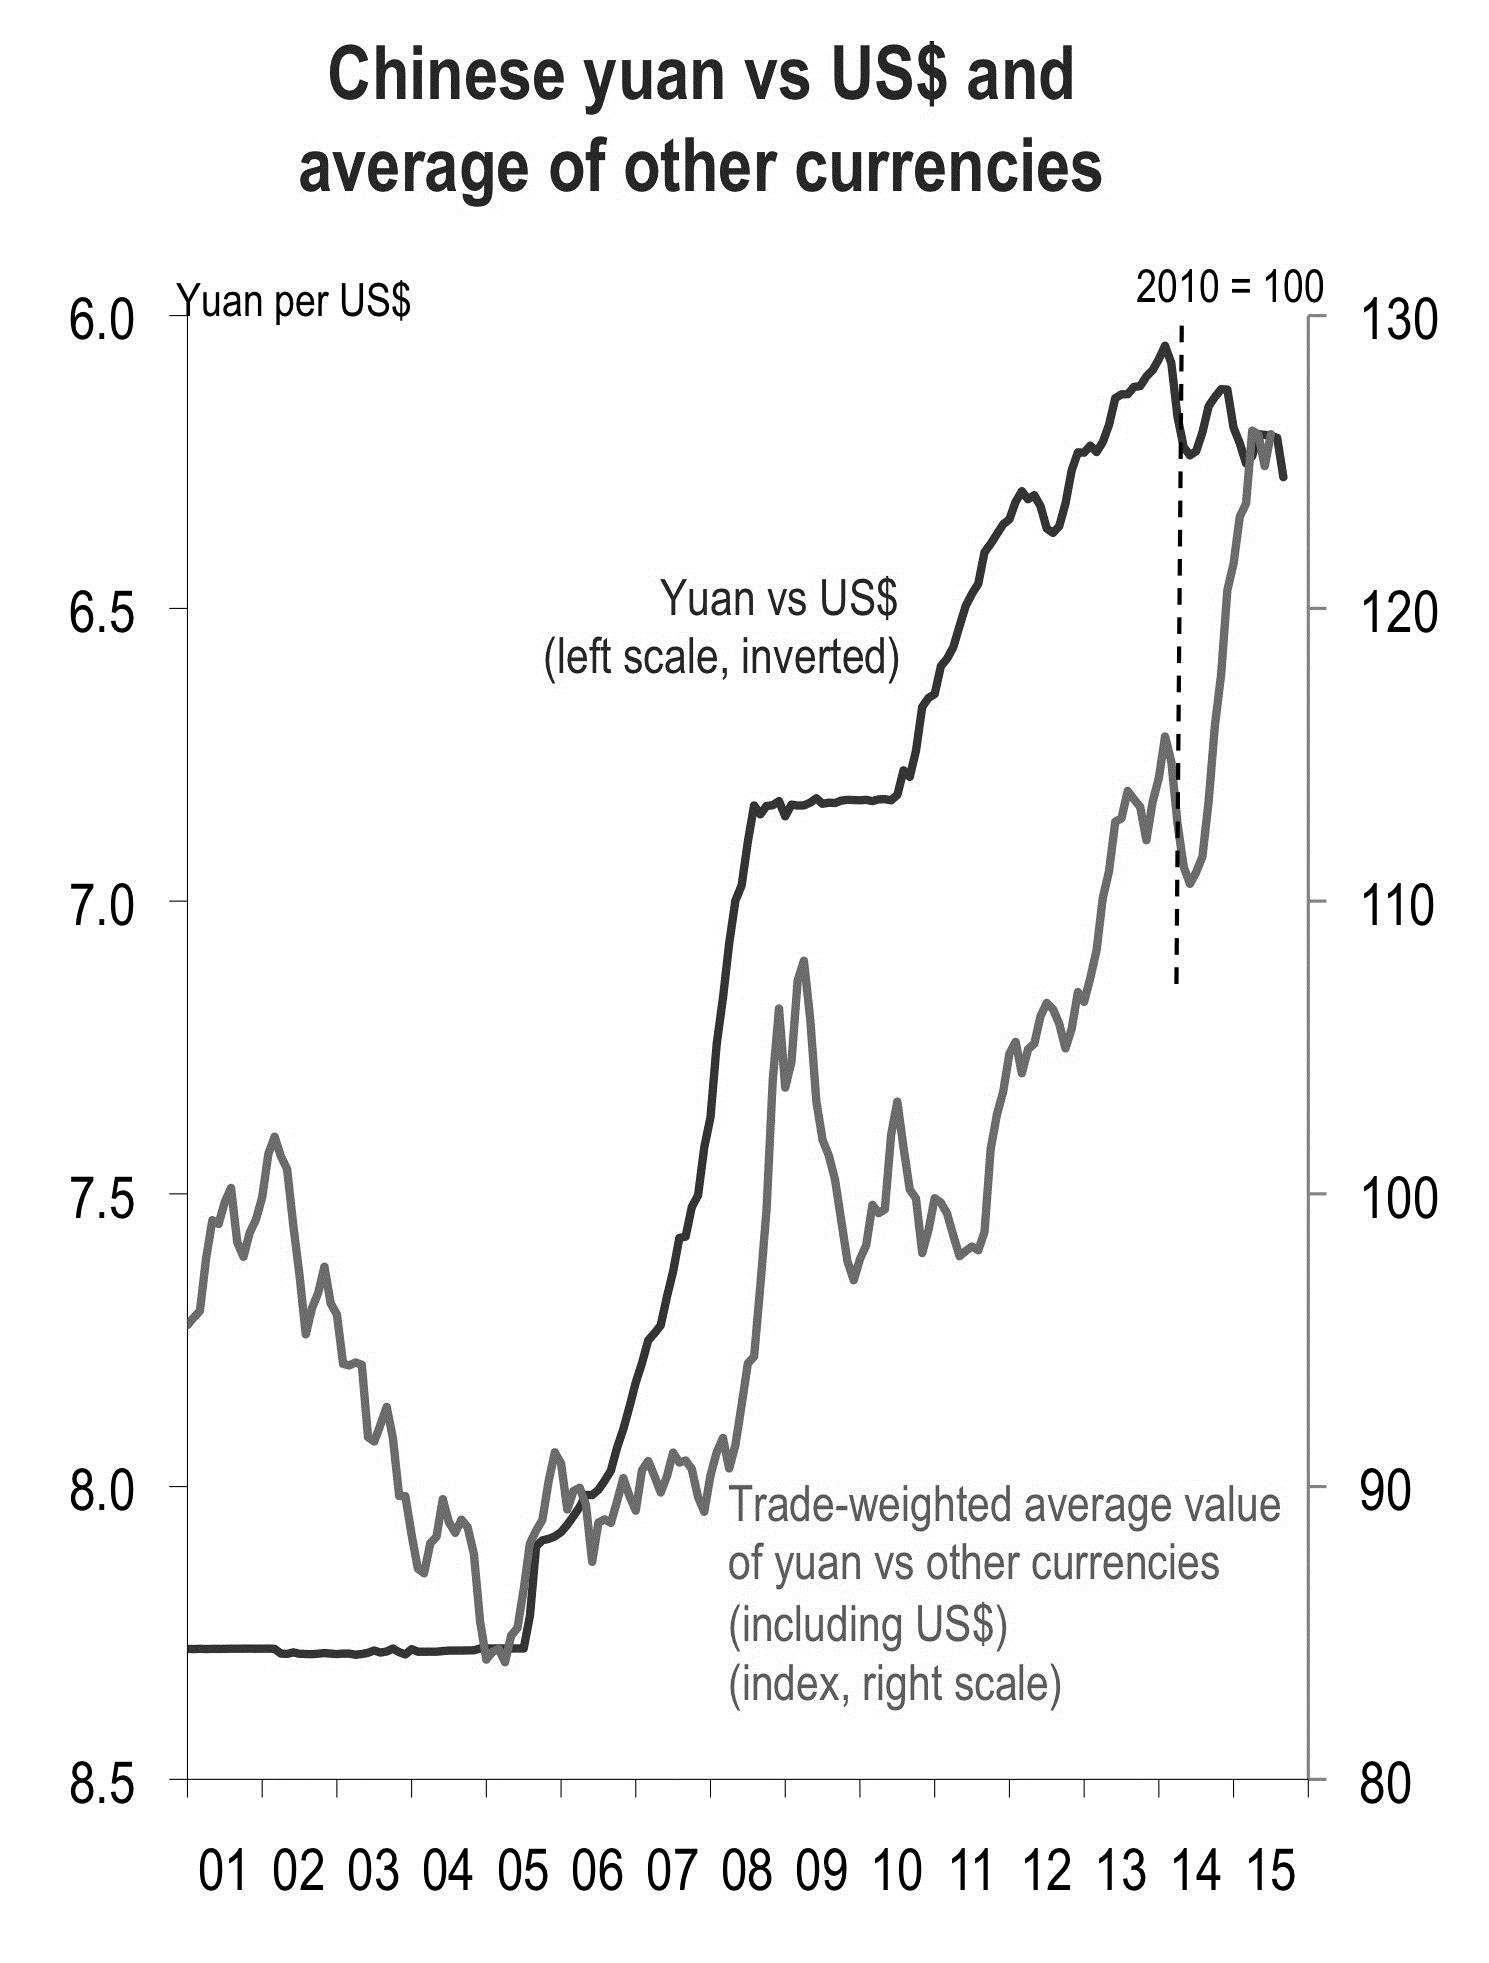
Figure 8: China yuan versus US$ and average of other currencies.
- China’s ‘devaluation’ in mid-August does not signal a significant change in China’s currency policy.
- The ‘devaluation’ was a by-product of a technical change in the way that the People’s Bank of China sets the mid-point of the allowable trading range for the yuan each day.
- If the Chinese authorities had been wanting to use the currency as a stimulus measure, they’d have needed to move it by a lot more than the three per cent by which the yuan fell that week.
- Although the yuan has fallen by about three and a half per cent against the US$ since January last year, because the US$ has risen against most other currencies, the yuan has risen by almost 10 per cent against an average of other currencies.
- The Chinese authorities may have been seeking to prevent the yuan from being dragged up even further against third currencies when the US begins raising interest rates either in September or December.
China’s contribution to growth in the world economy is increasing despite slower growth in its real GDP.
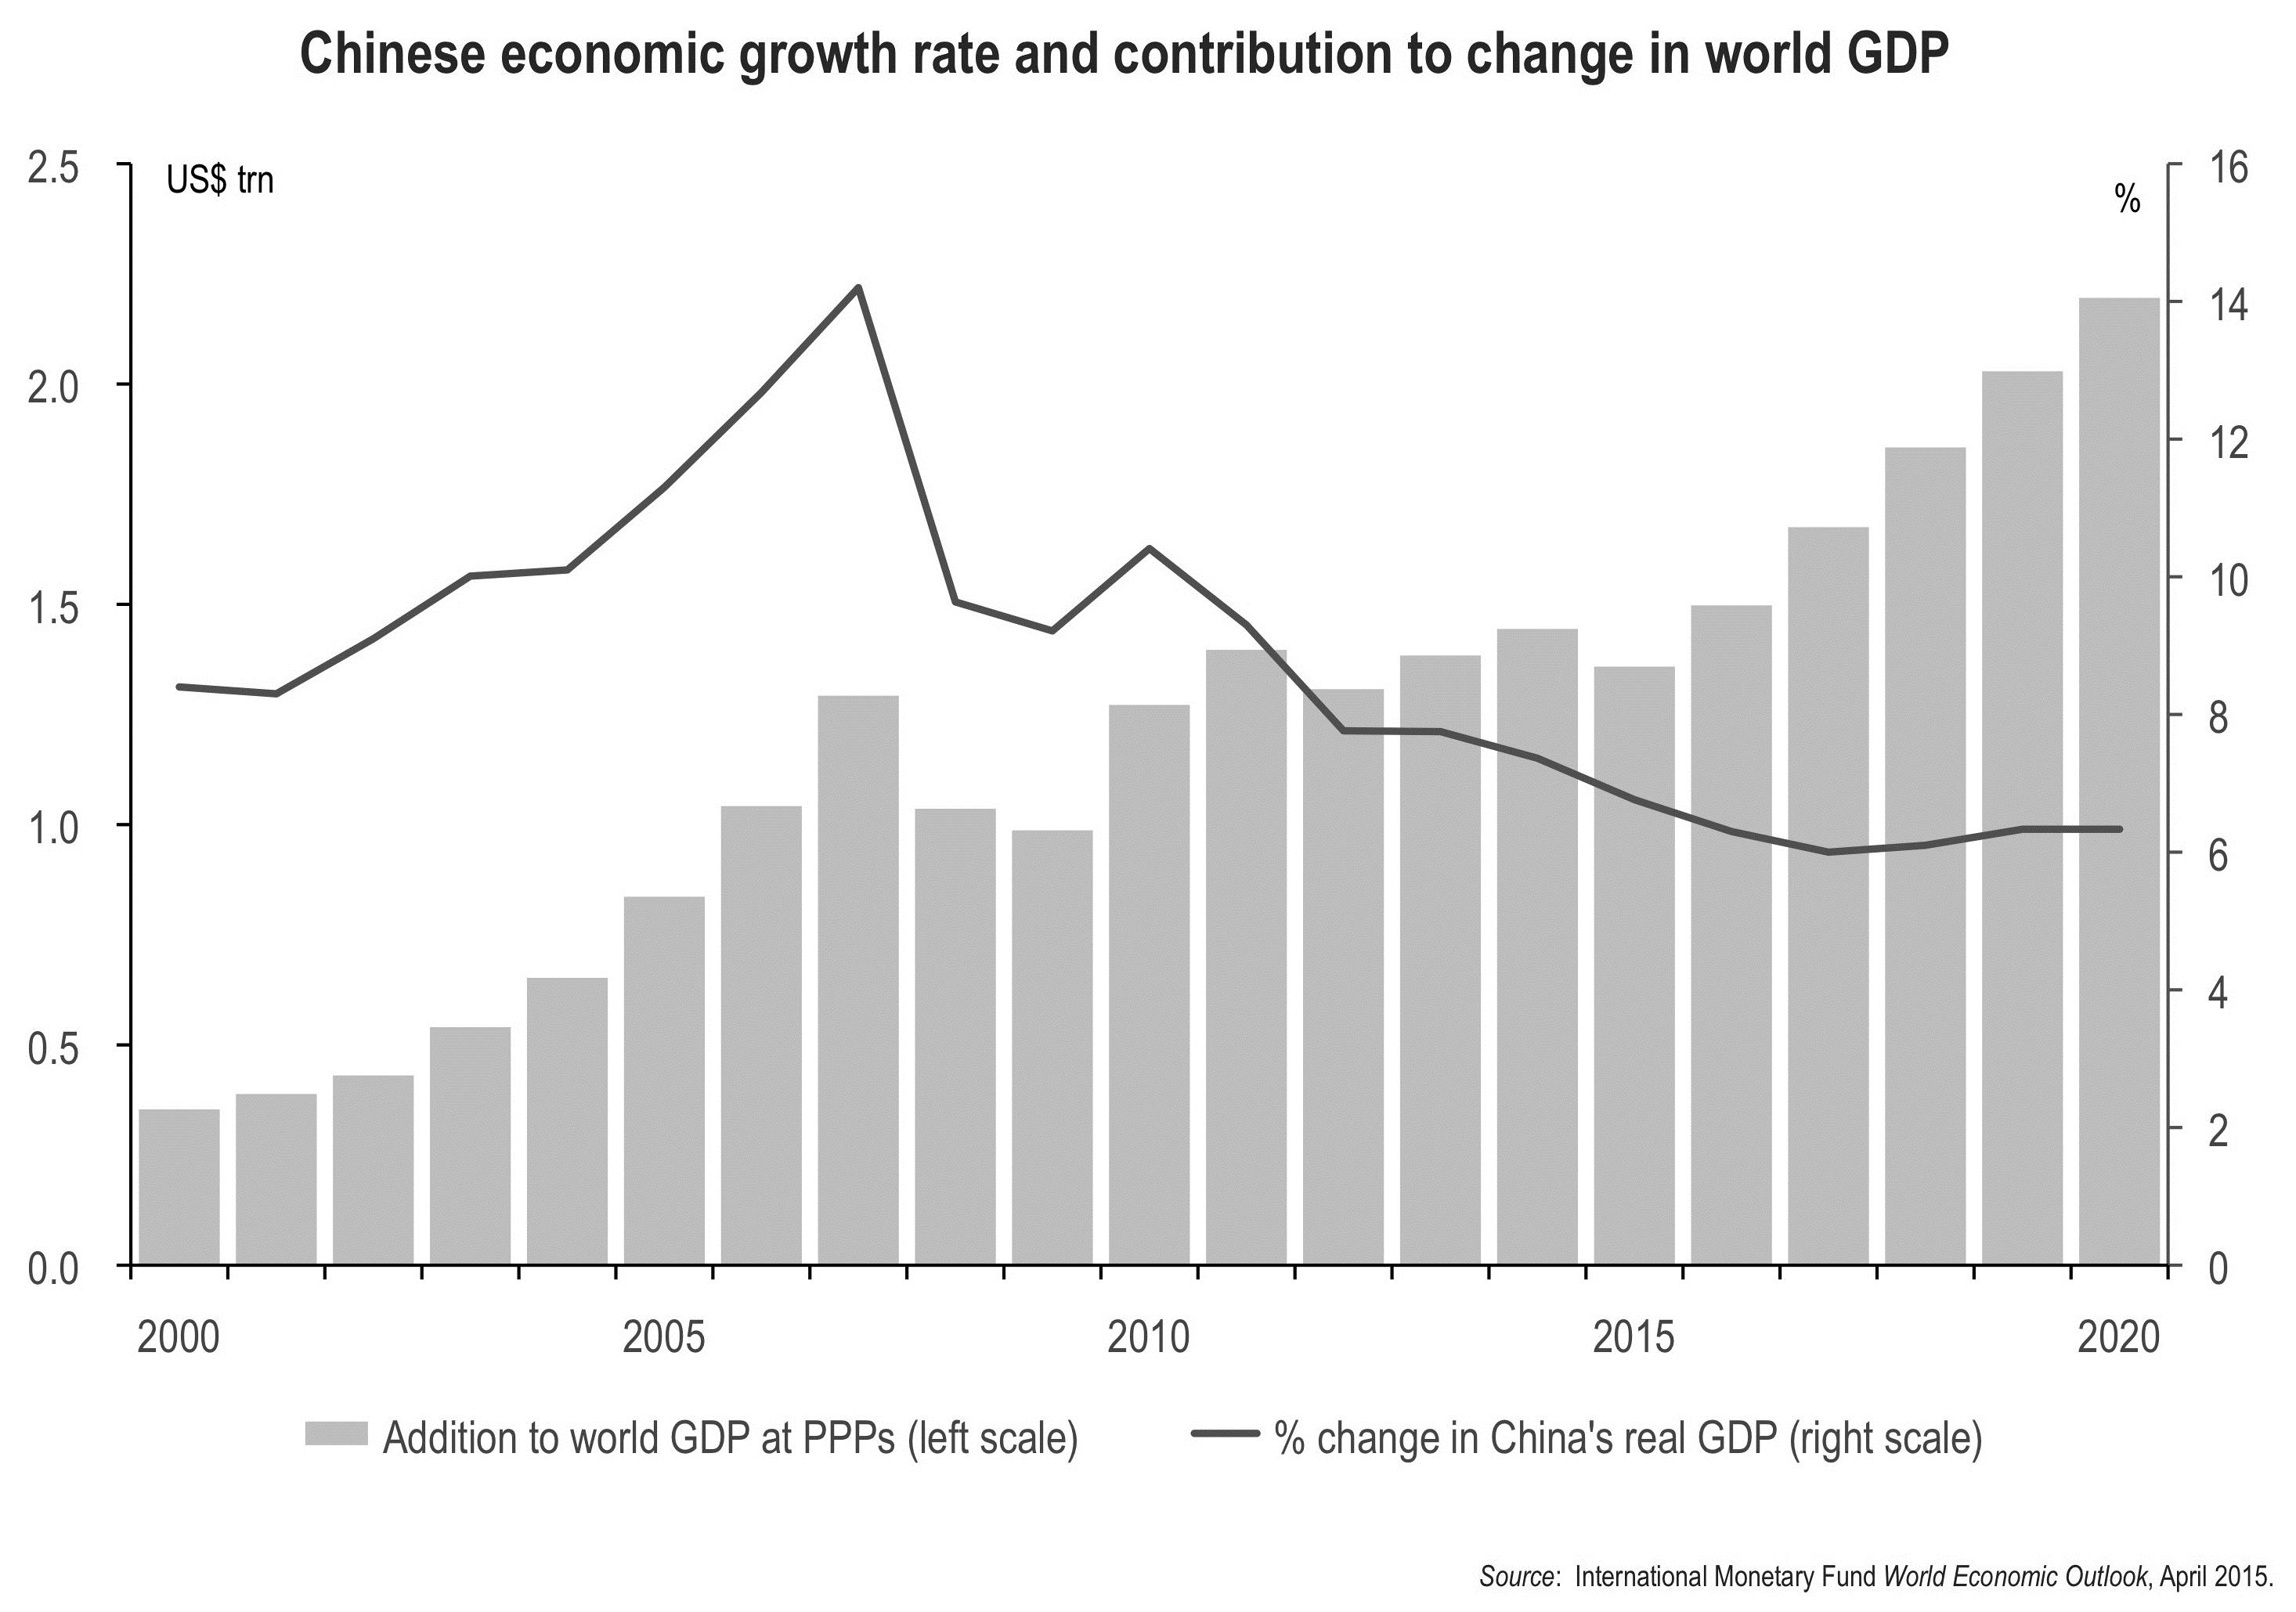
Figure 9: Chinese economic growth rate and contribution to change in world GDP.
The Australian economy
Australia’s economy isn't doing as well relative to others as it was during and immediately after the financial crisis.
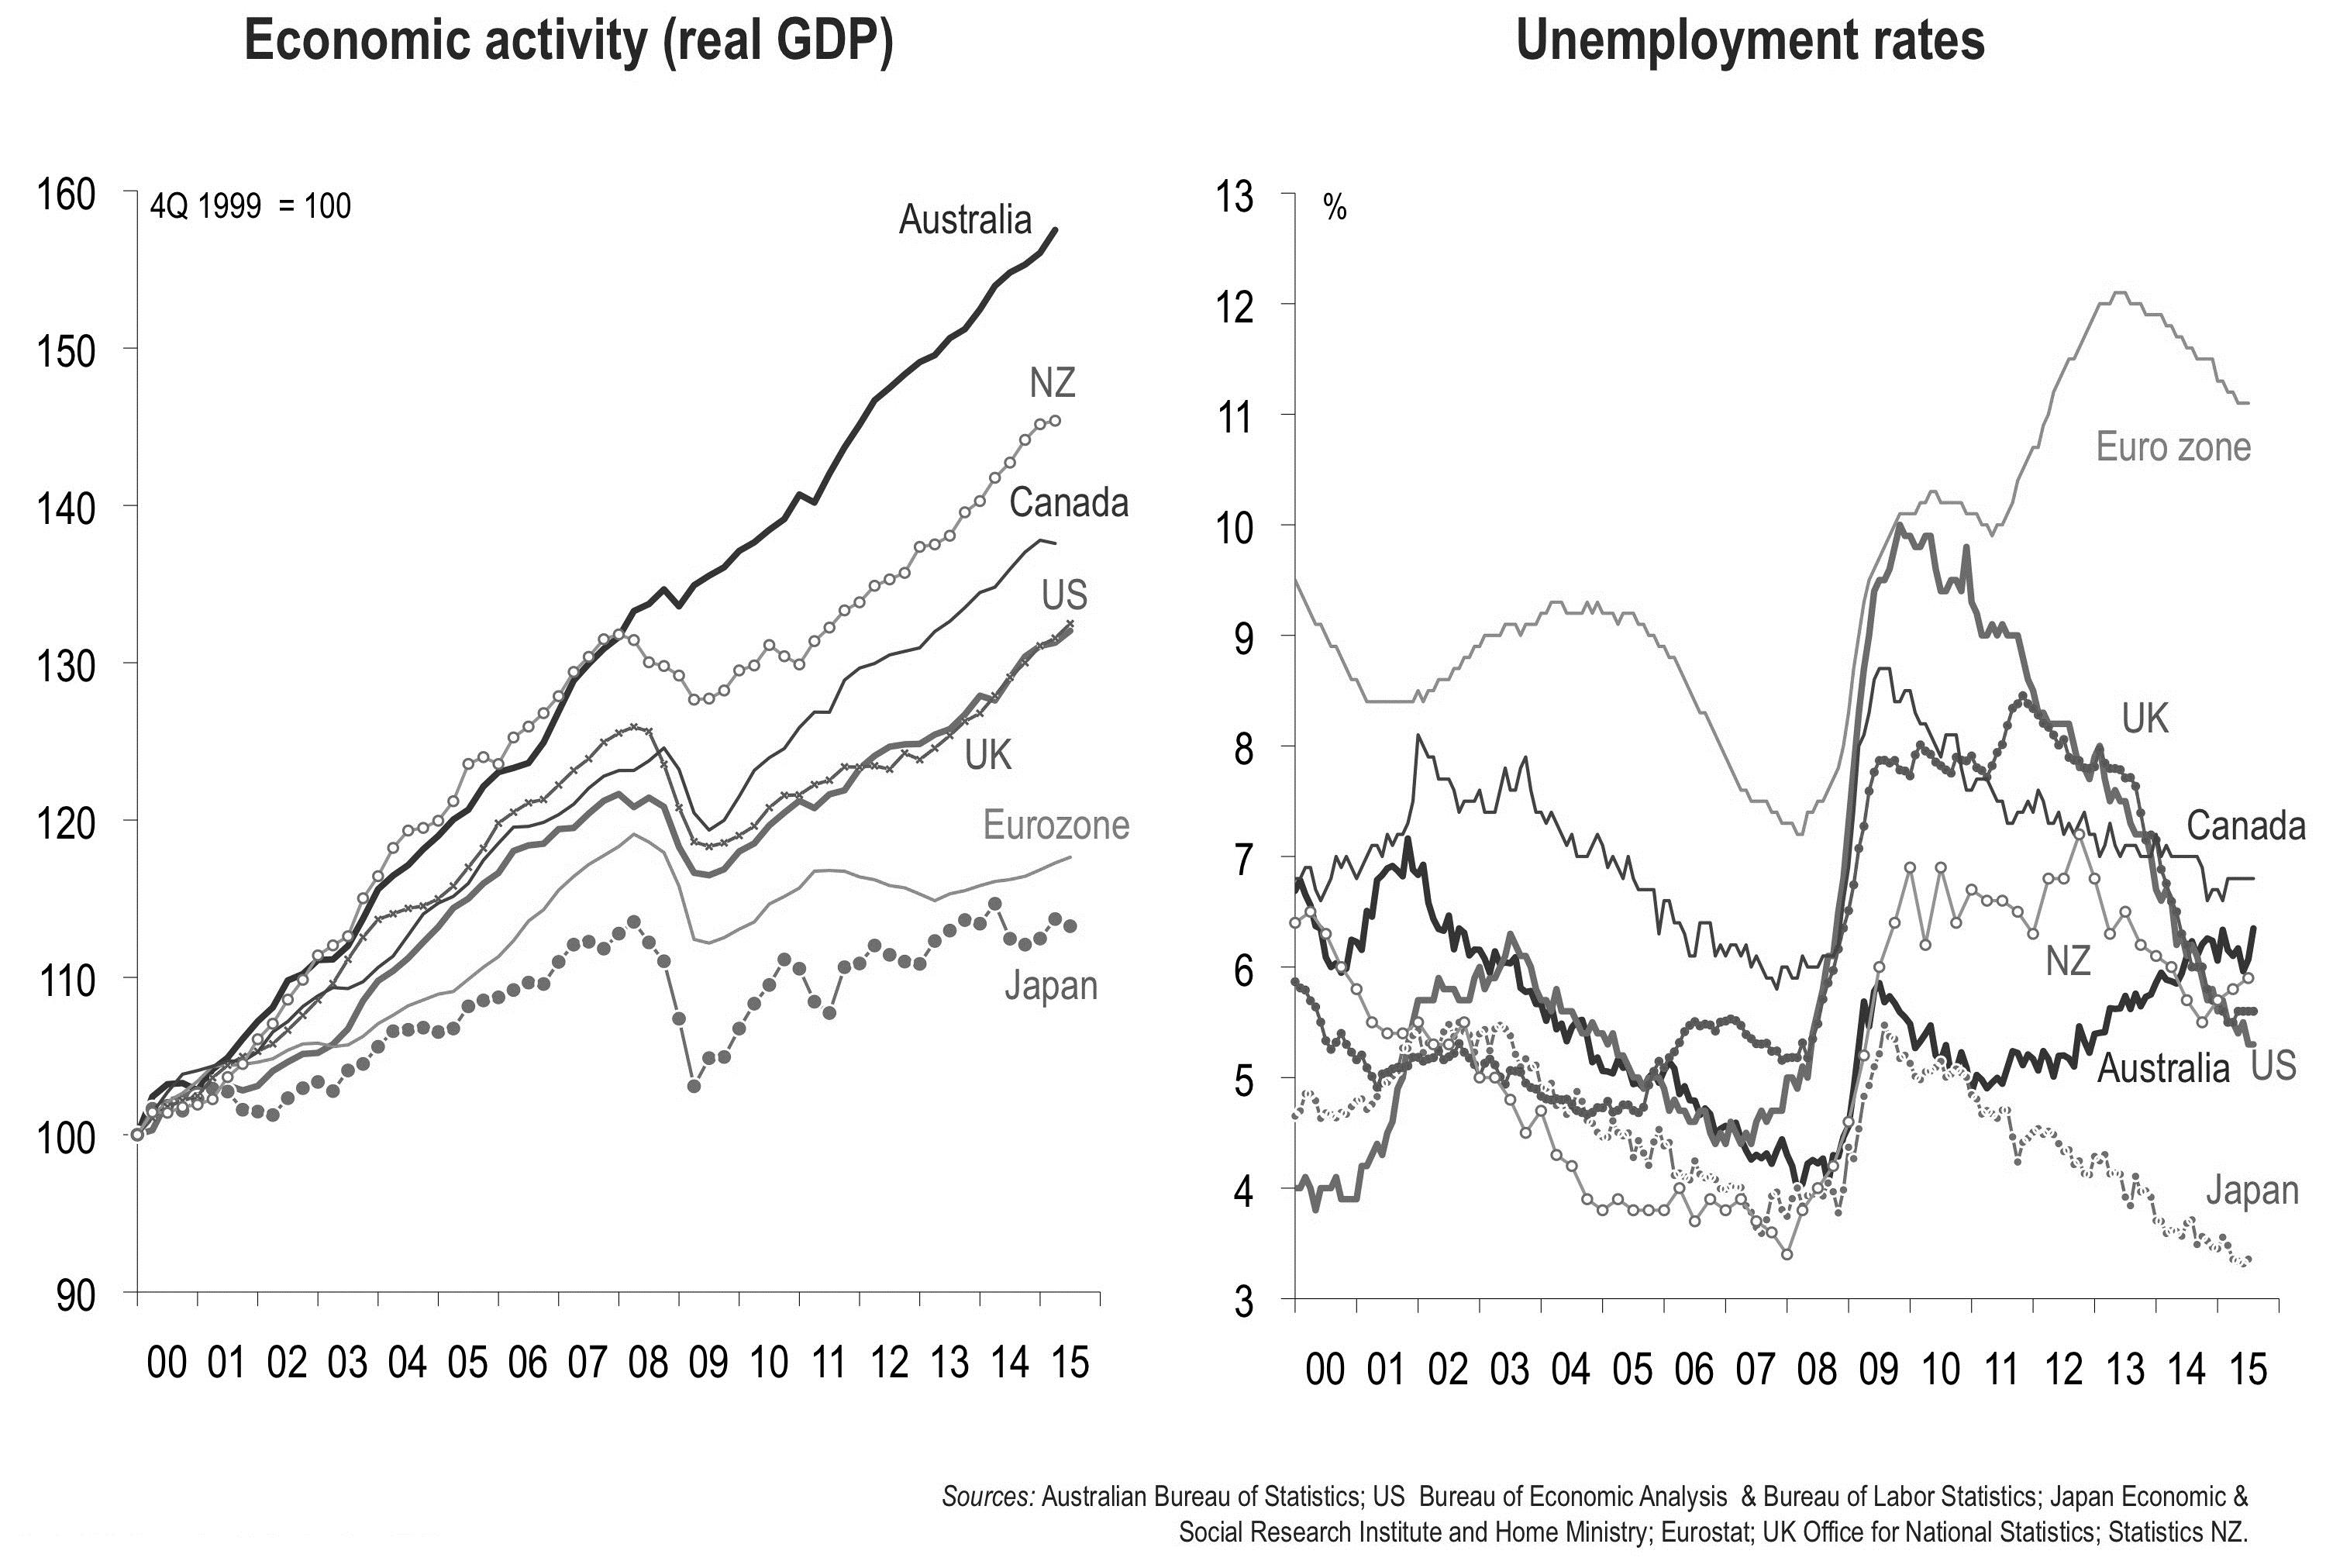
Figure 10: Indicators of Australia’s economy relative to the major ‘advanced’ economies.
Excluding resources exports, economic growth has slowed significantly – and population growth is also slowing.
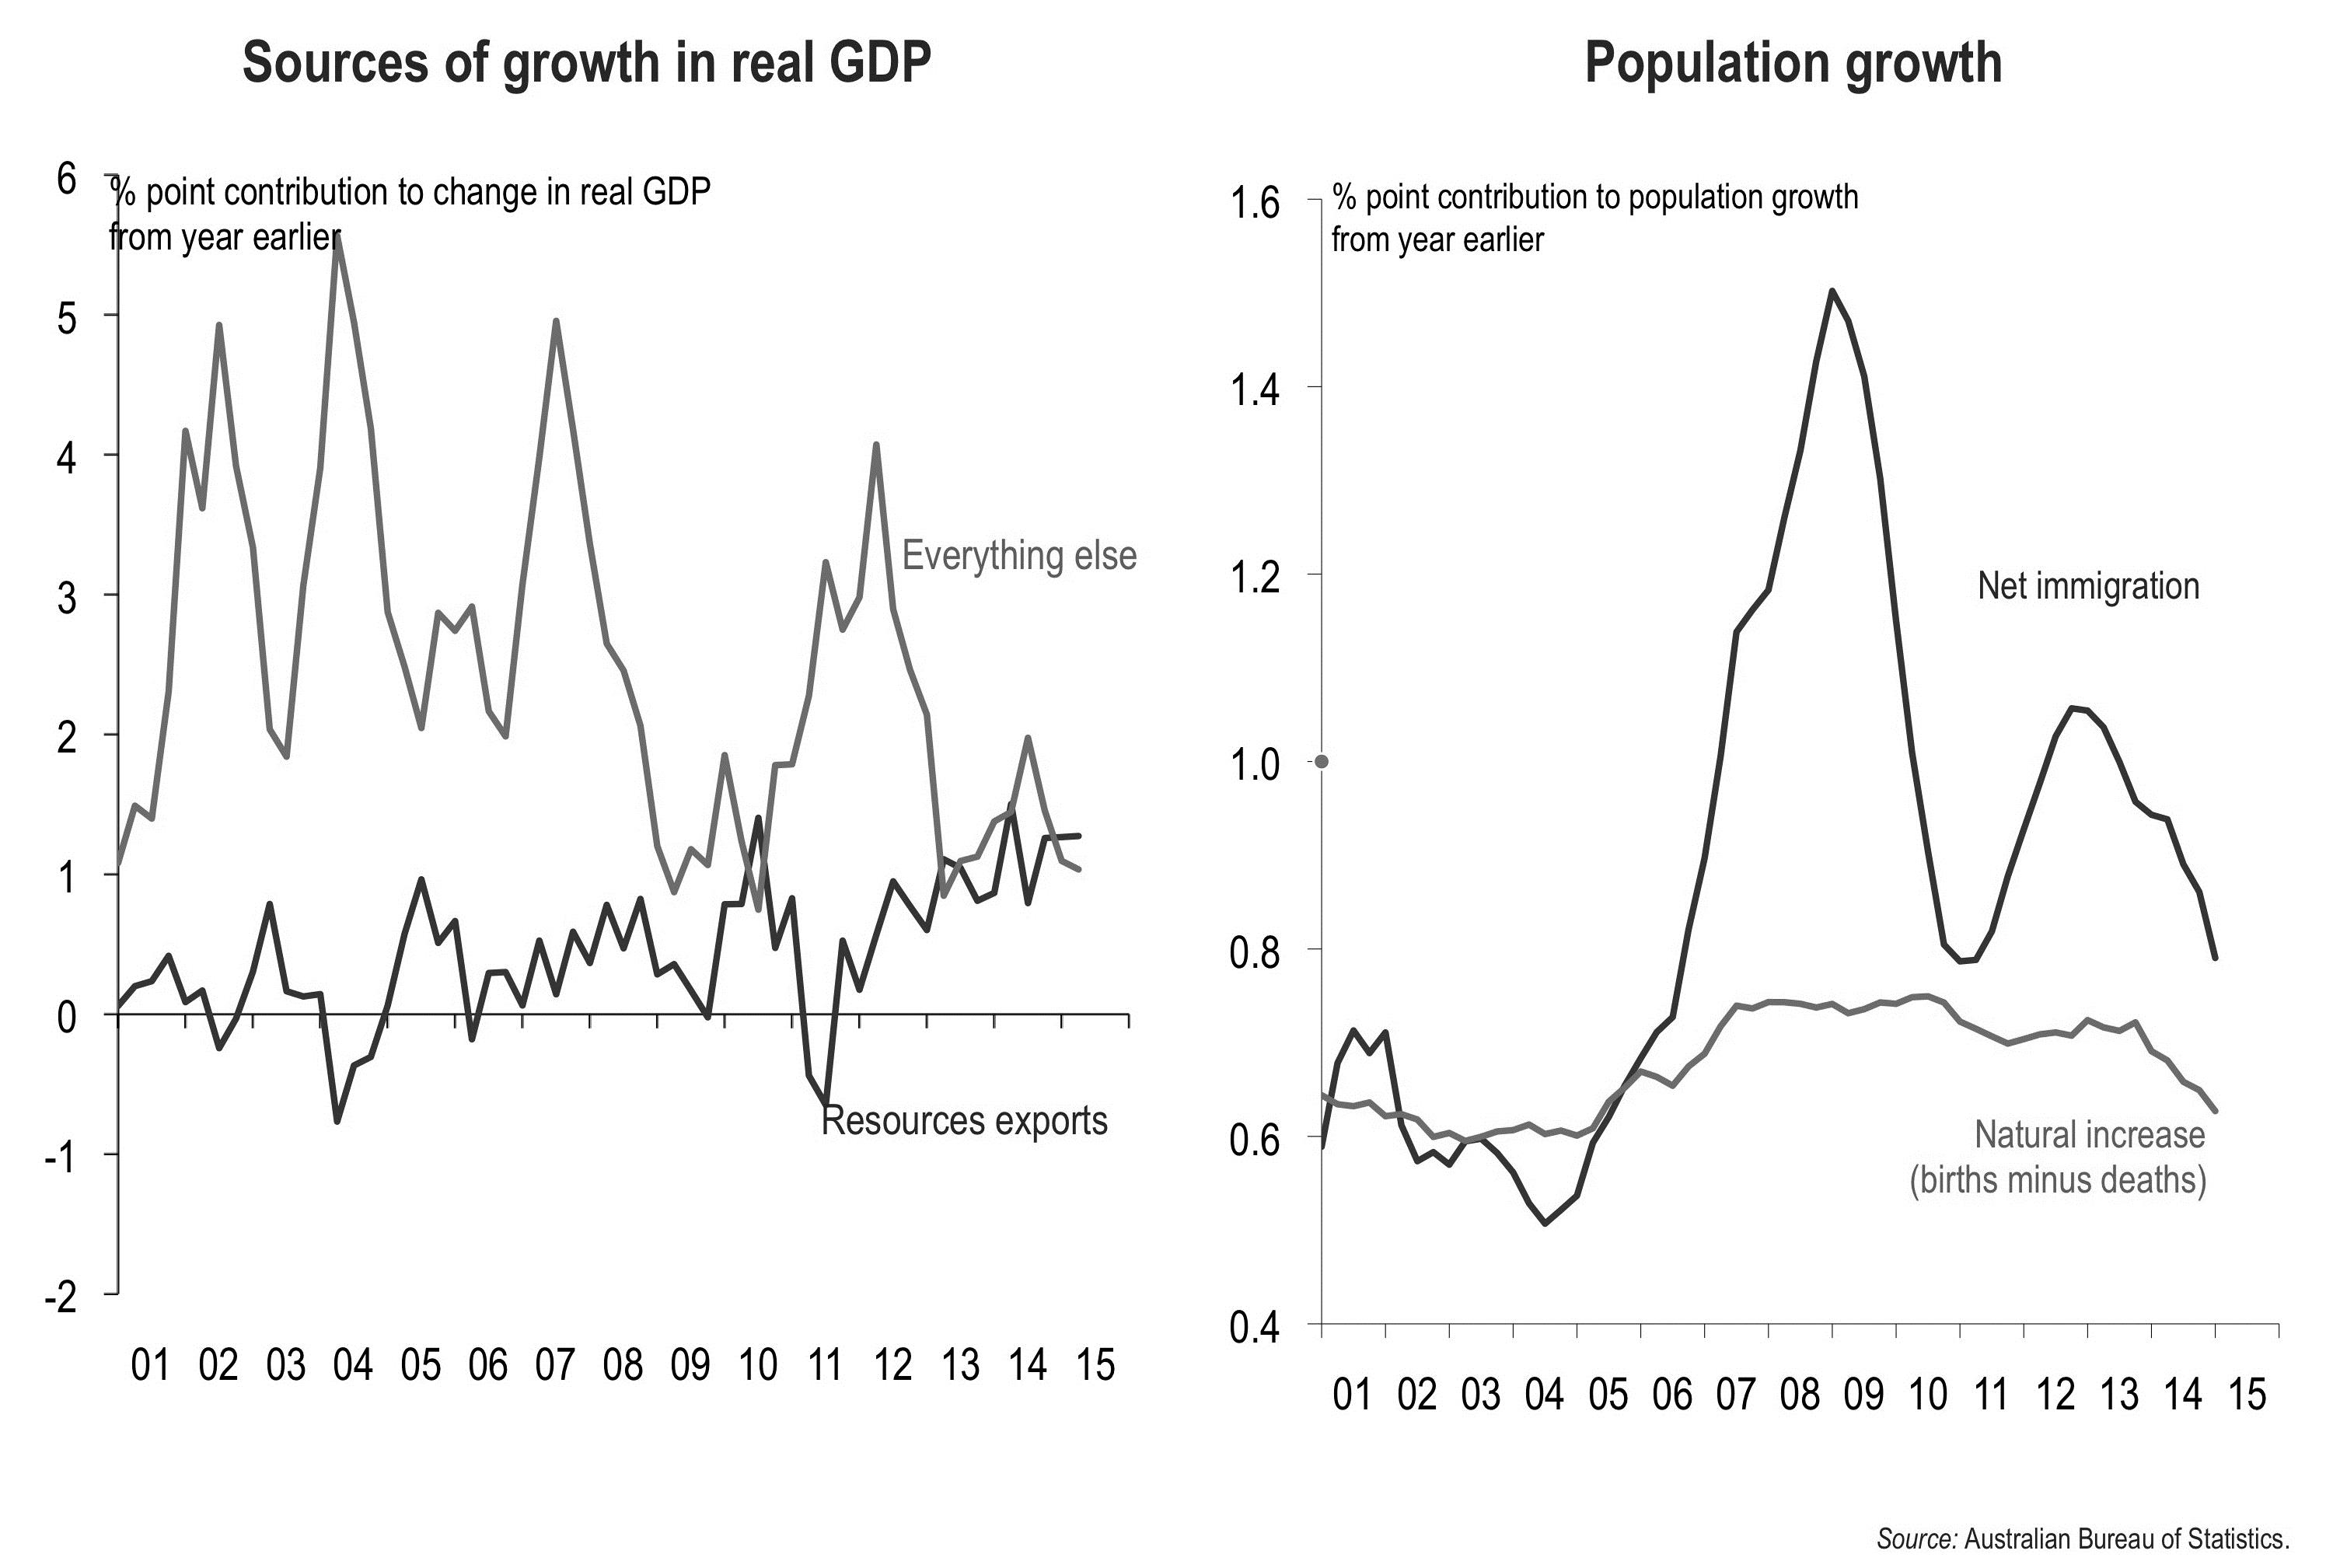
Figure 11 (a): Australia’s source of growth in real GDP and (b): Australia’s population growth.
Australia has experienced the biggest ‘commodities boom’ since the Victorian gold rushes of the mid-19th century.
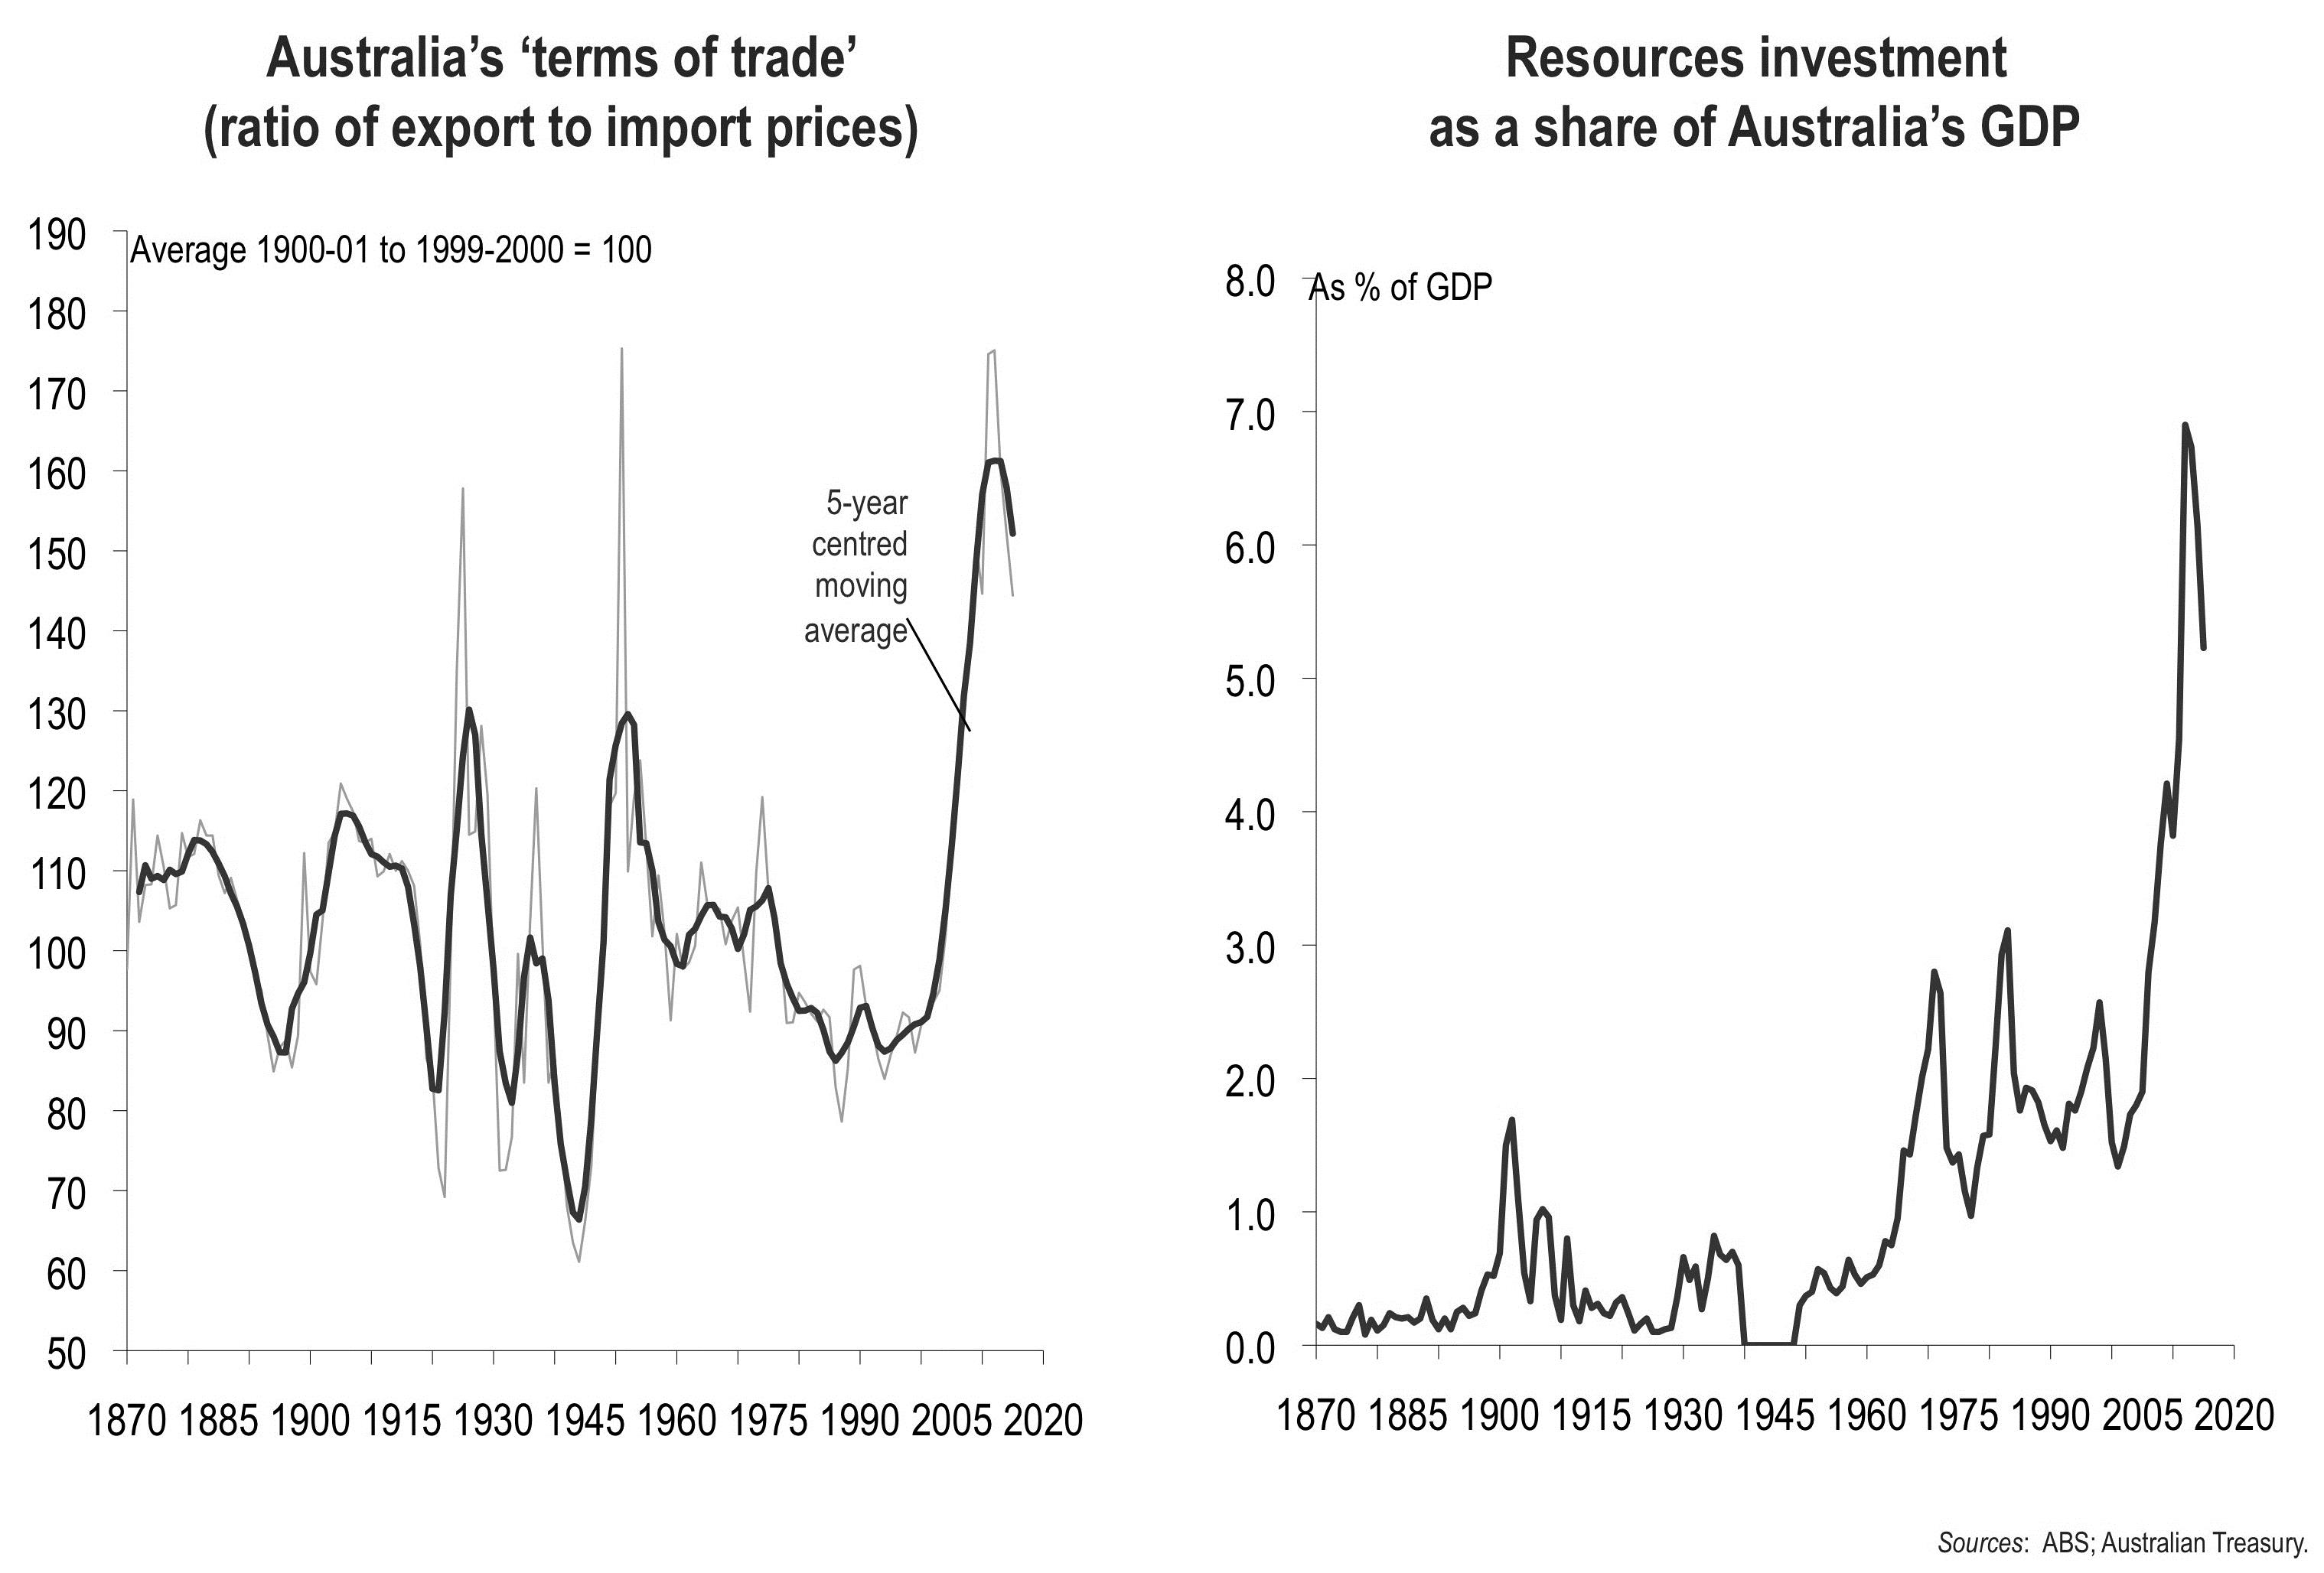
Figure 12: Indicators of Australia’s ‘commodities boom’.
The ‘resources investment boom’ is over – and although resources exports are rising, they are at falling prices and create fewer jobs.
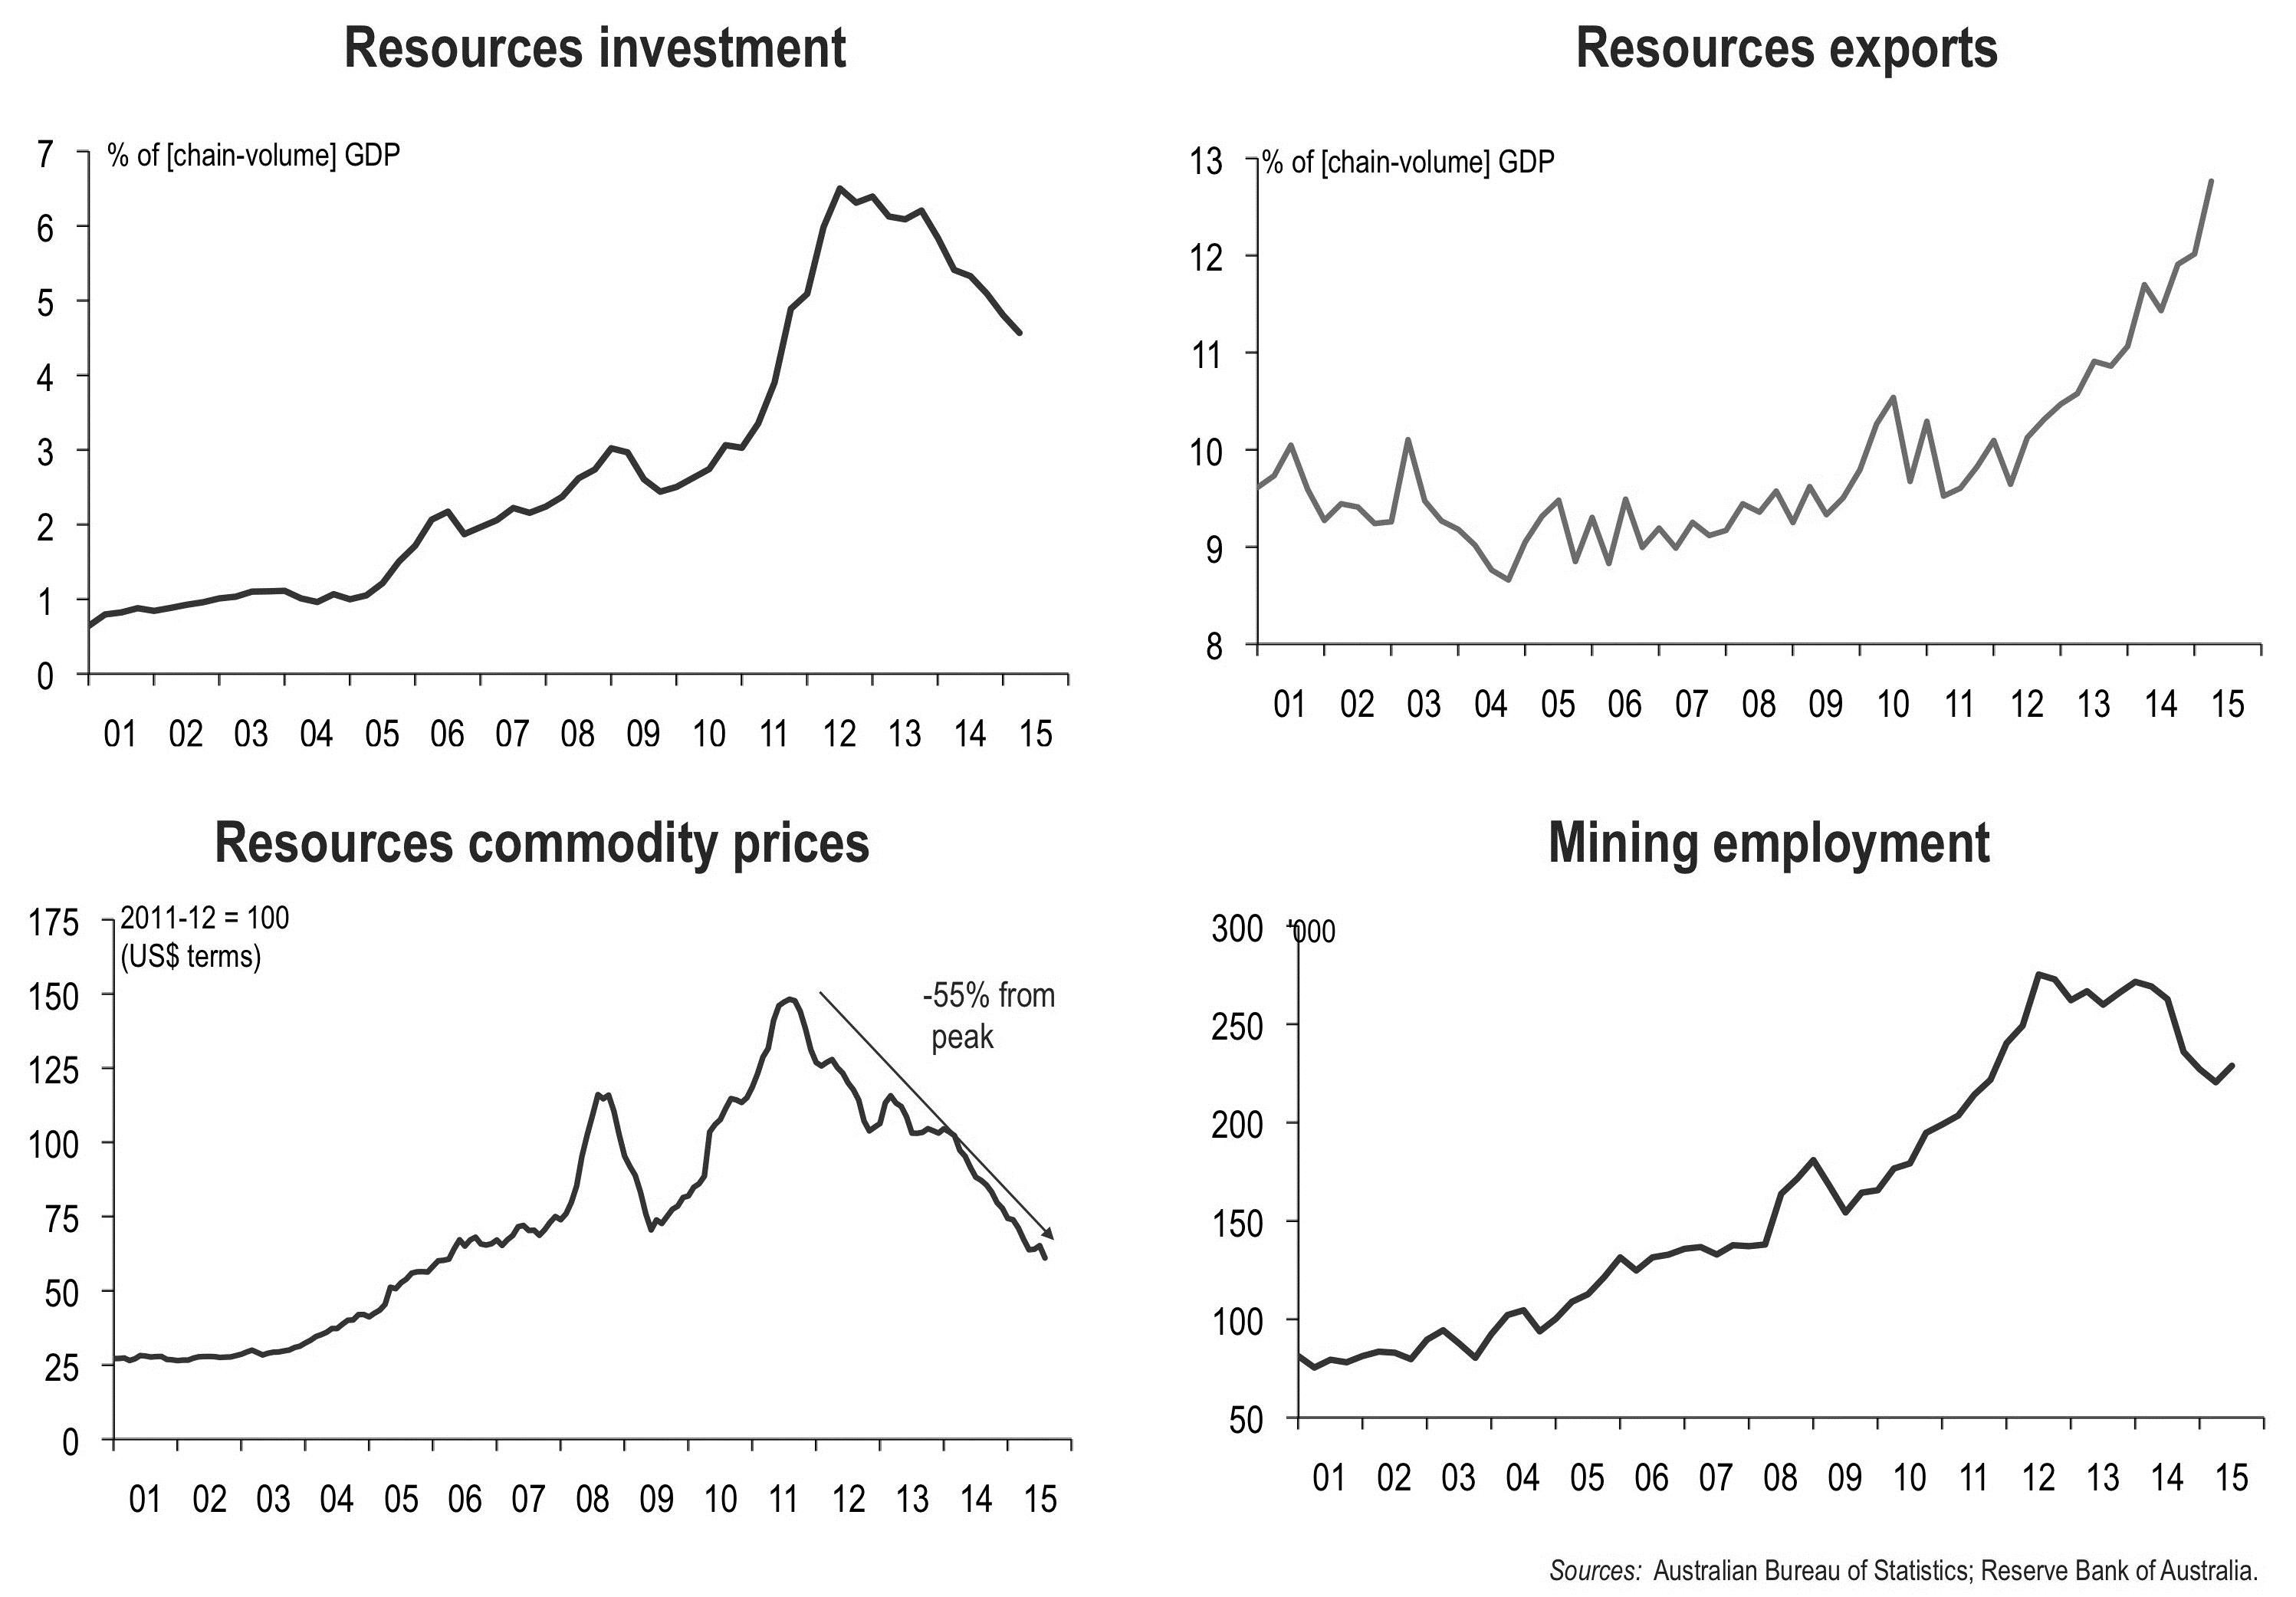
Figure 13: Indicators of Australia’s ‘resources investment’ and ‘mining employment’.
Previous commodities booms ended in double-digit inflation – making recessions almost inevitable: the latest one didn’t.
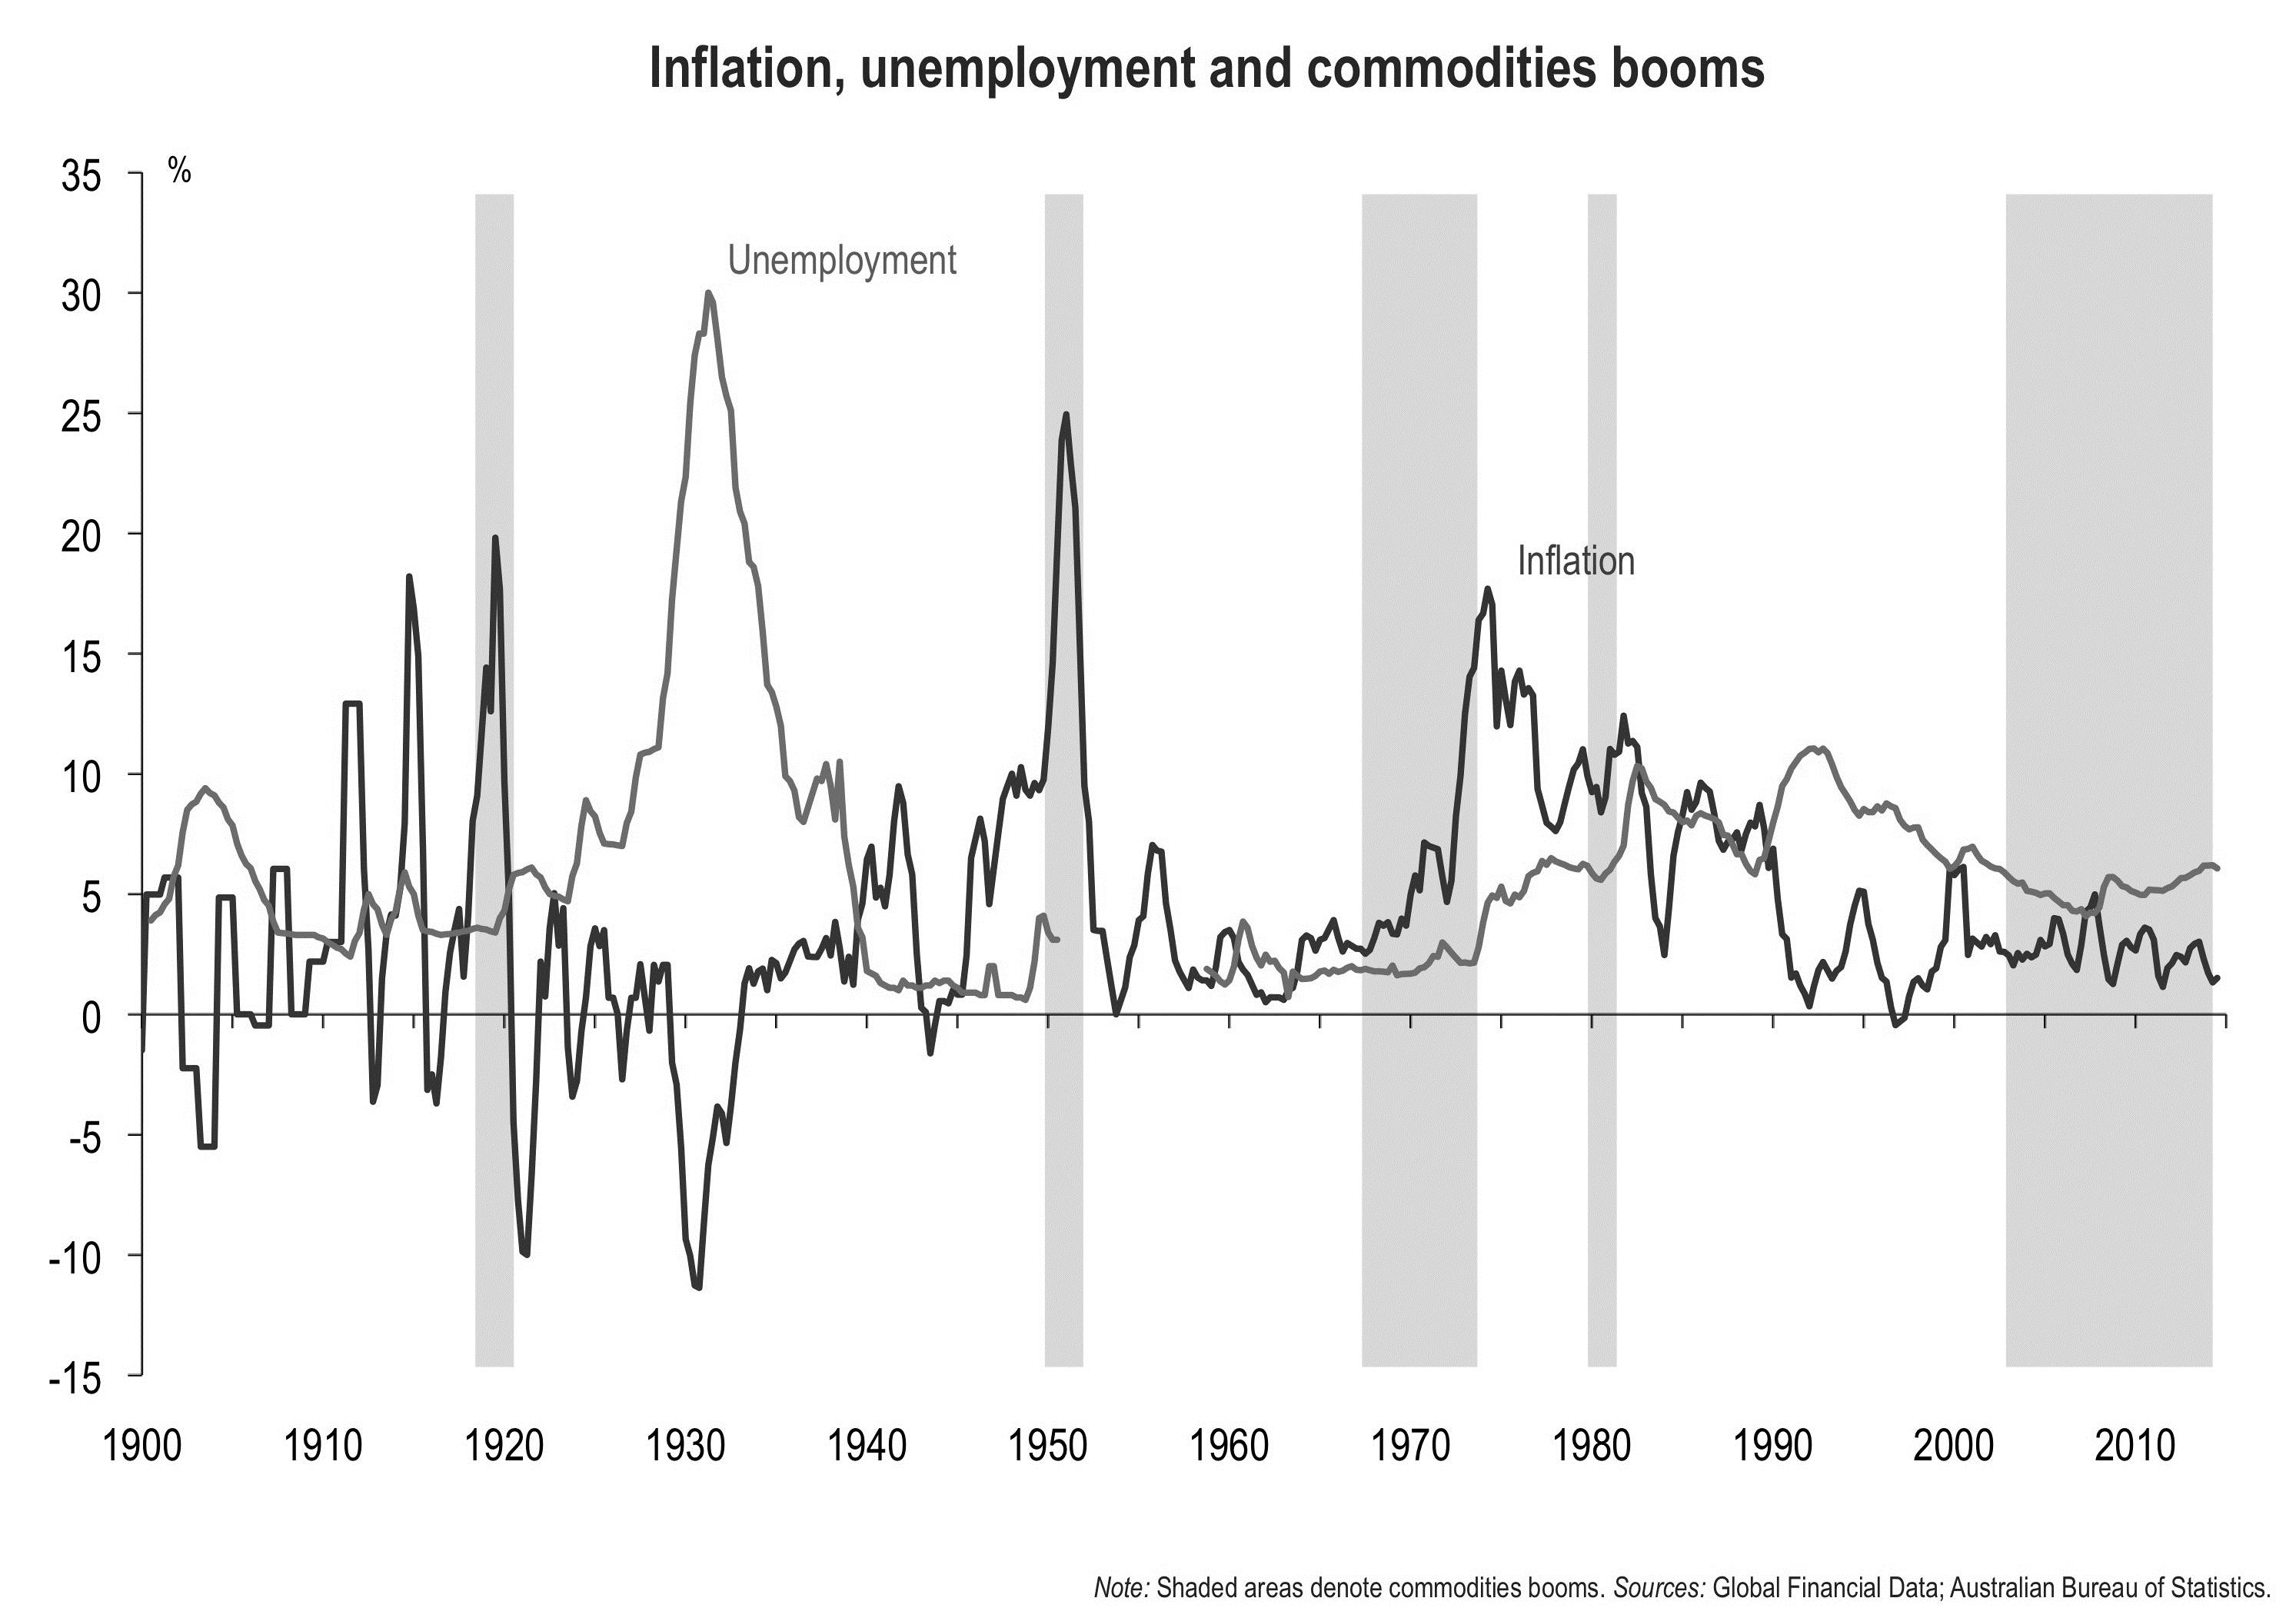
Figure 14: Correlation between commodities booms and inflation.
Past recessions have been preceded by periods of high interest rates (by standards of the day) – yet rates are now at record lows.
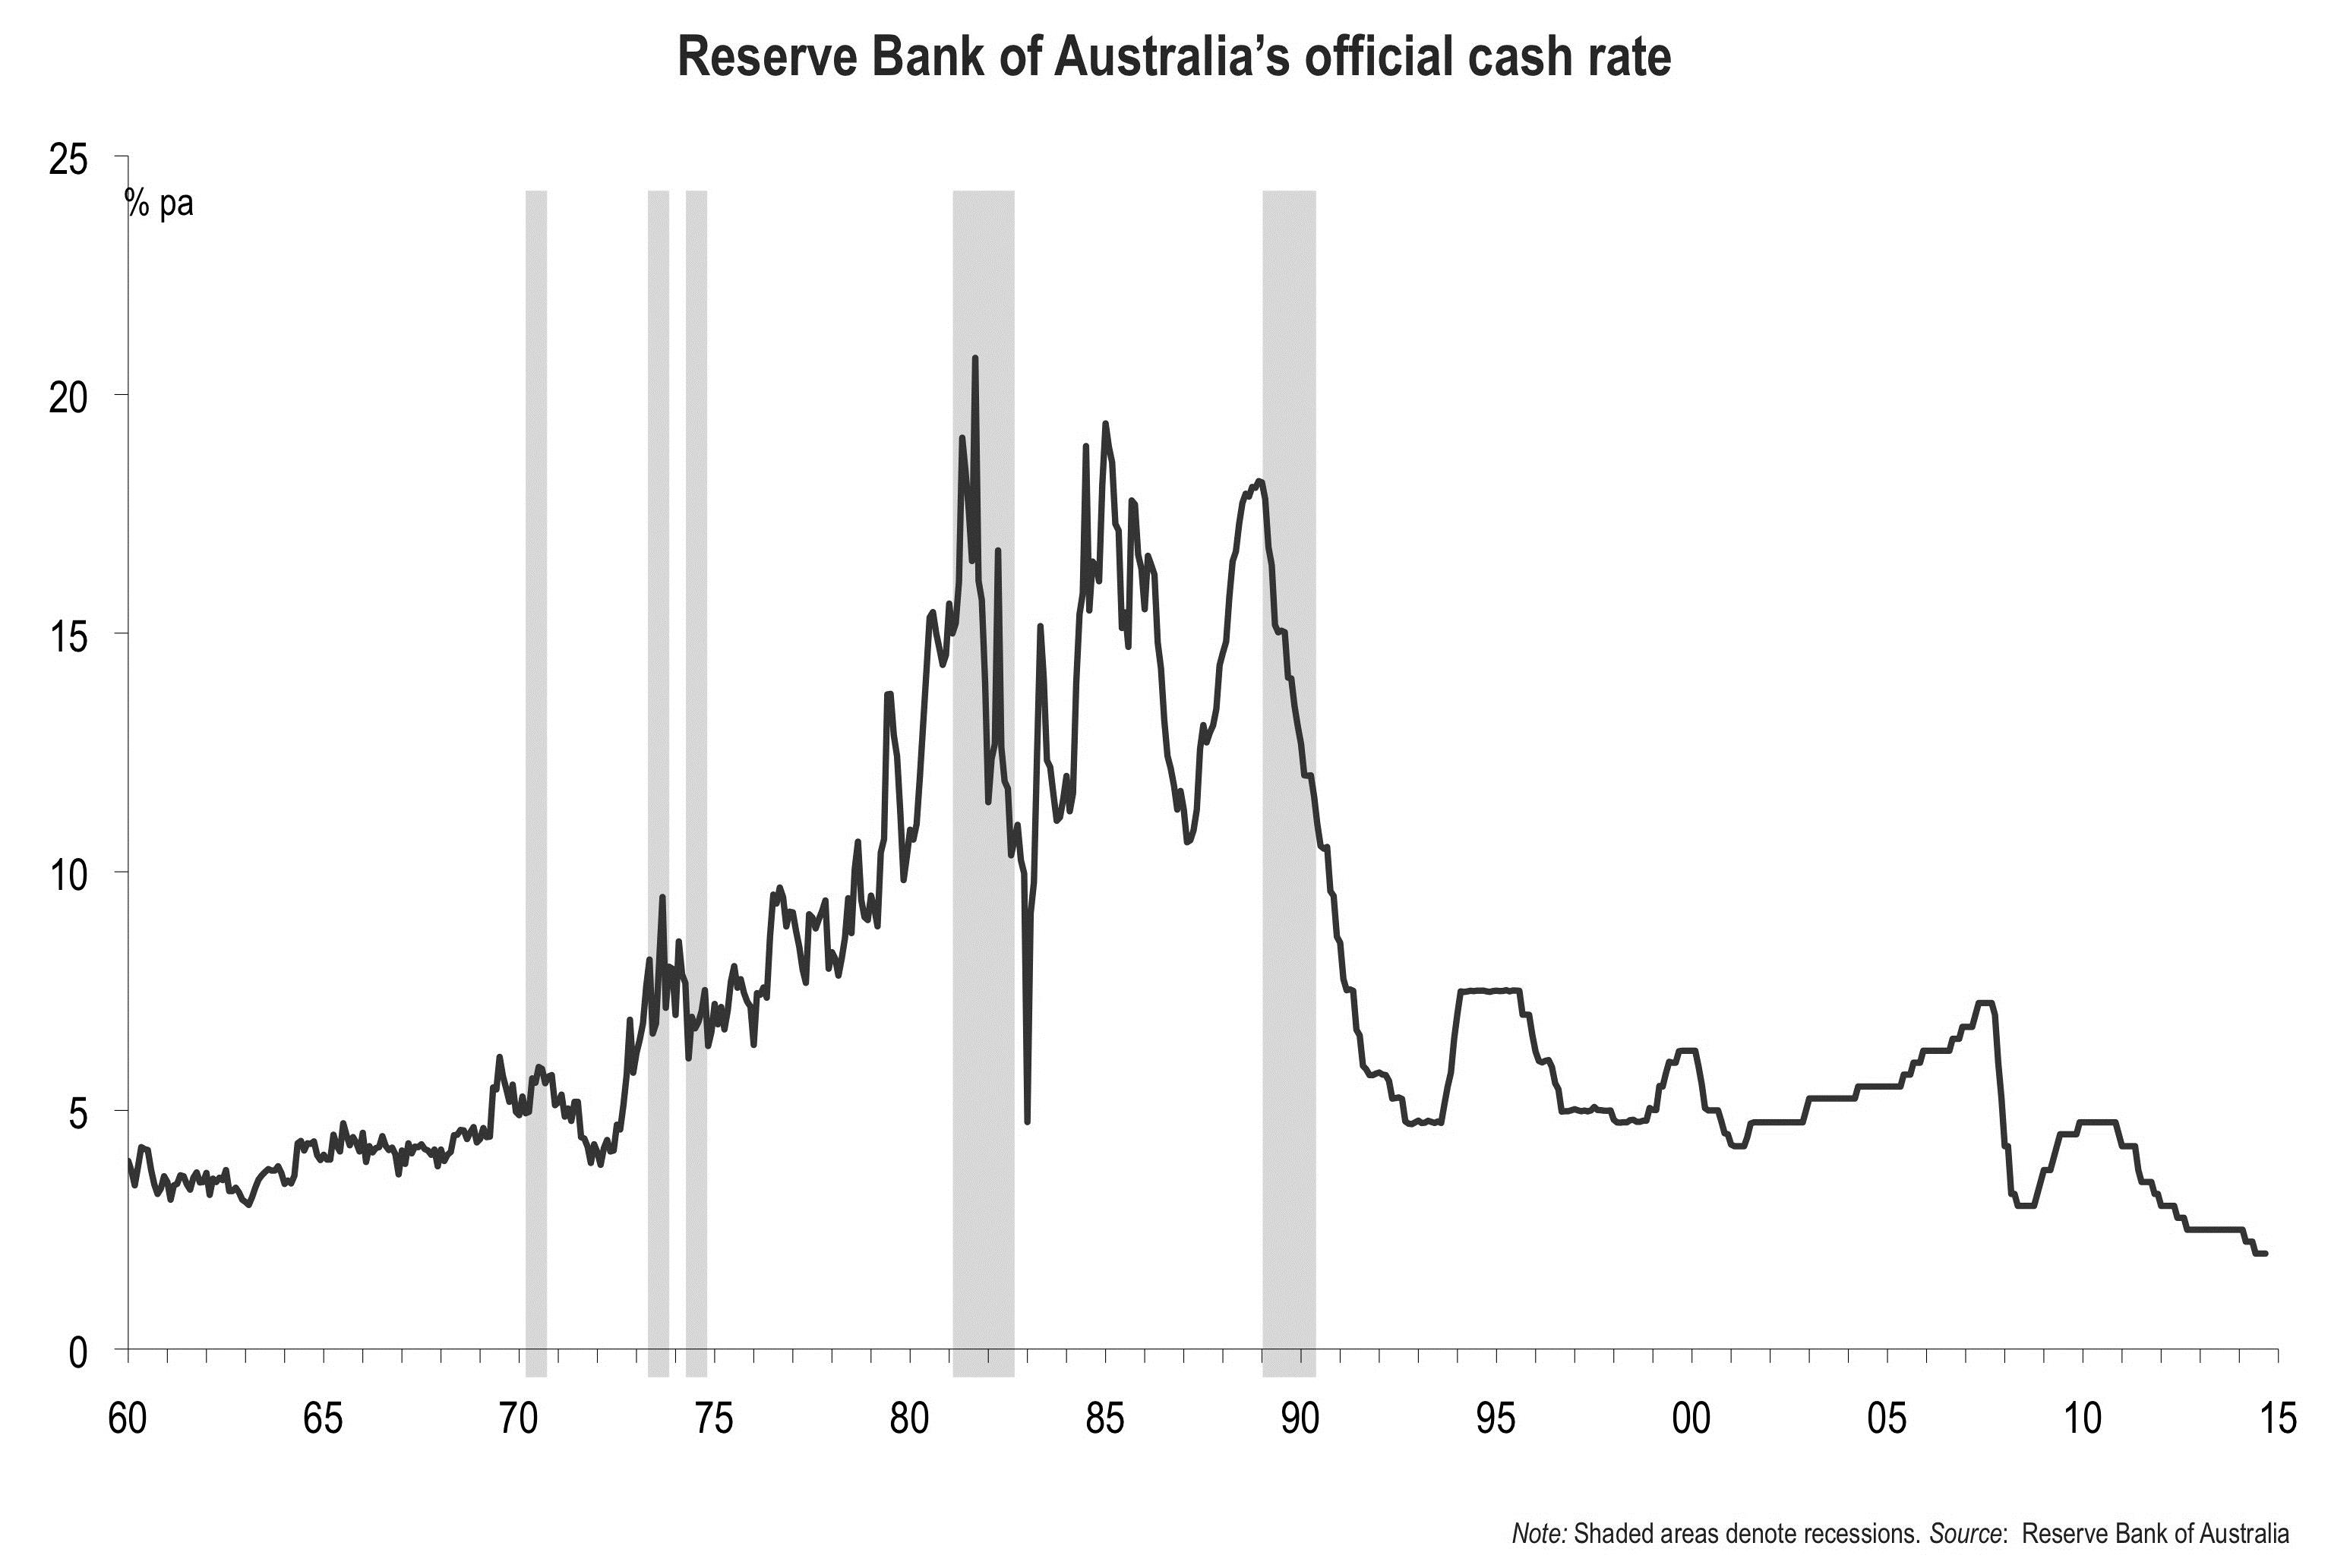
Figure 15: Reserve Bank of Australia’s official cash rate (1960 – 2015).
Record low interest rates have certainly boosted the demand for housing demand, house prices and housing activity.
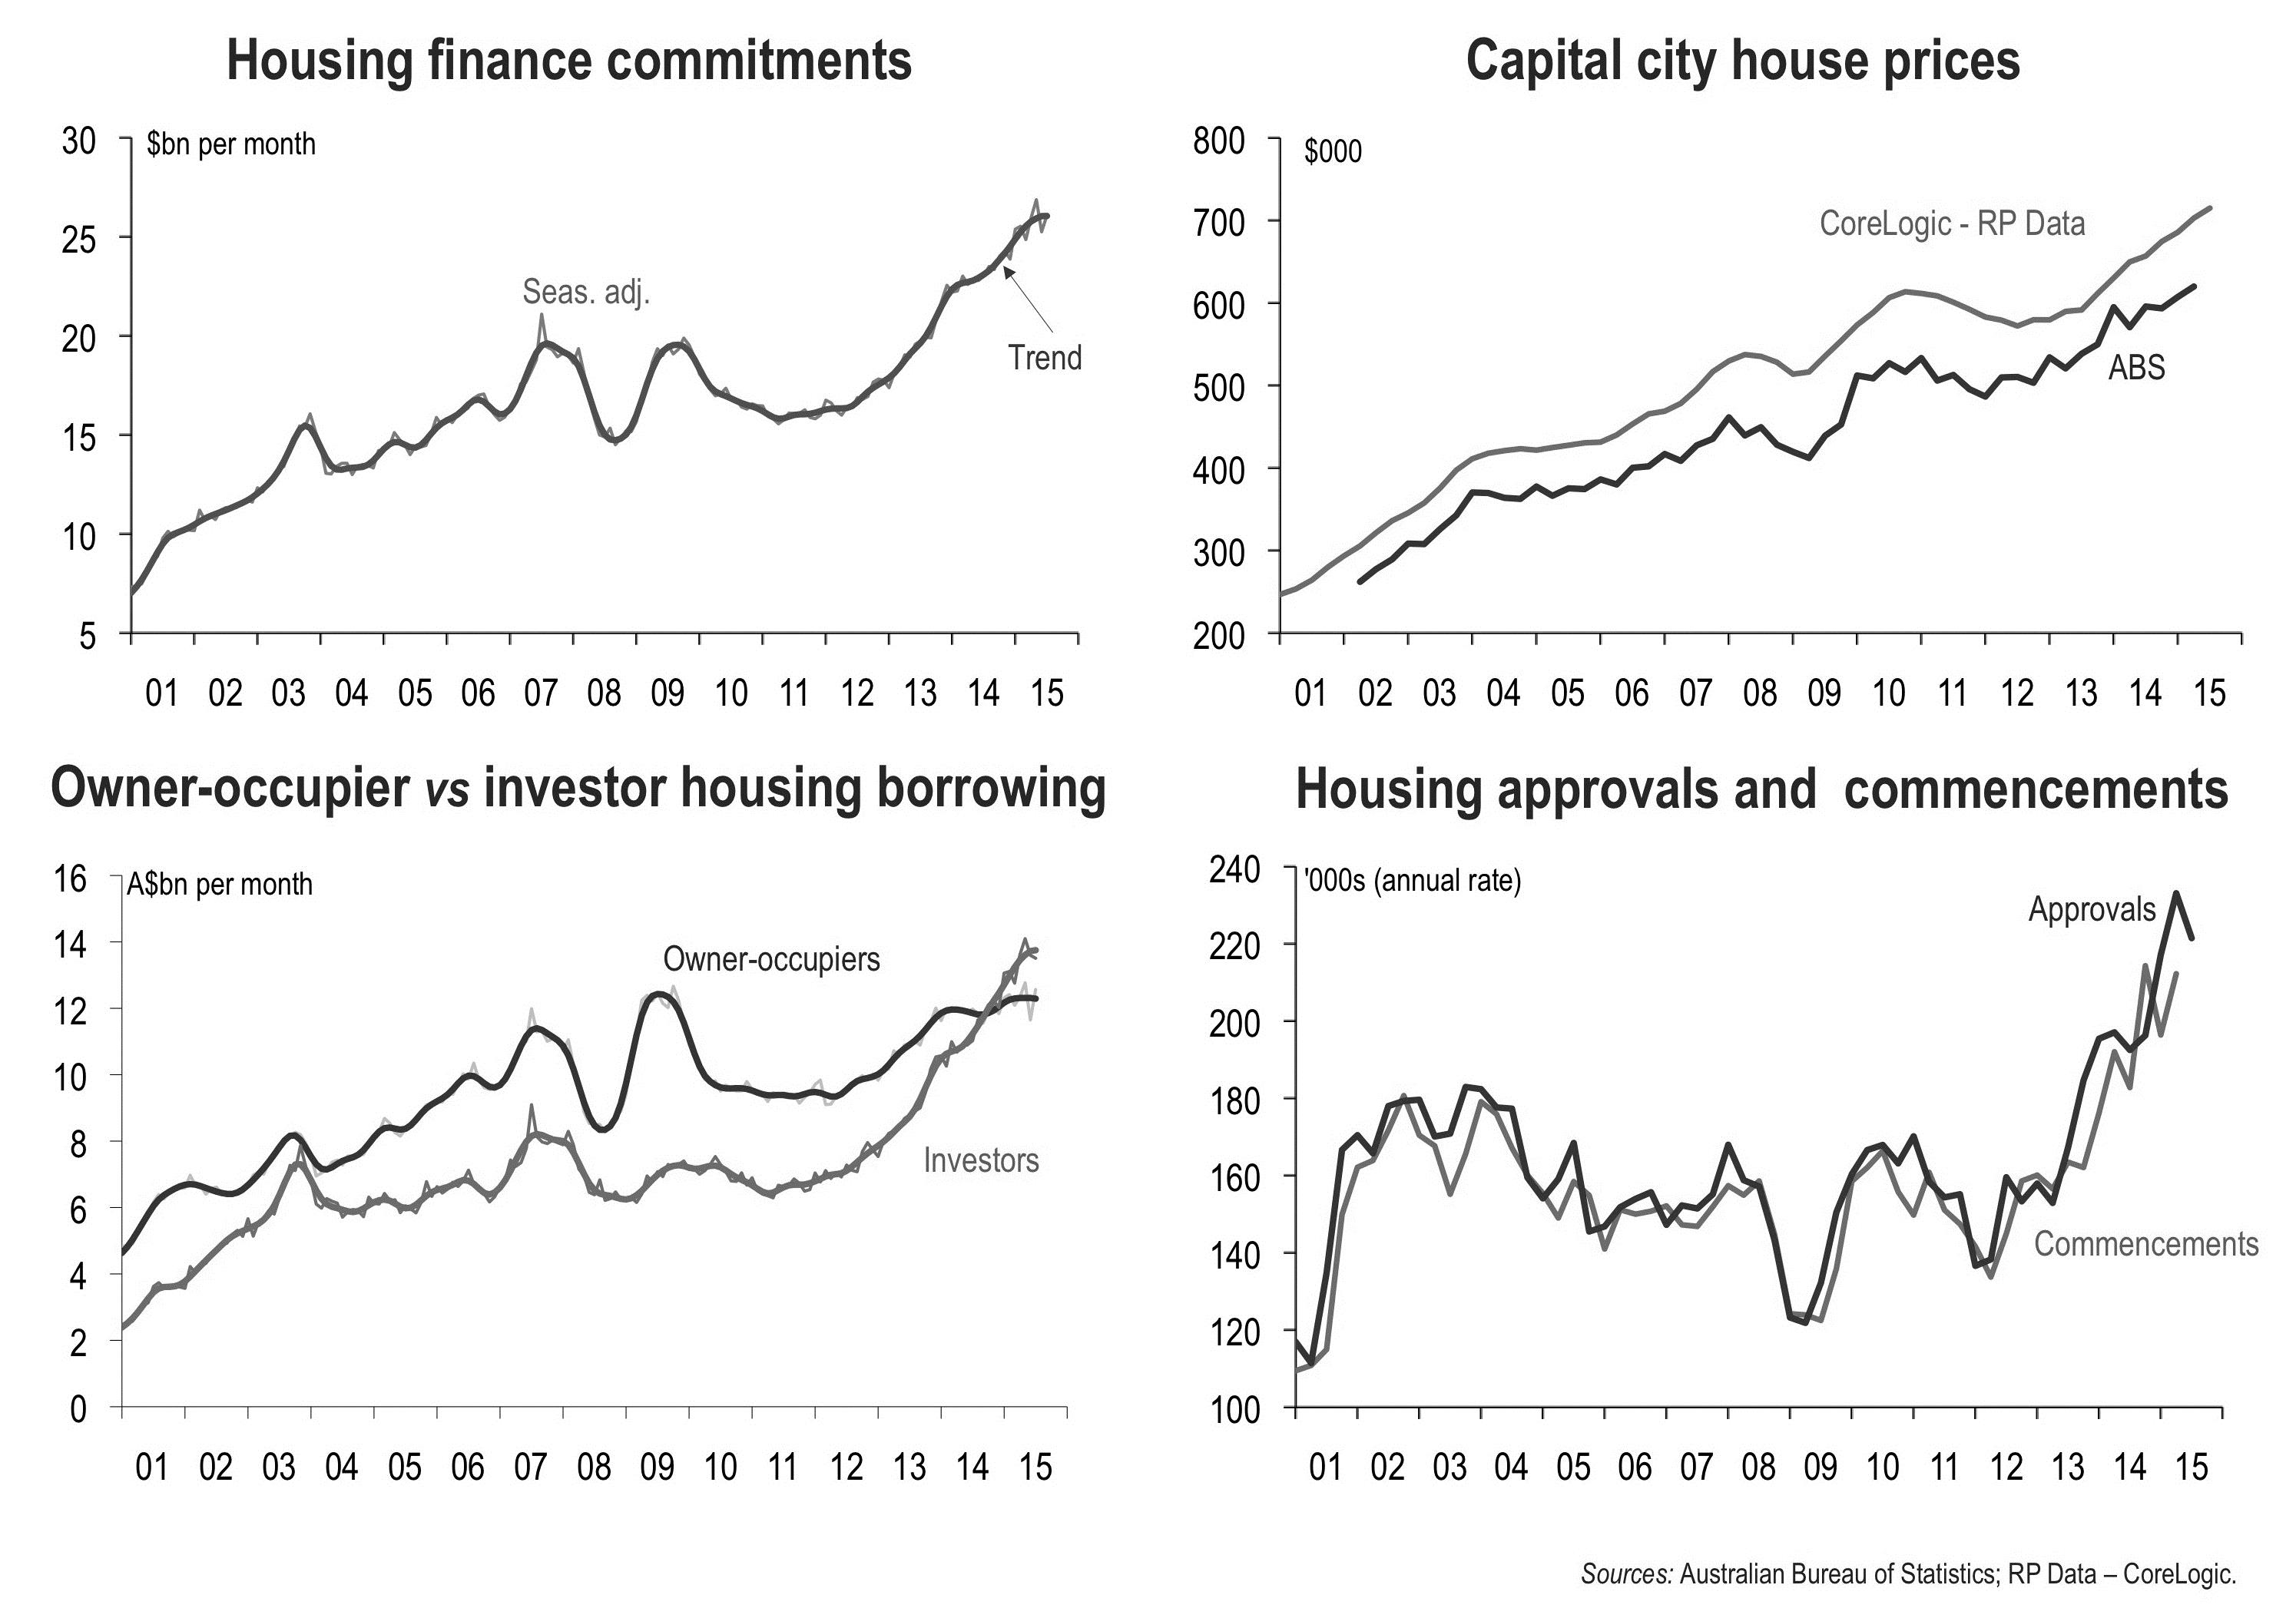
Figure 16: Indicators of housing activity.
Low growth in wages and household incomes, and a reluctance to borrow more means consumer spending stays sluggish.
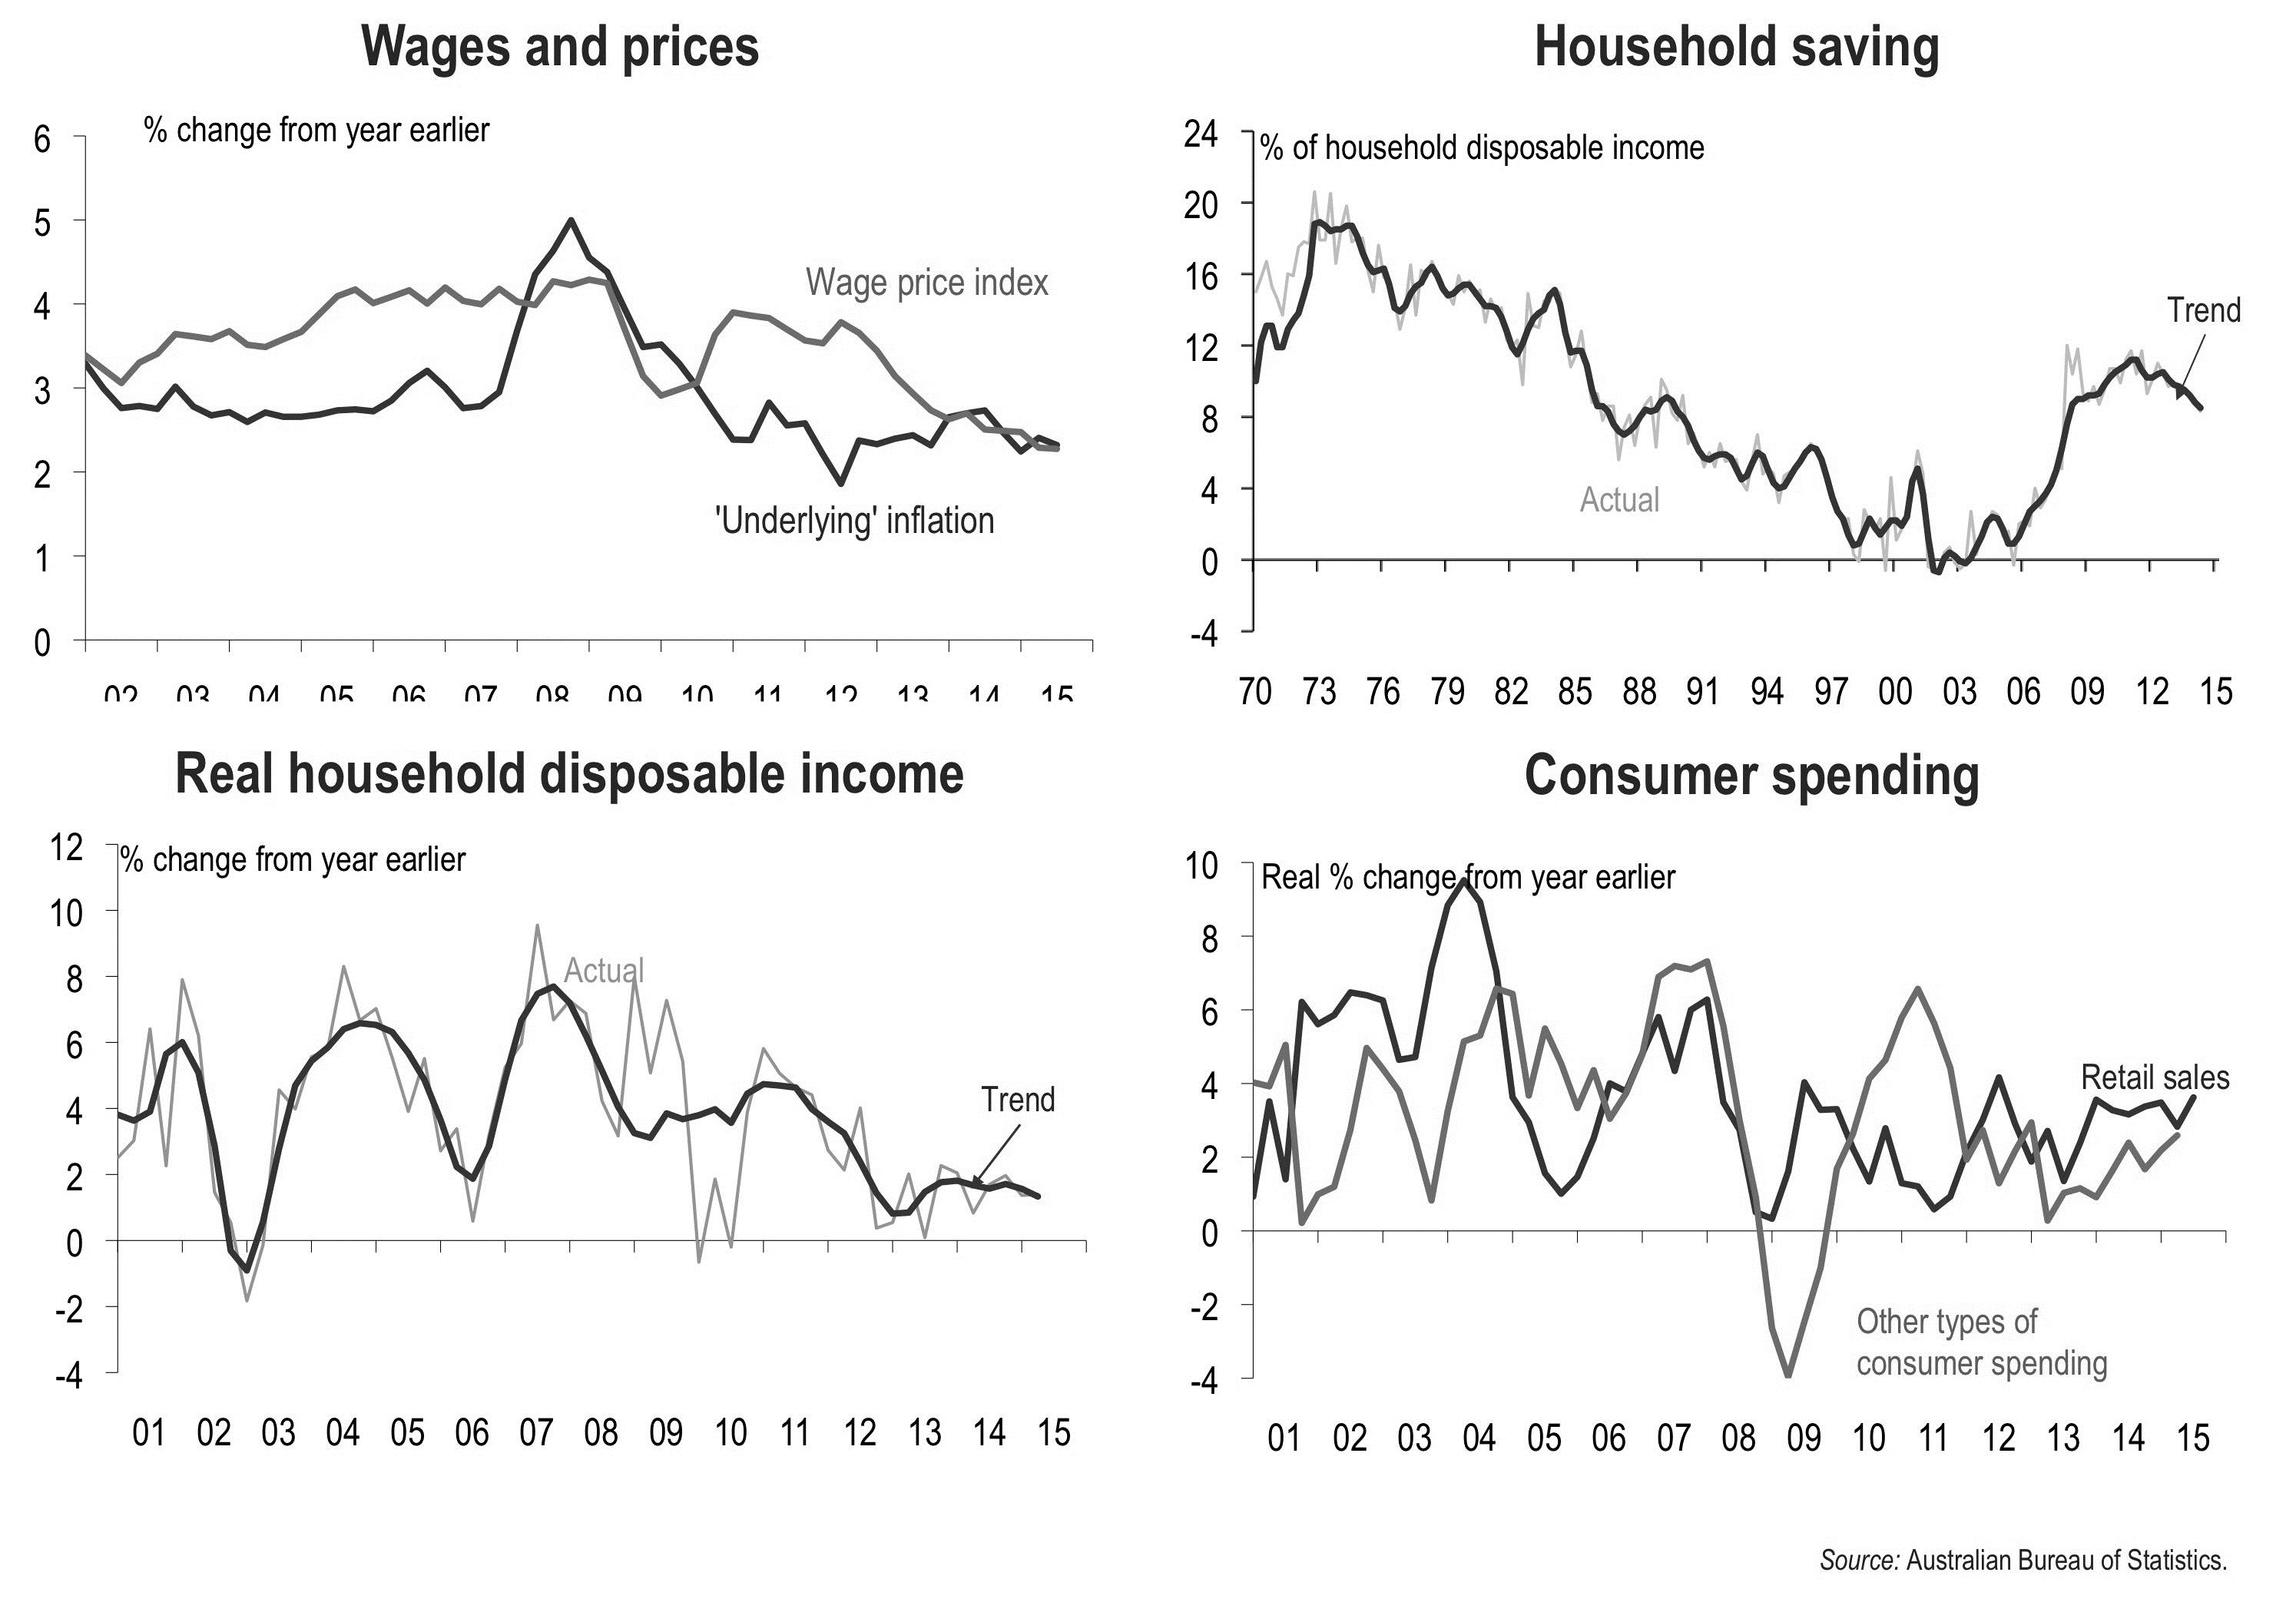
Figure 17: Wages, savings and consumer spending.
And soft demand from households (and governments) means that business remains reluctant to invest despite low interest rates.
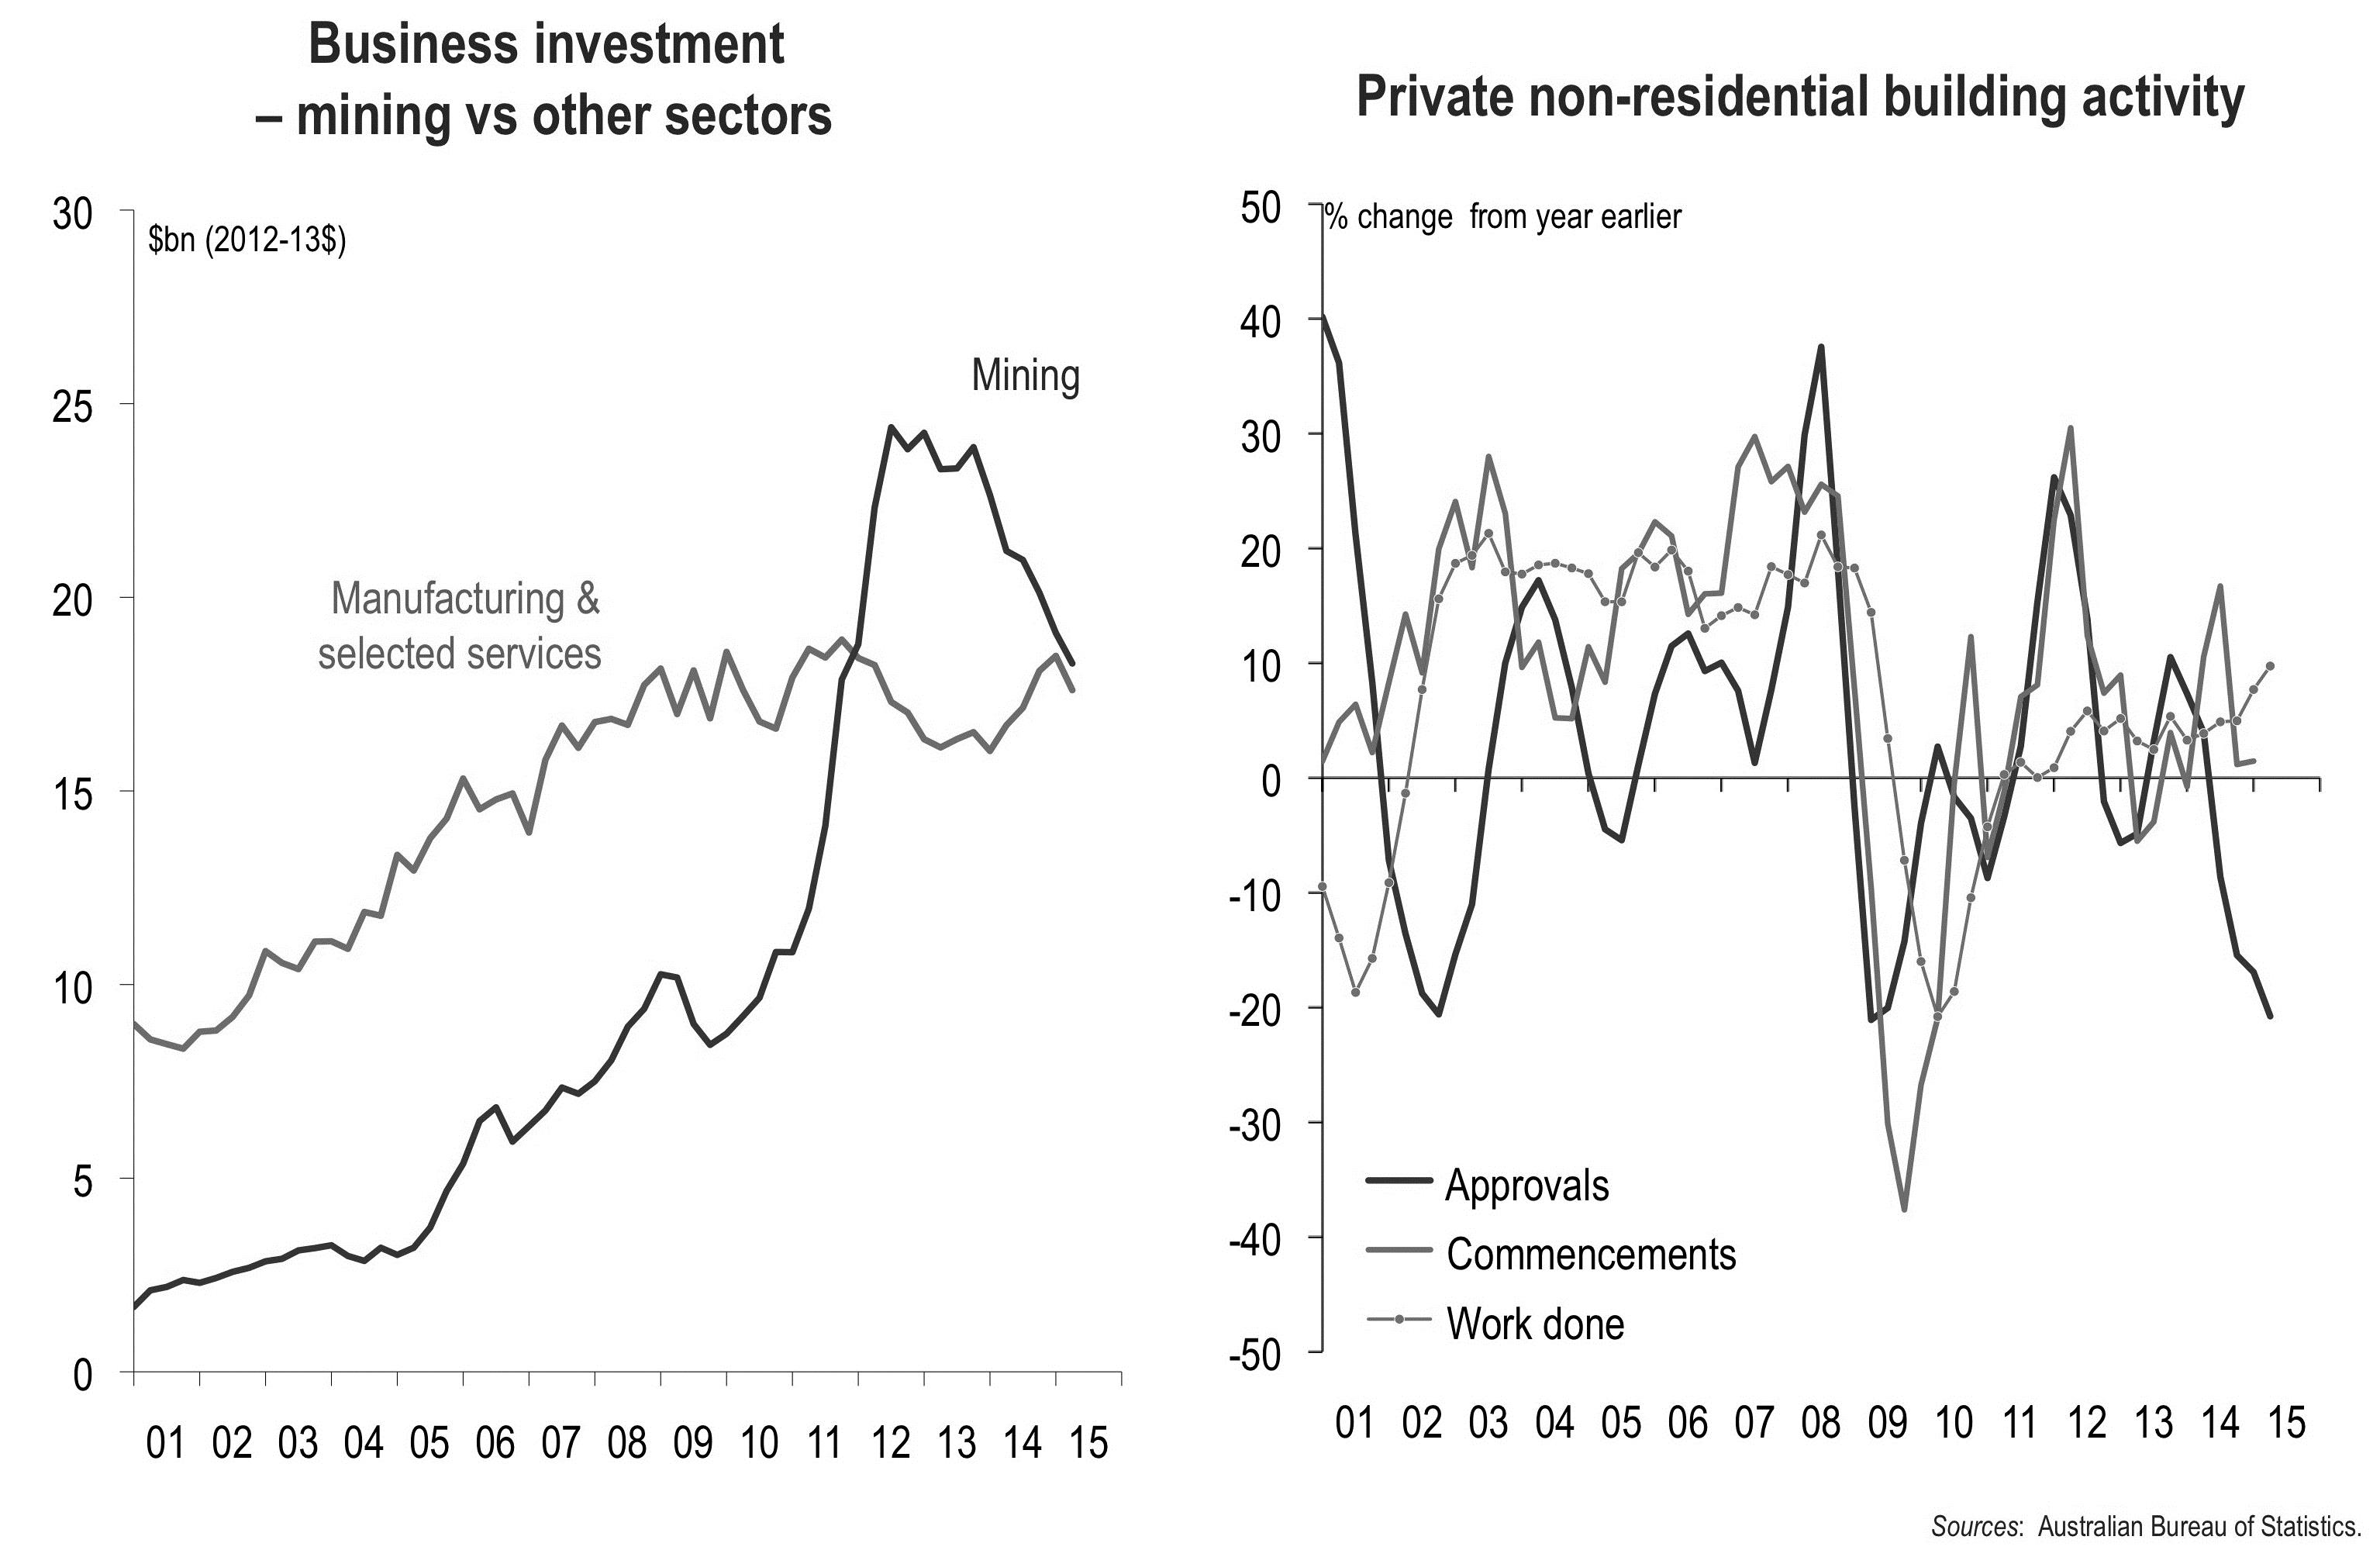
Figure 18: Business investment.
The A$ has now fallen quite a long way – but will fall further as US interest rates begin to rise and commodity prices fall further.
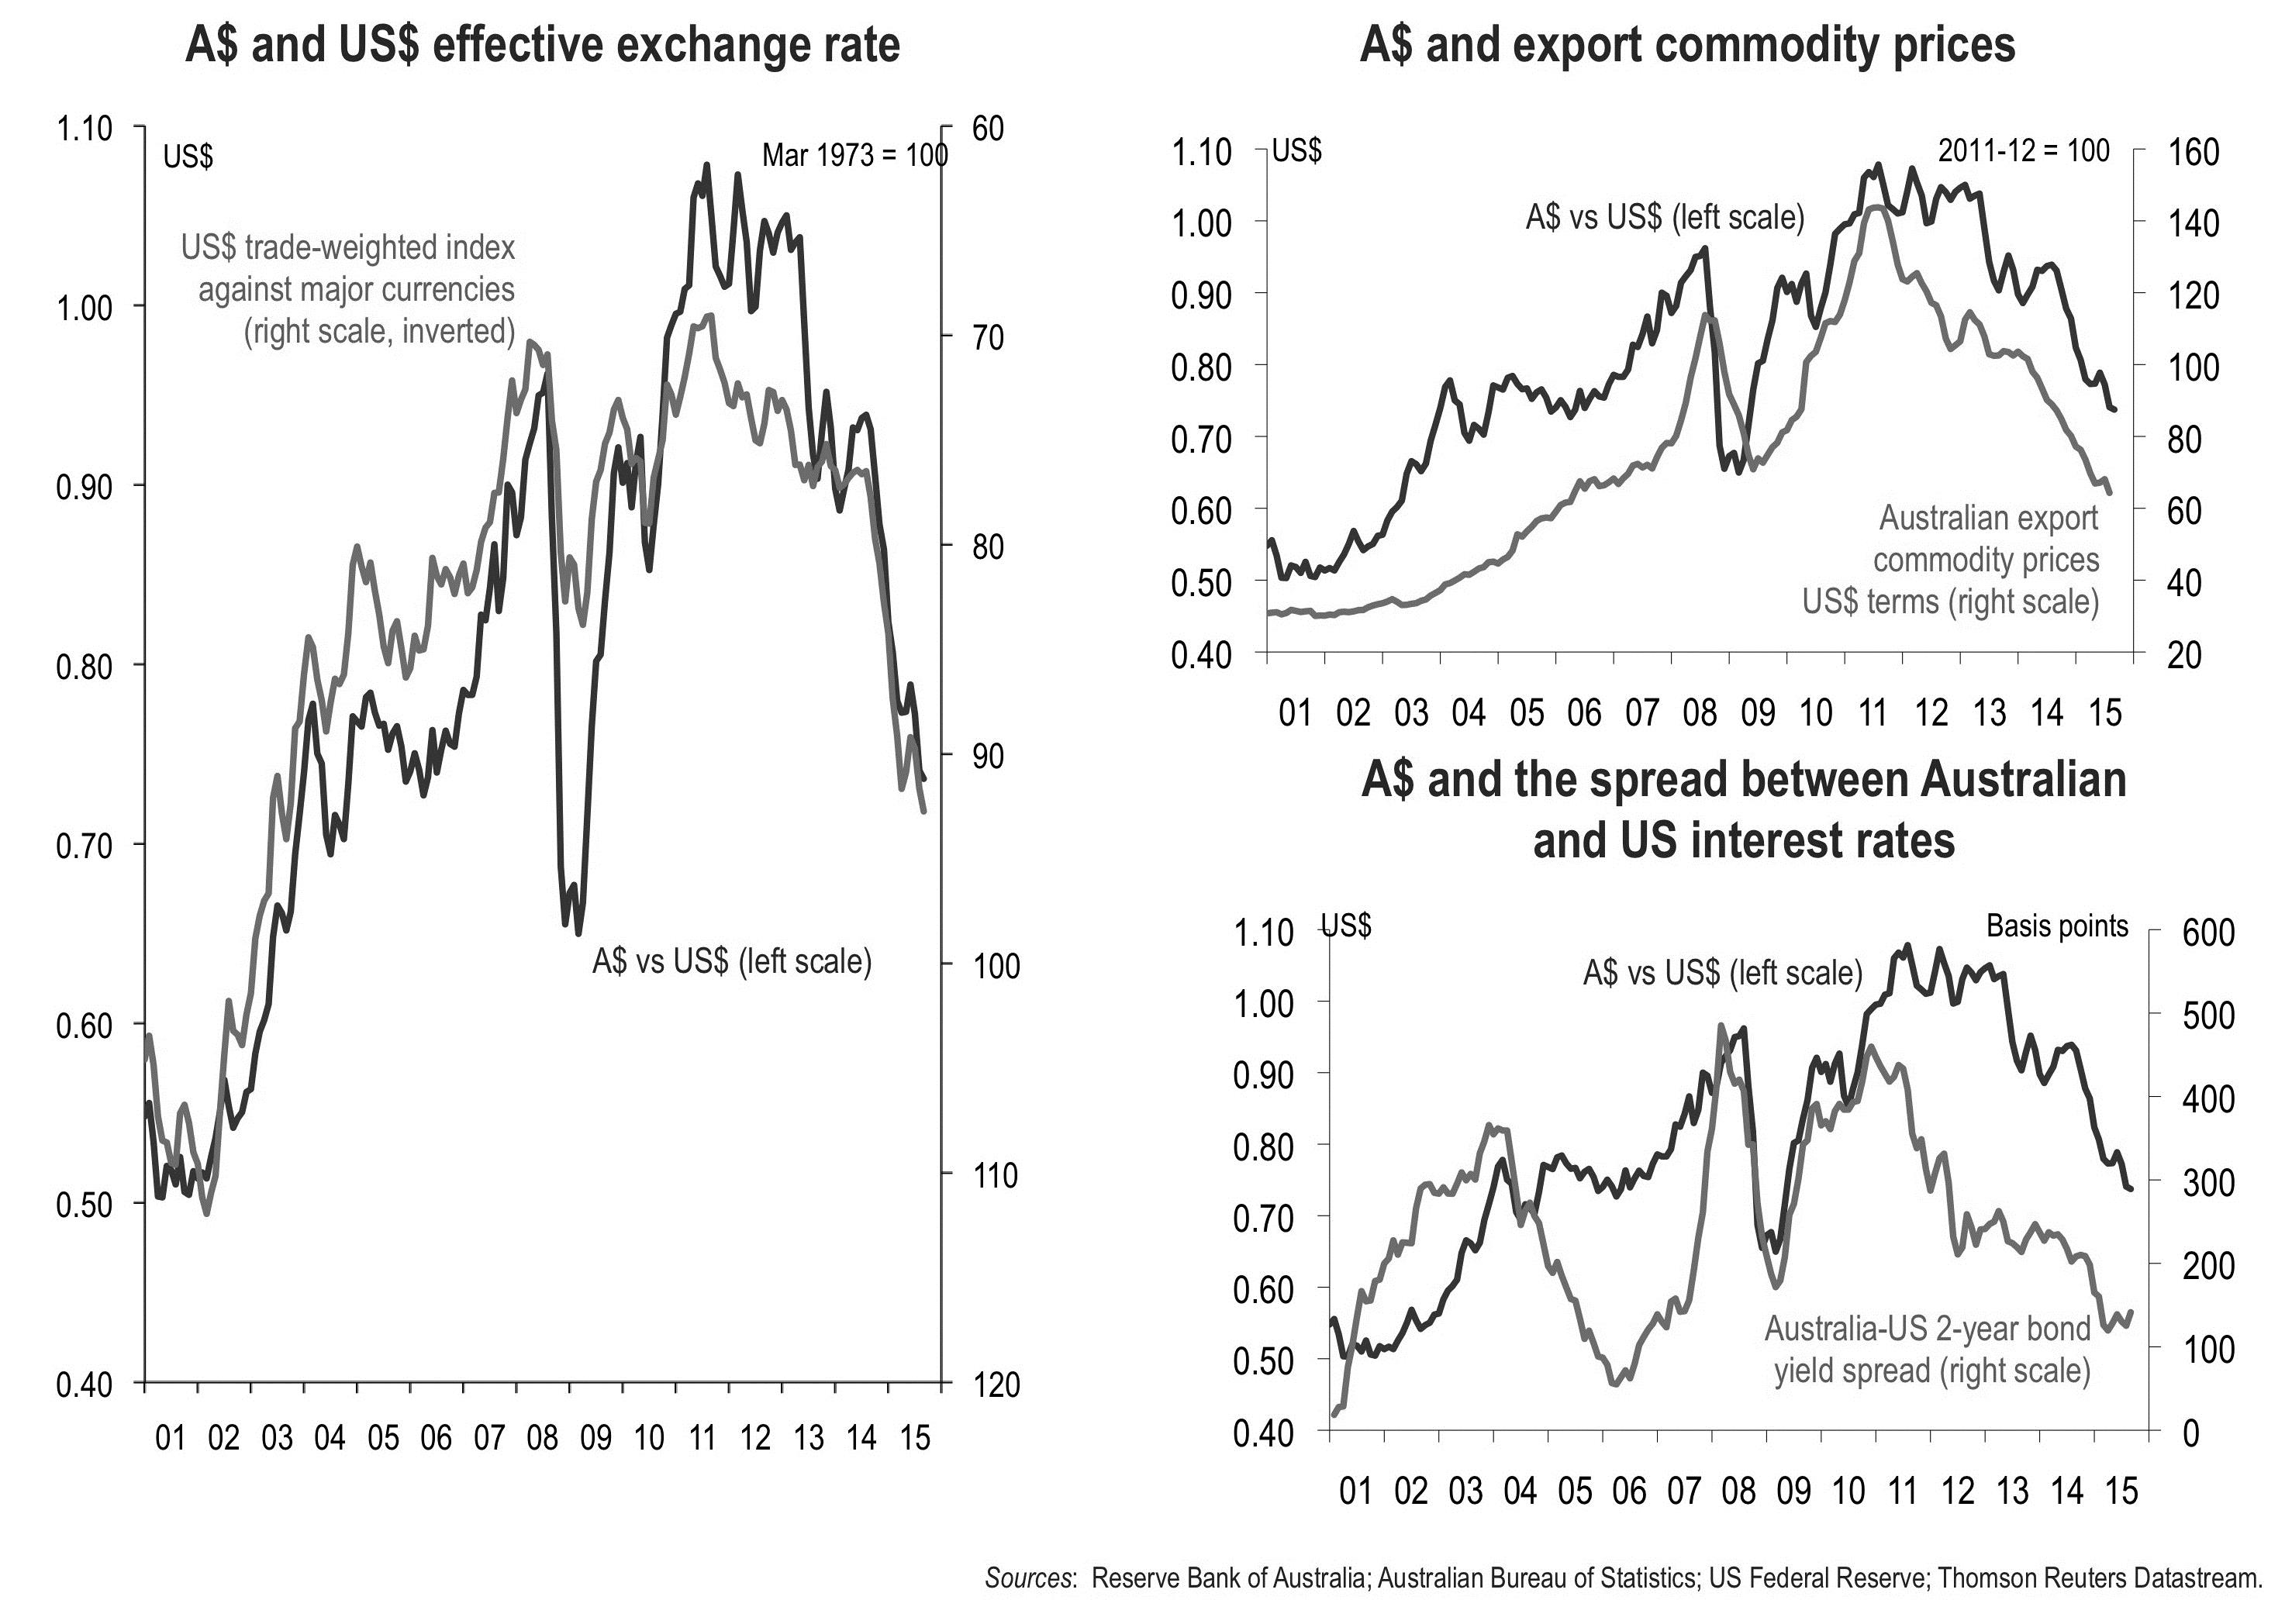
Figure 19: Predictions regarding the A$.
The lower A$ is already had a significant positive impact on the tourism sector.
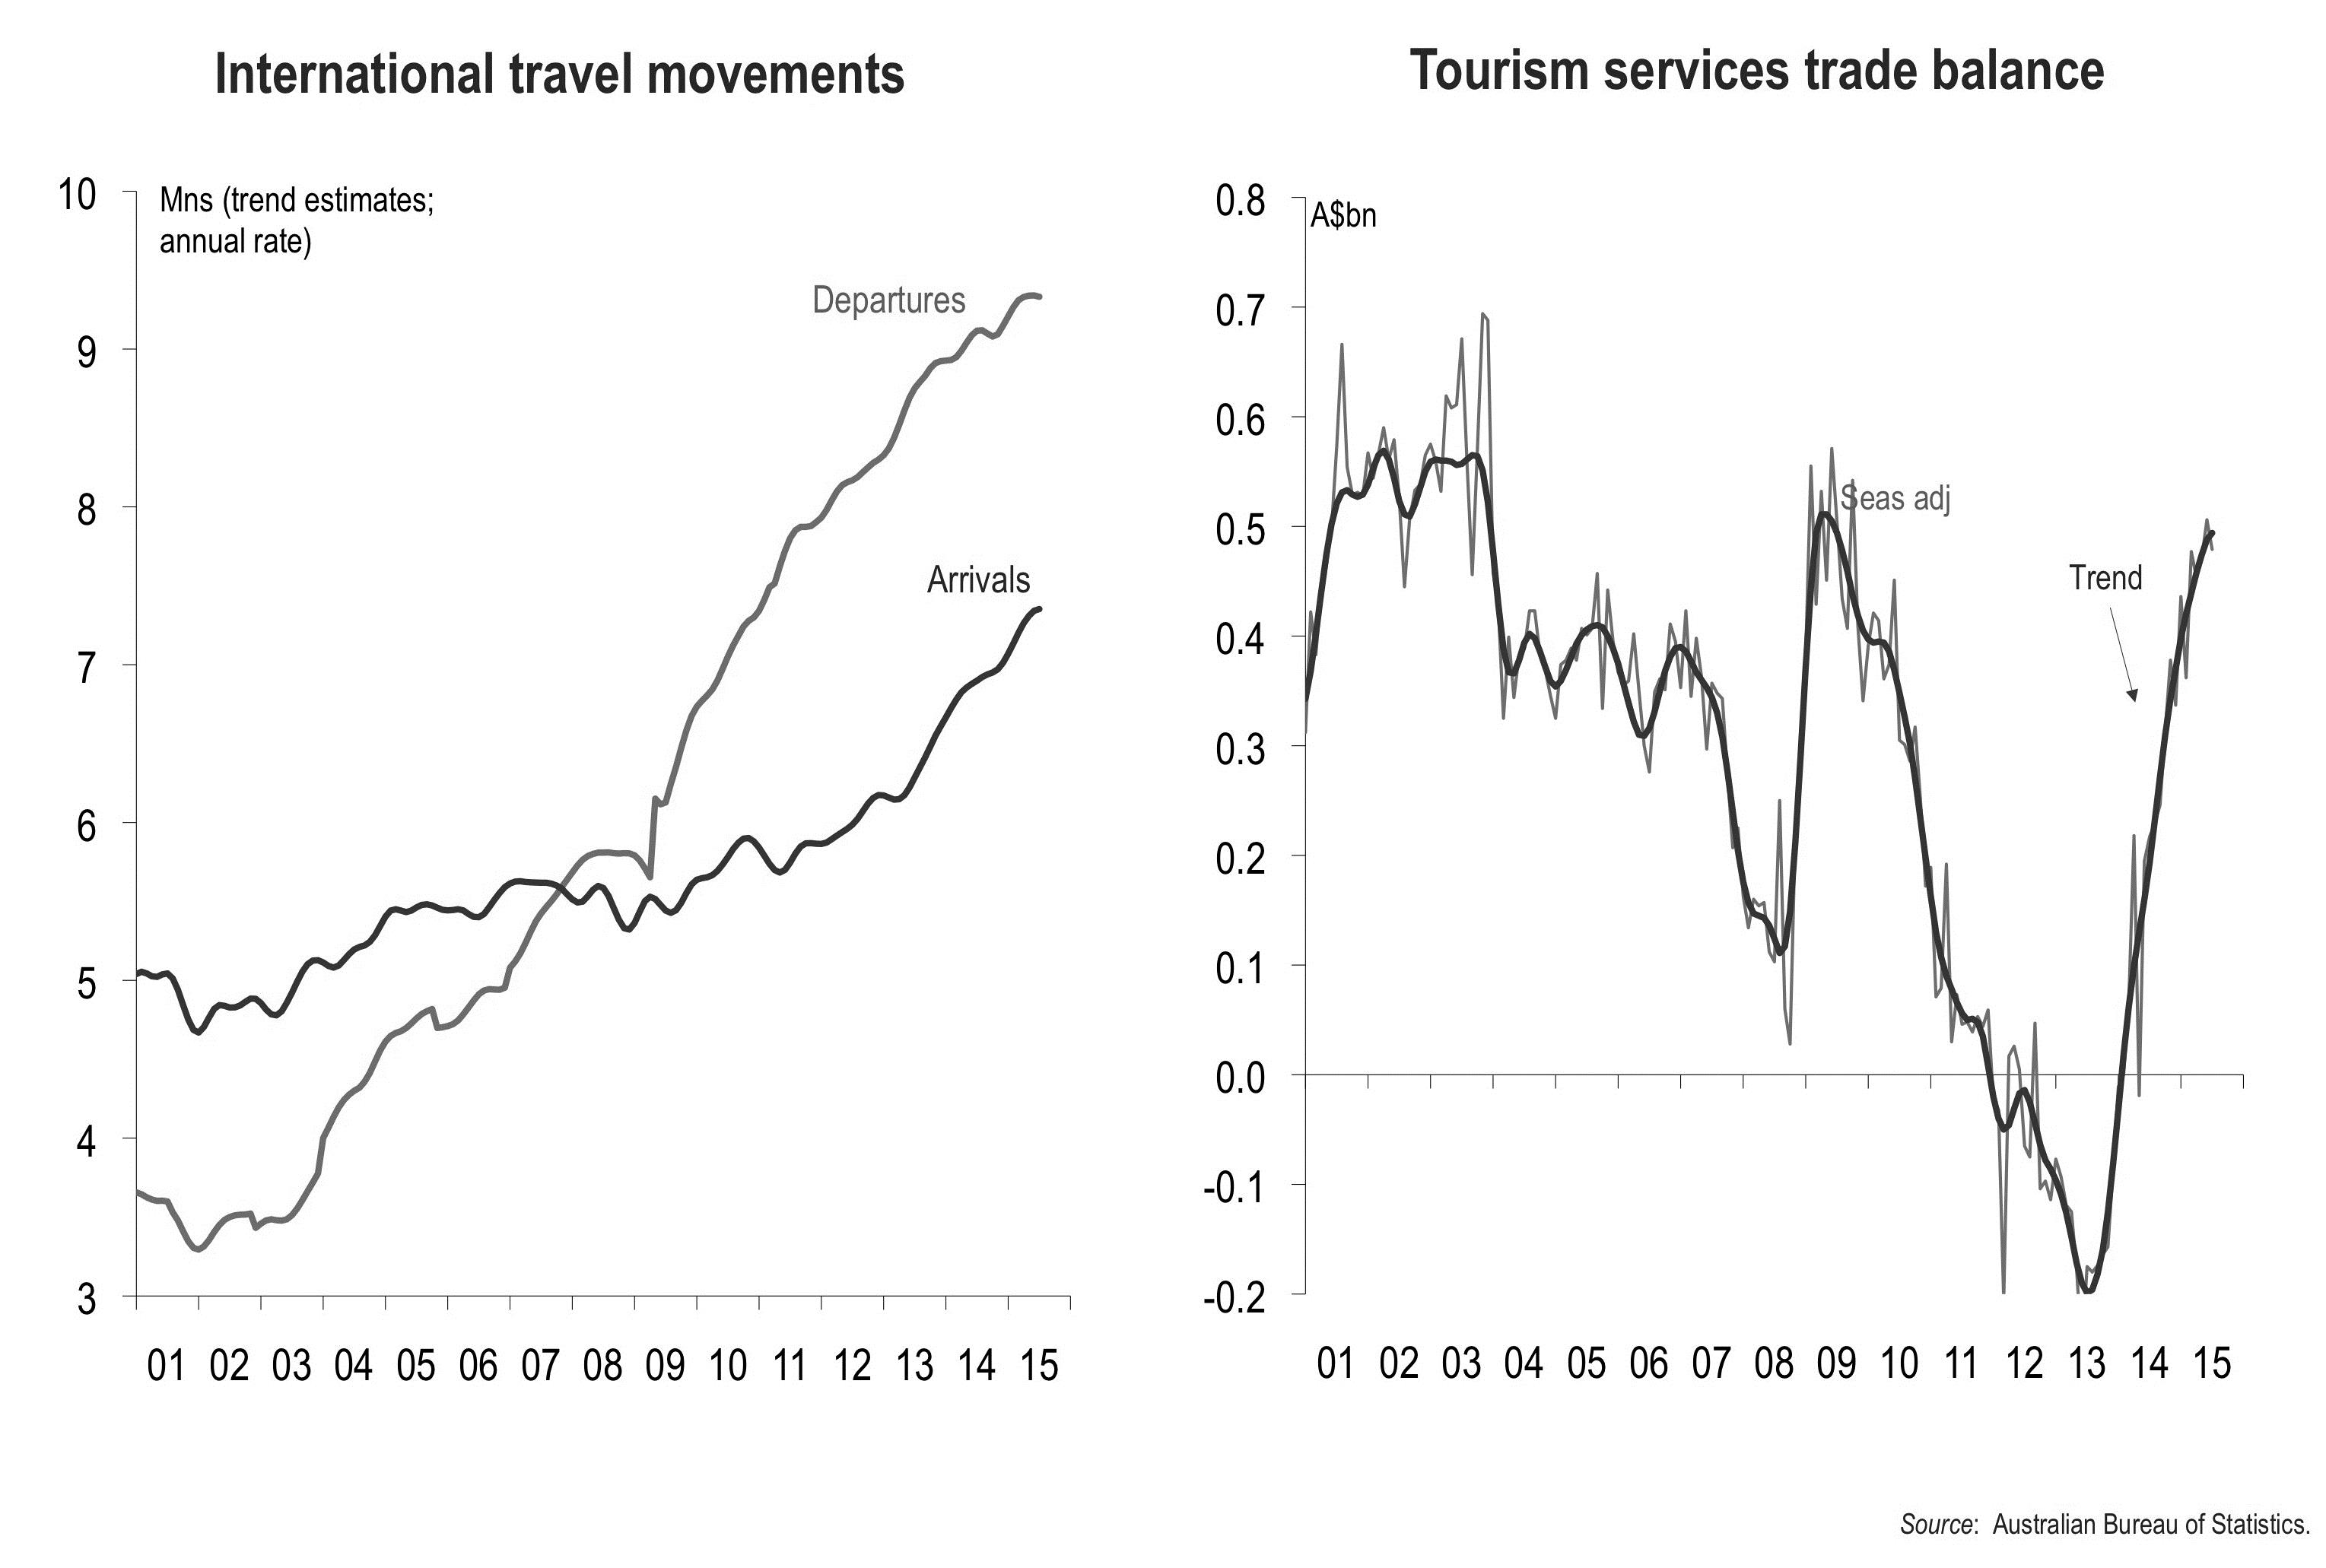
Figure 20. Impact $A has on tourism.
Employment growth is picking up in some of the more labour-intensive sectors of the economy.
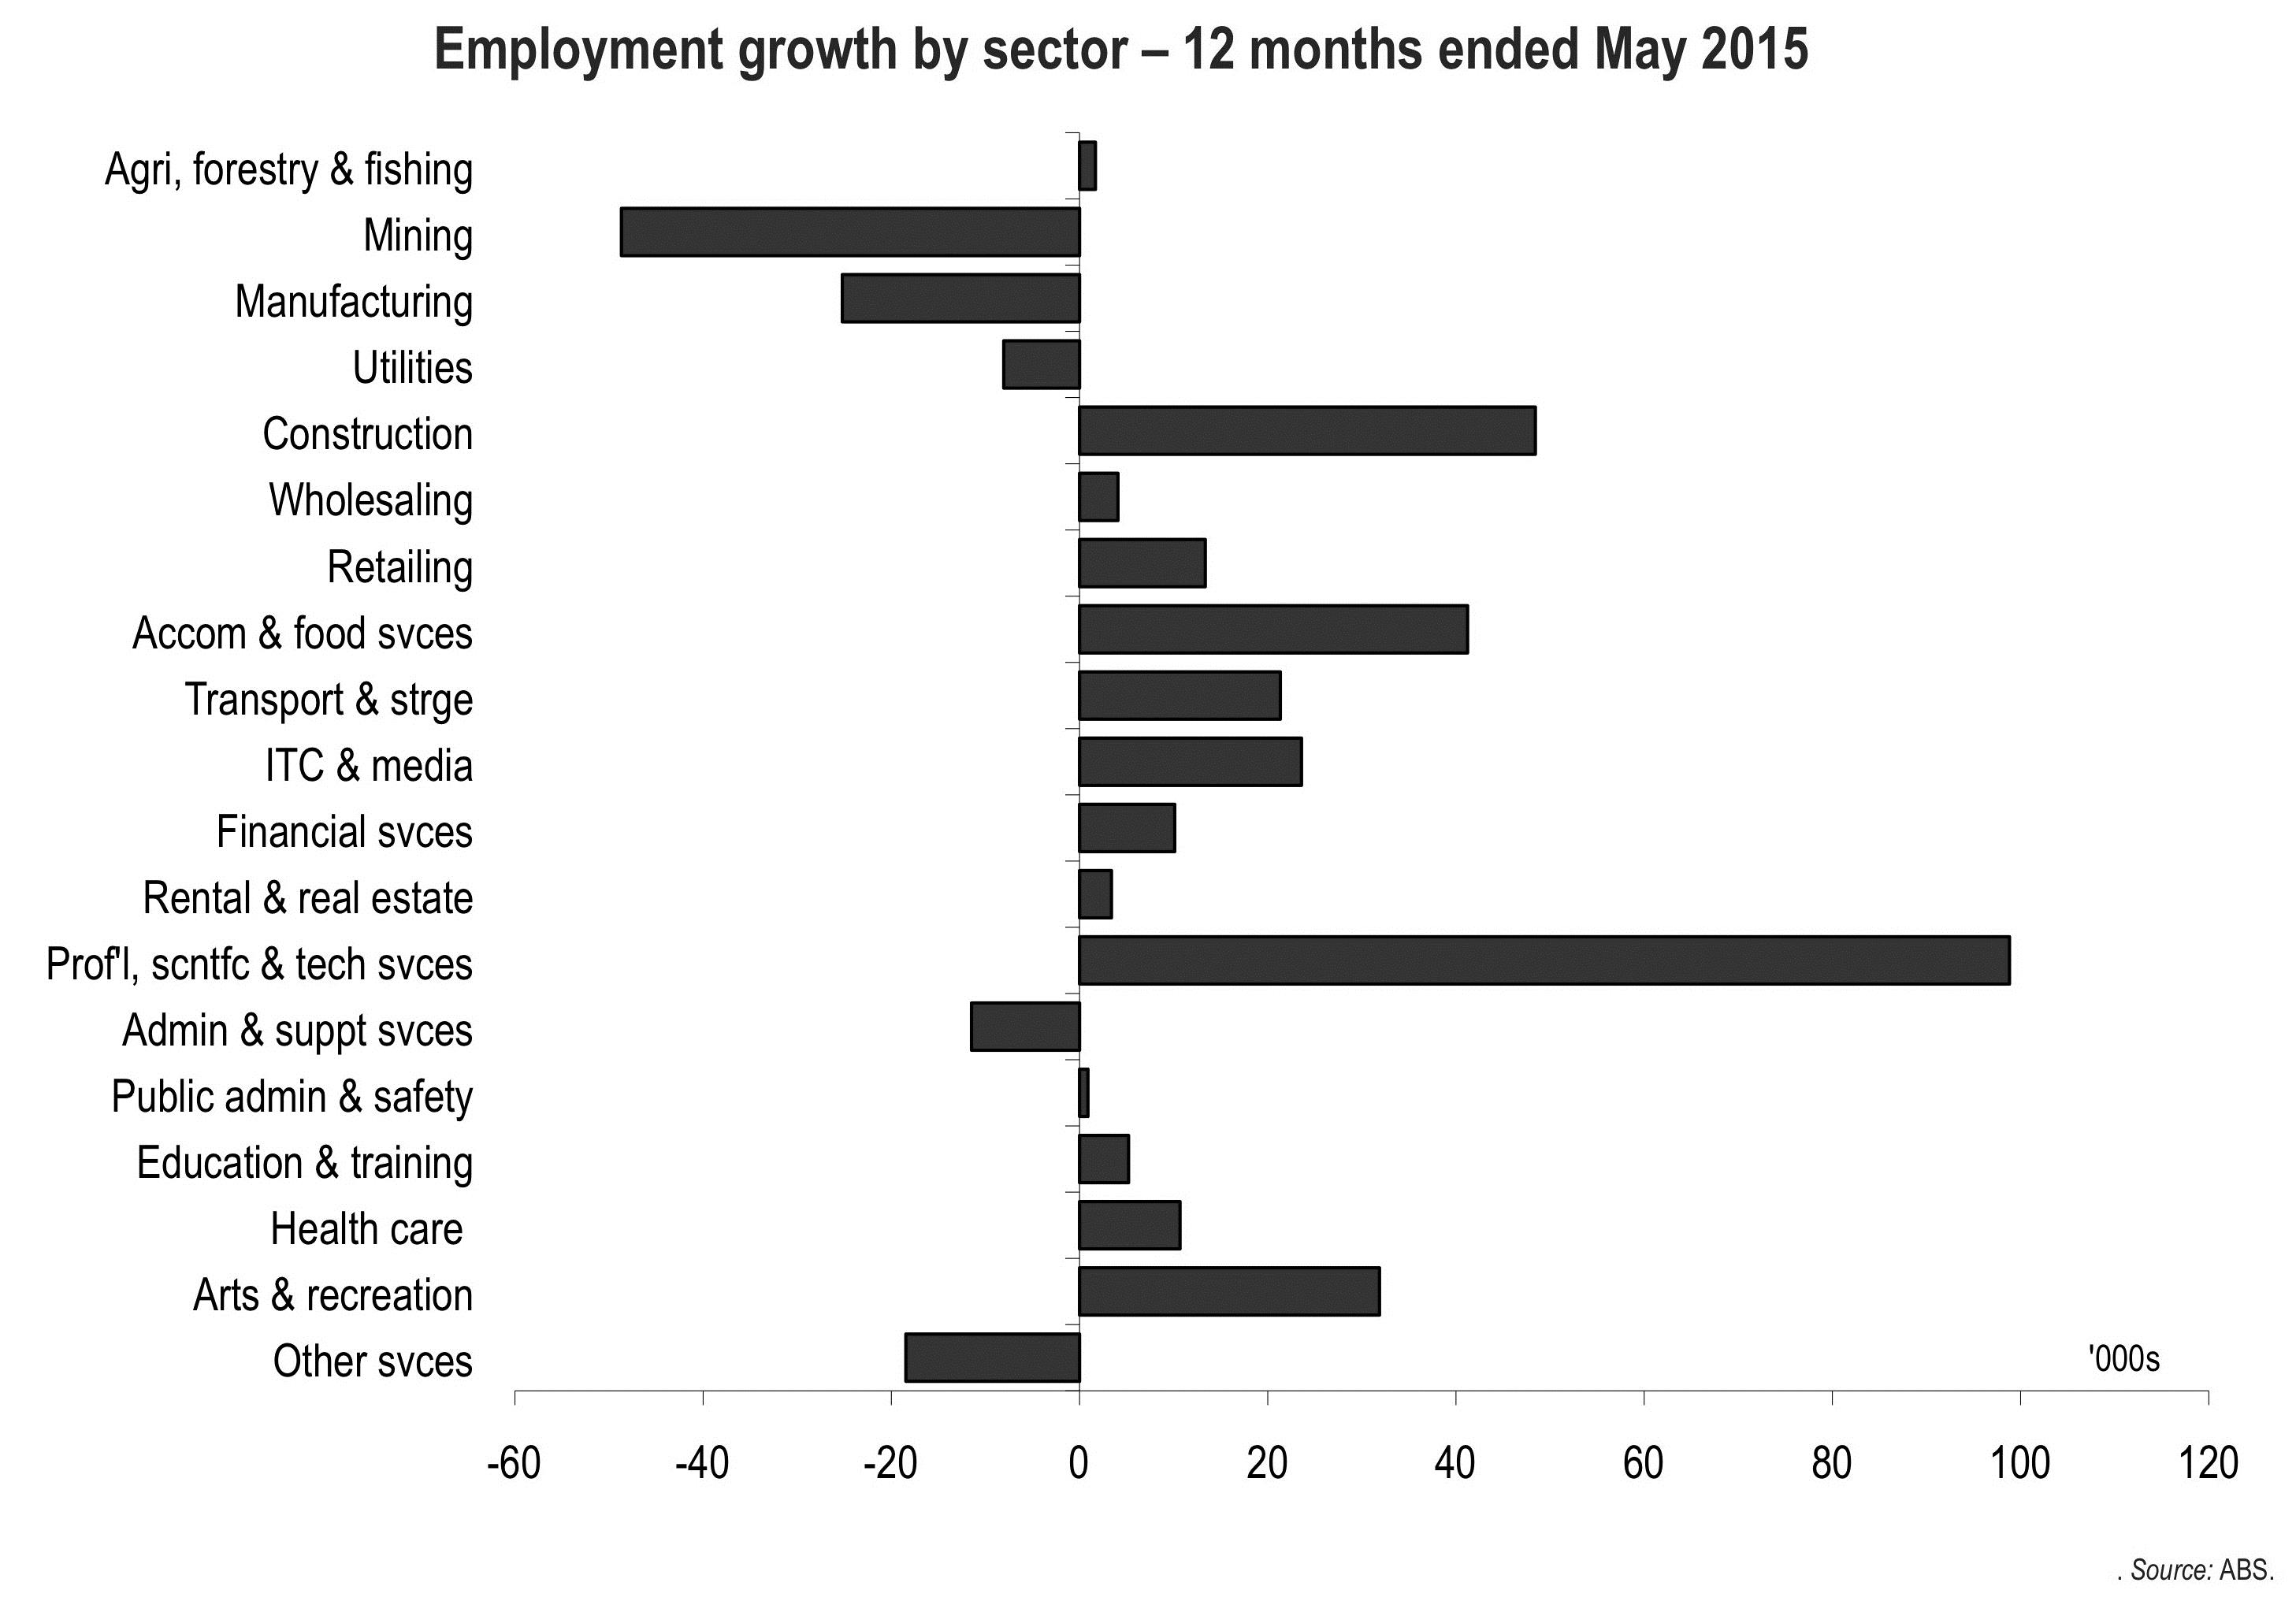
Figure 21: Employment growth by sector (12 months ended May 2015).
Employment growth is picking up, and the unemployment rate may have peaked already despite ongoing slow GDP growth.
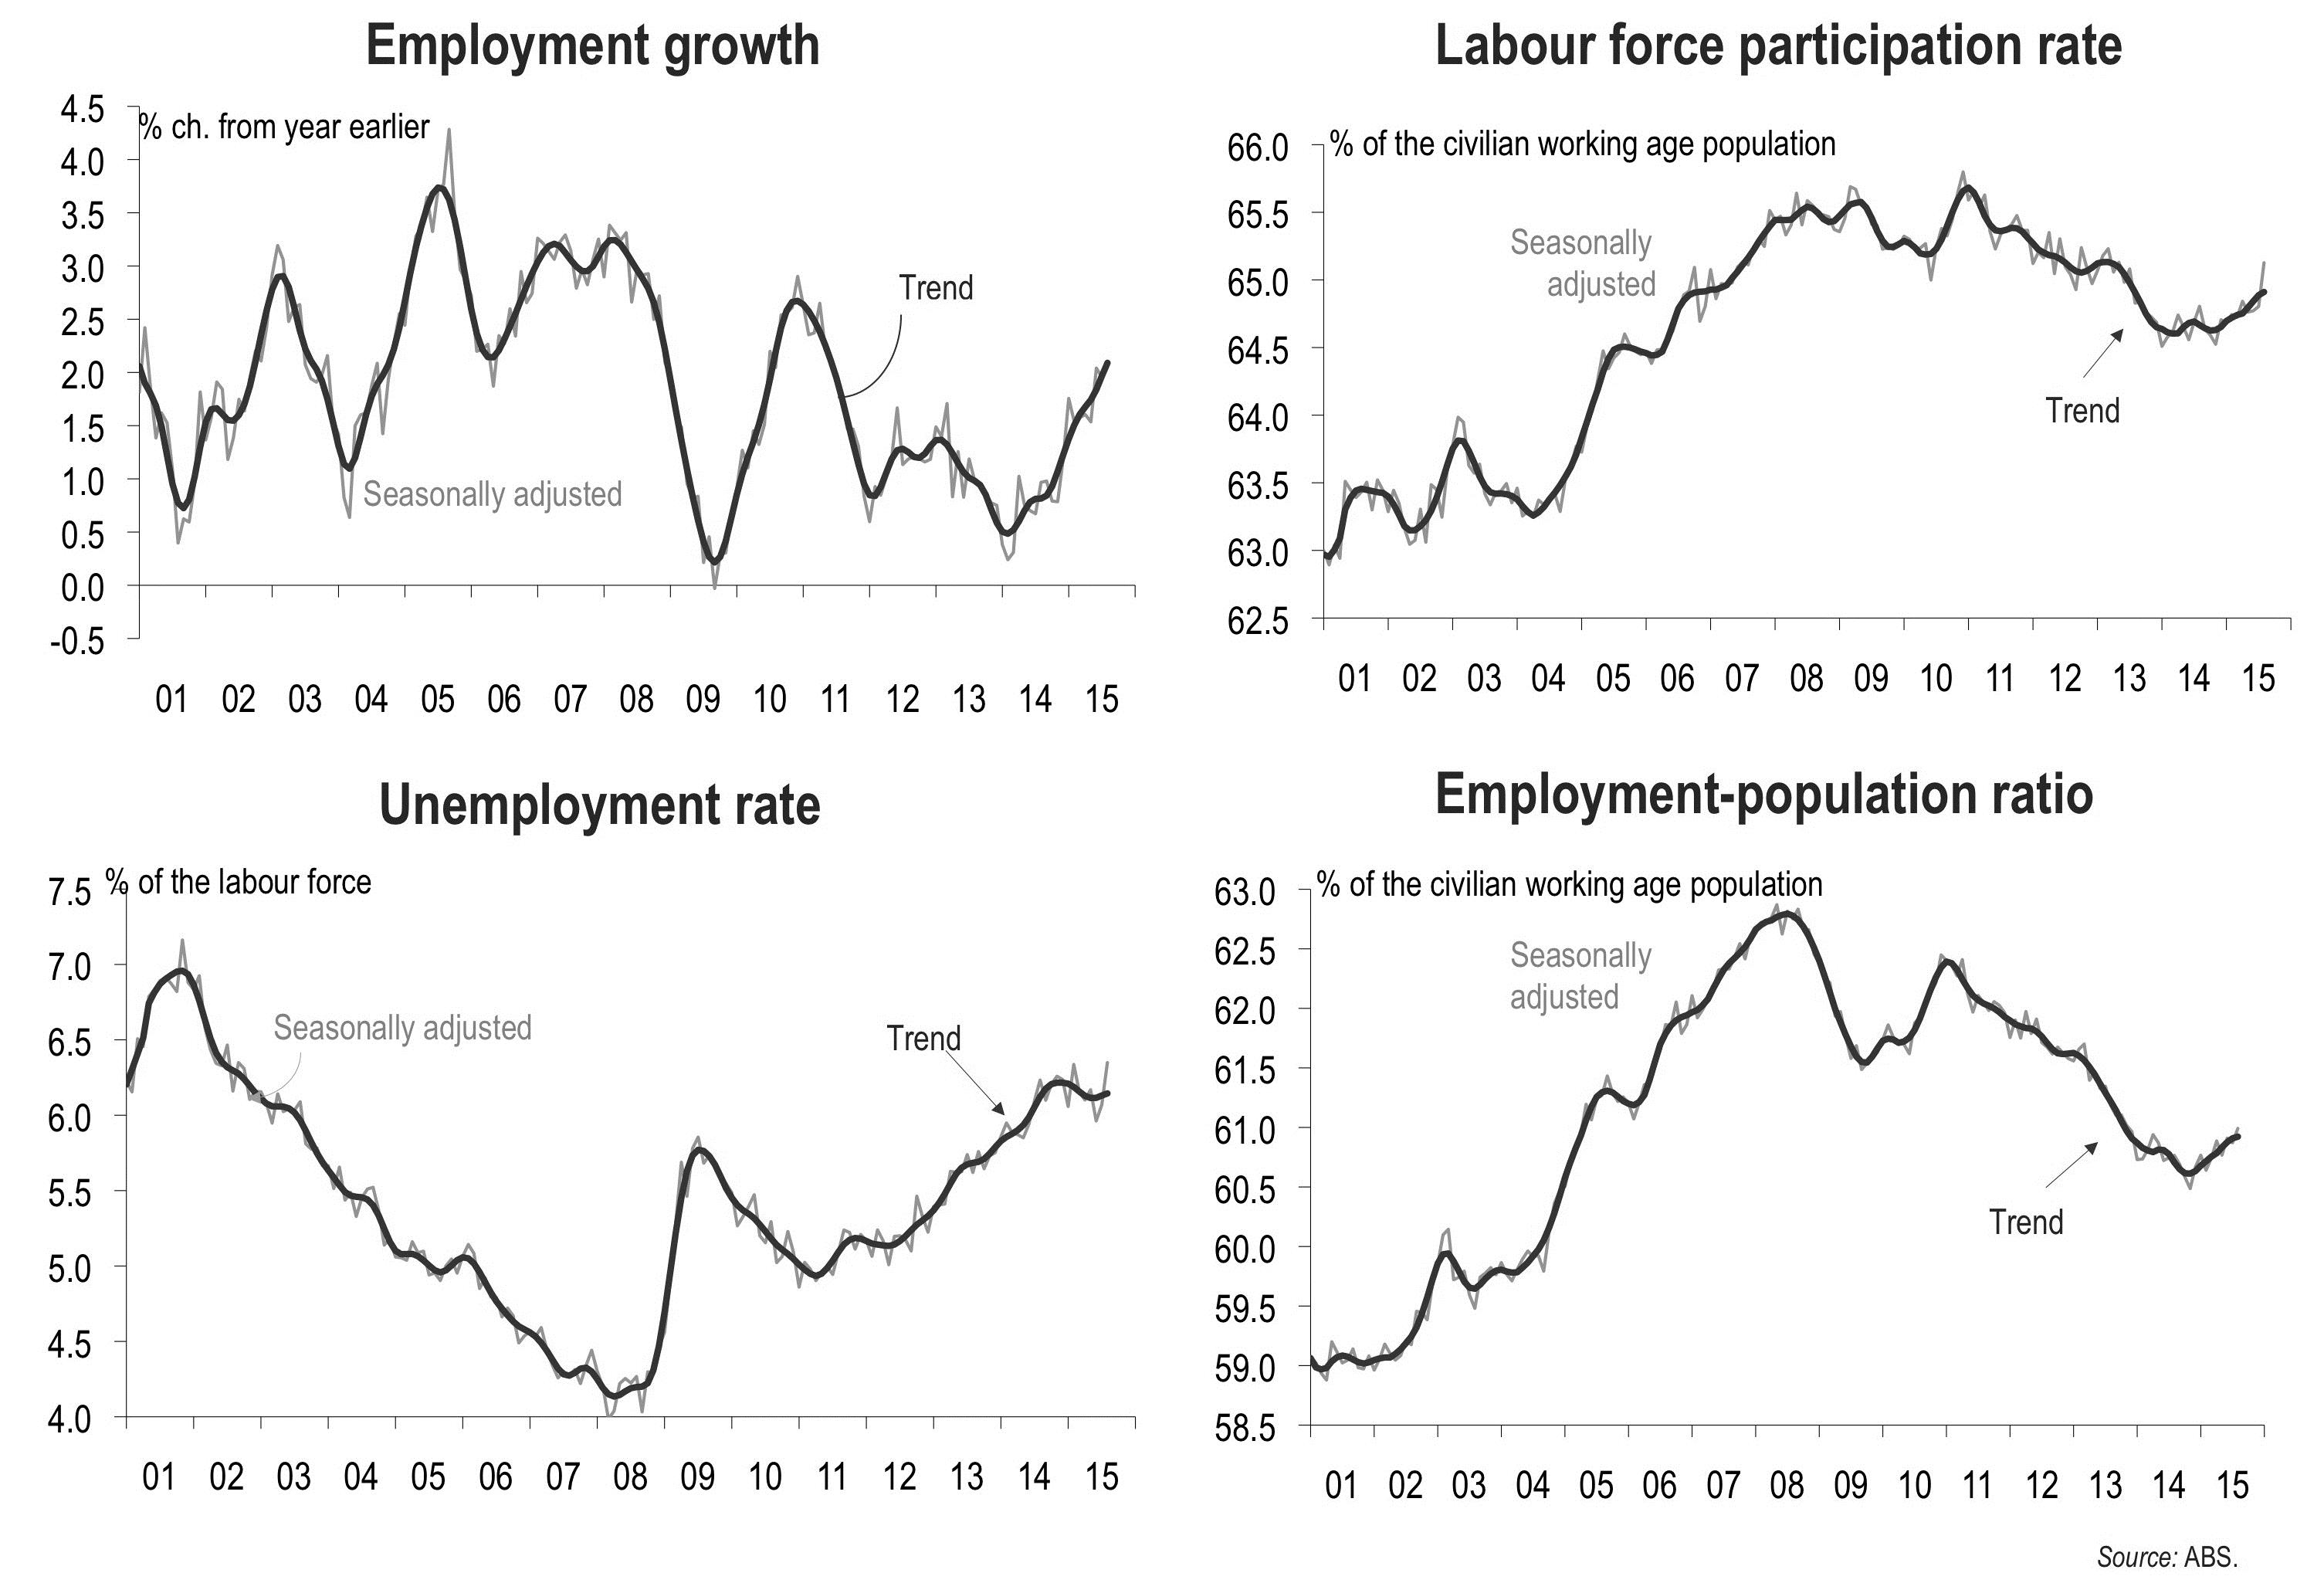
Figure 22: Indicators of employment growth.
Business confidence and forward-looking expectations are also showing some improvement.
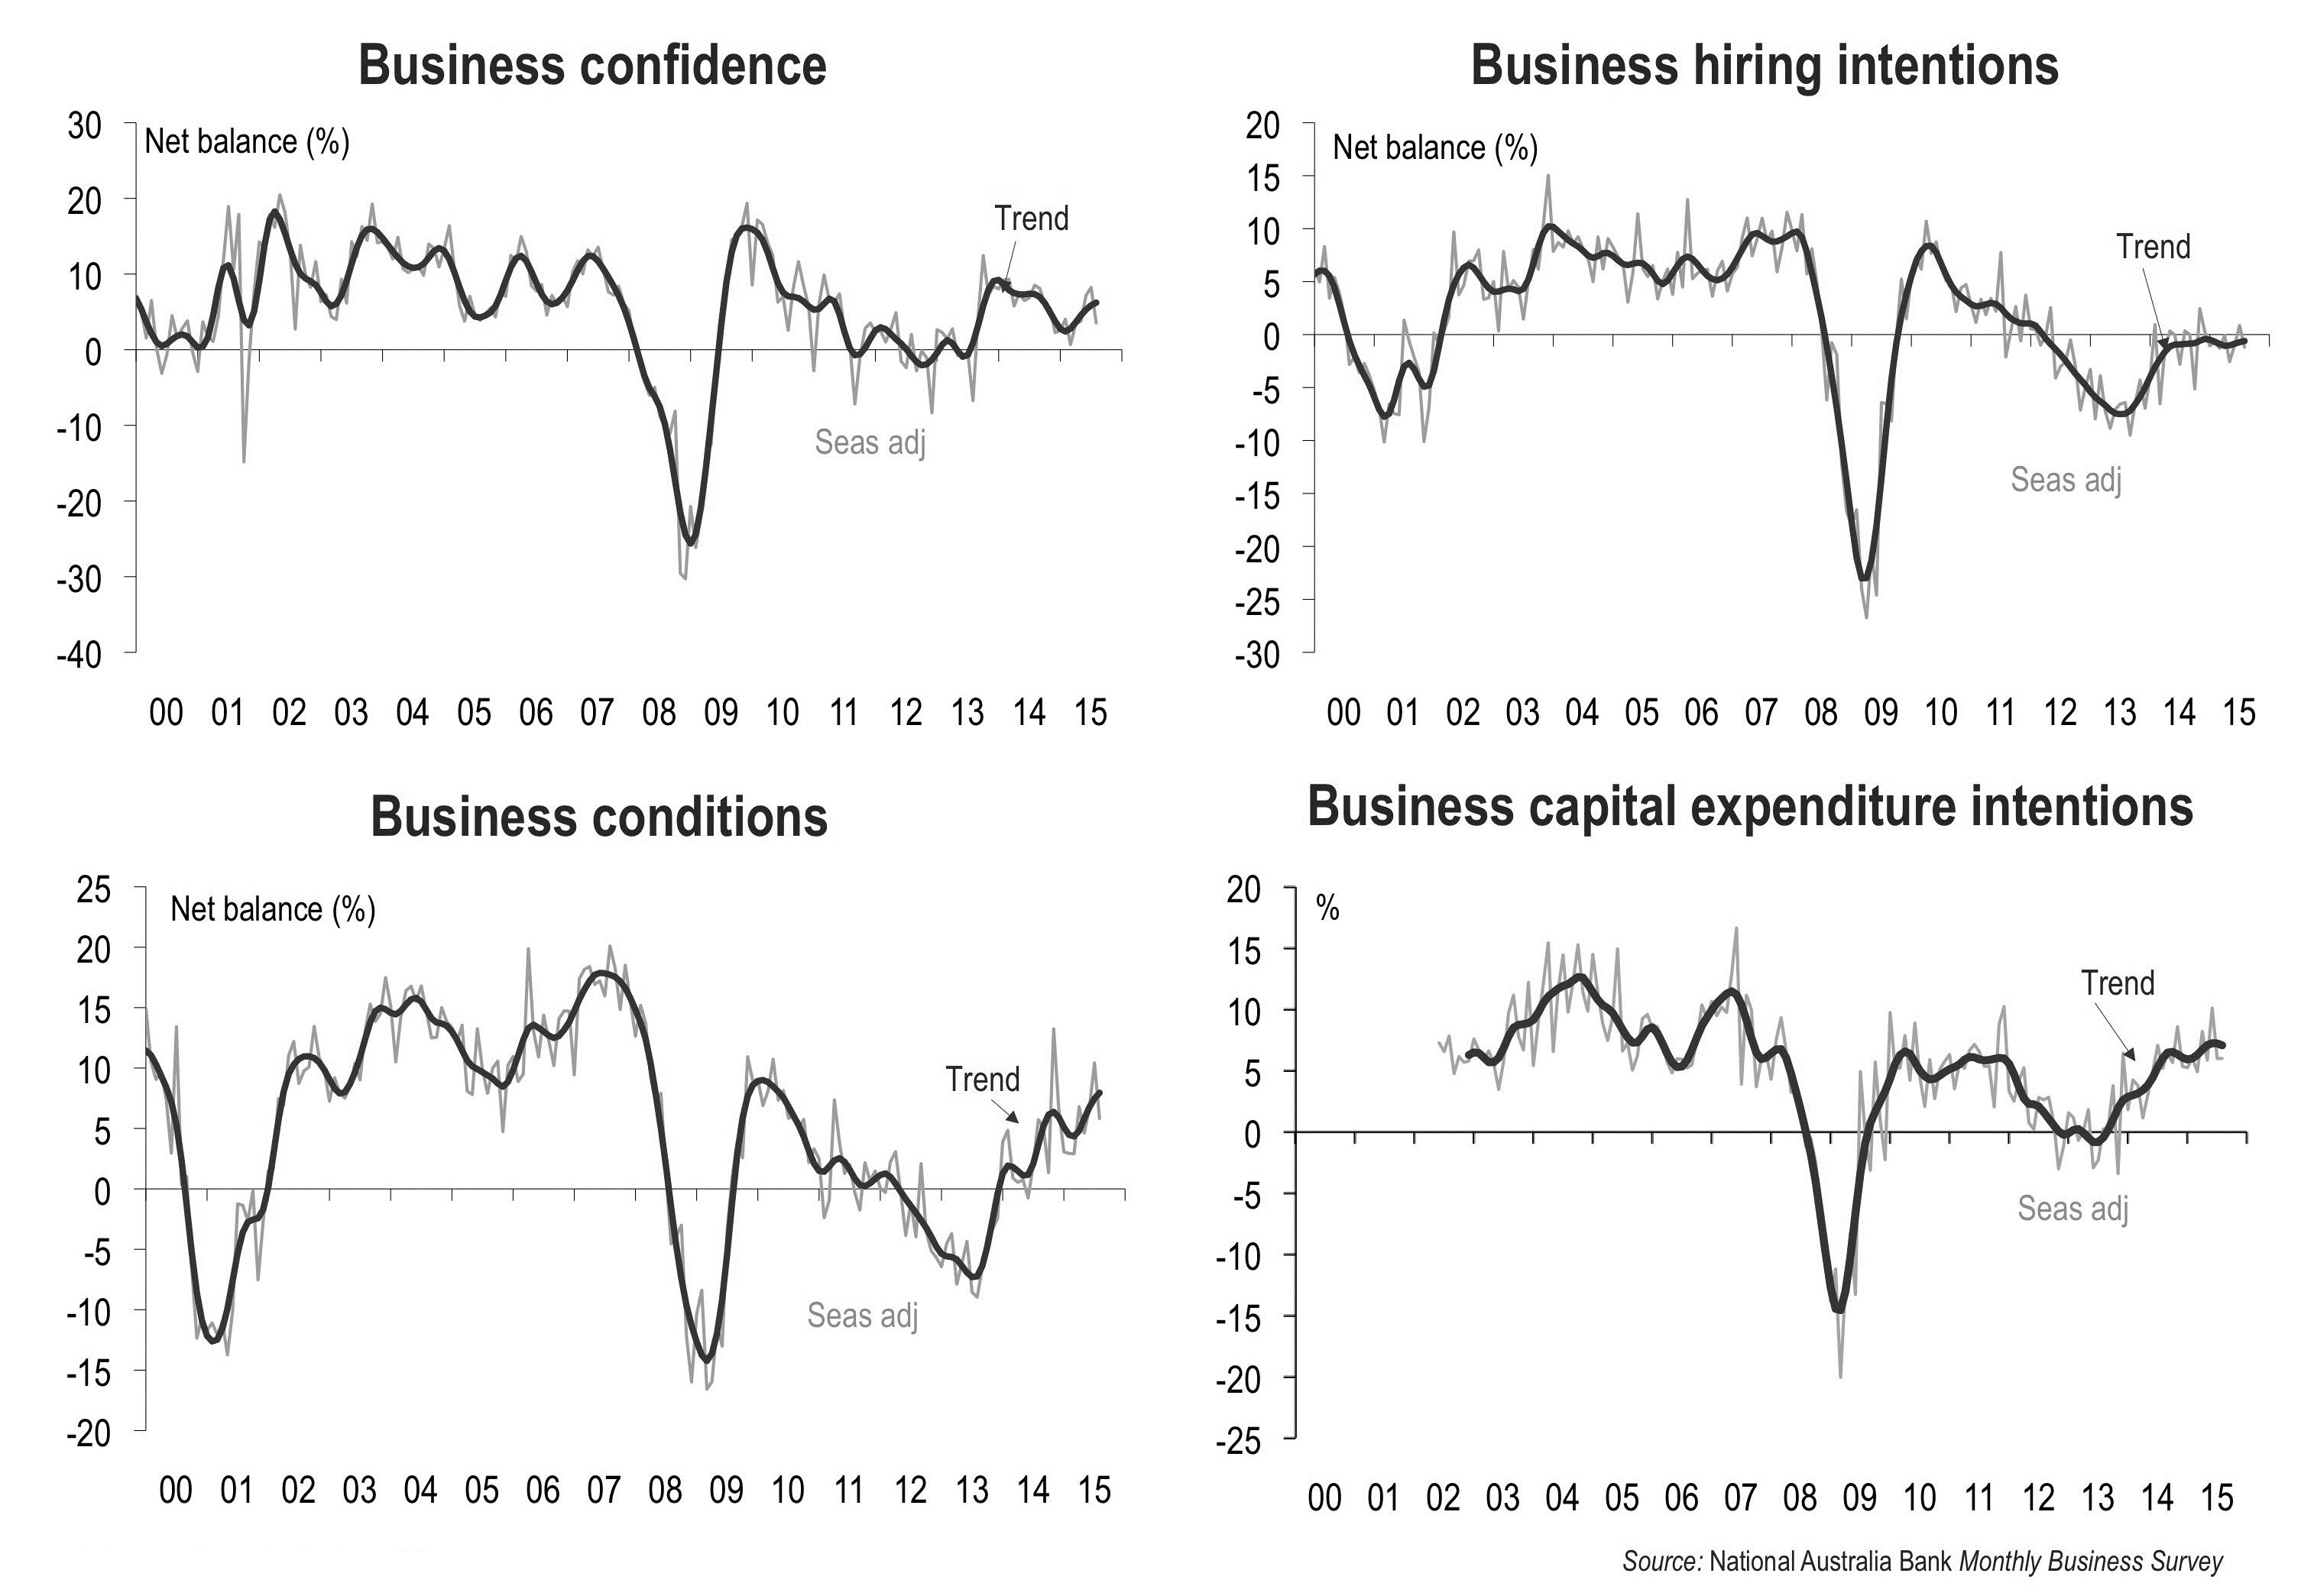
Figure 23: Indicators of business confidence.
Australia could borrow more in order to fund increased public infrastructure investment – but governments don’t want to.
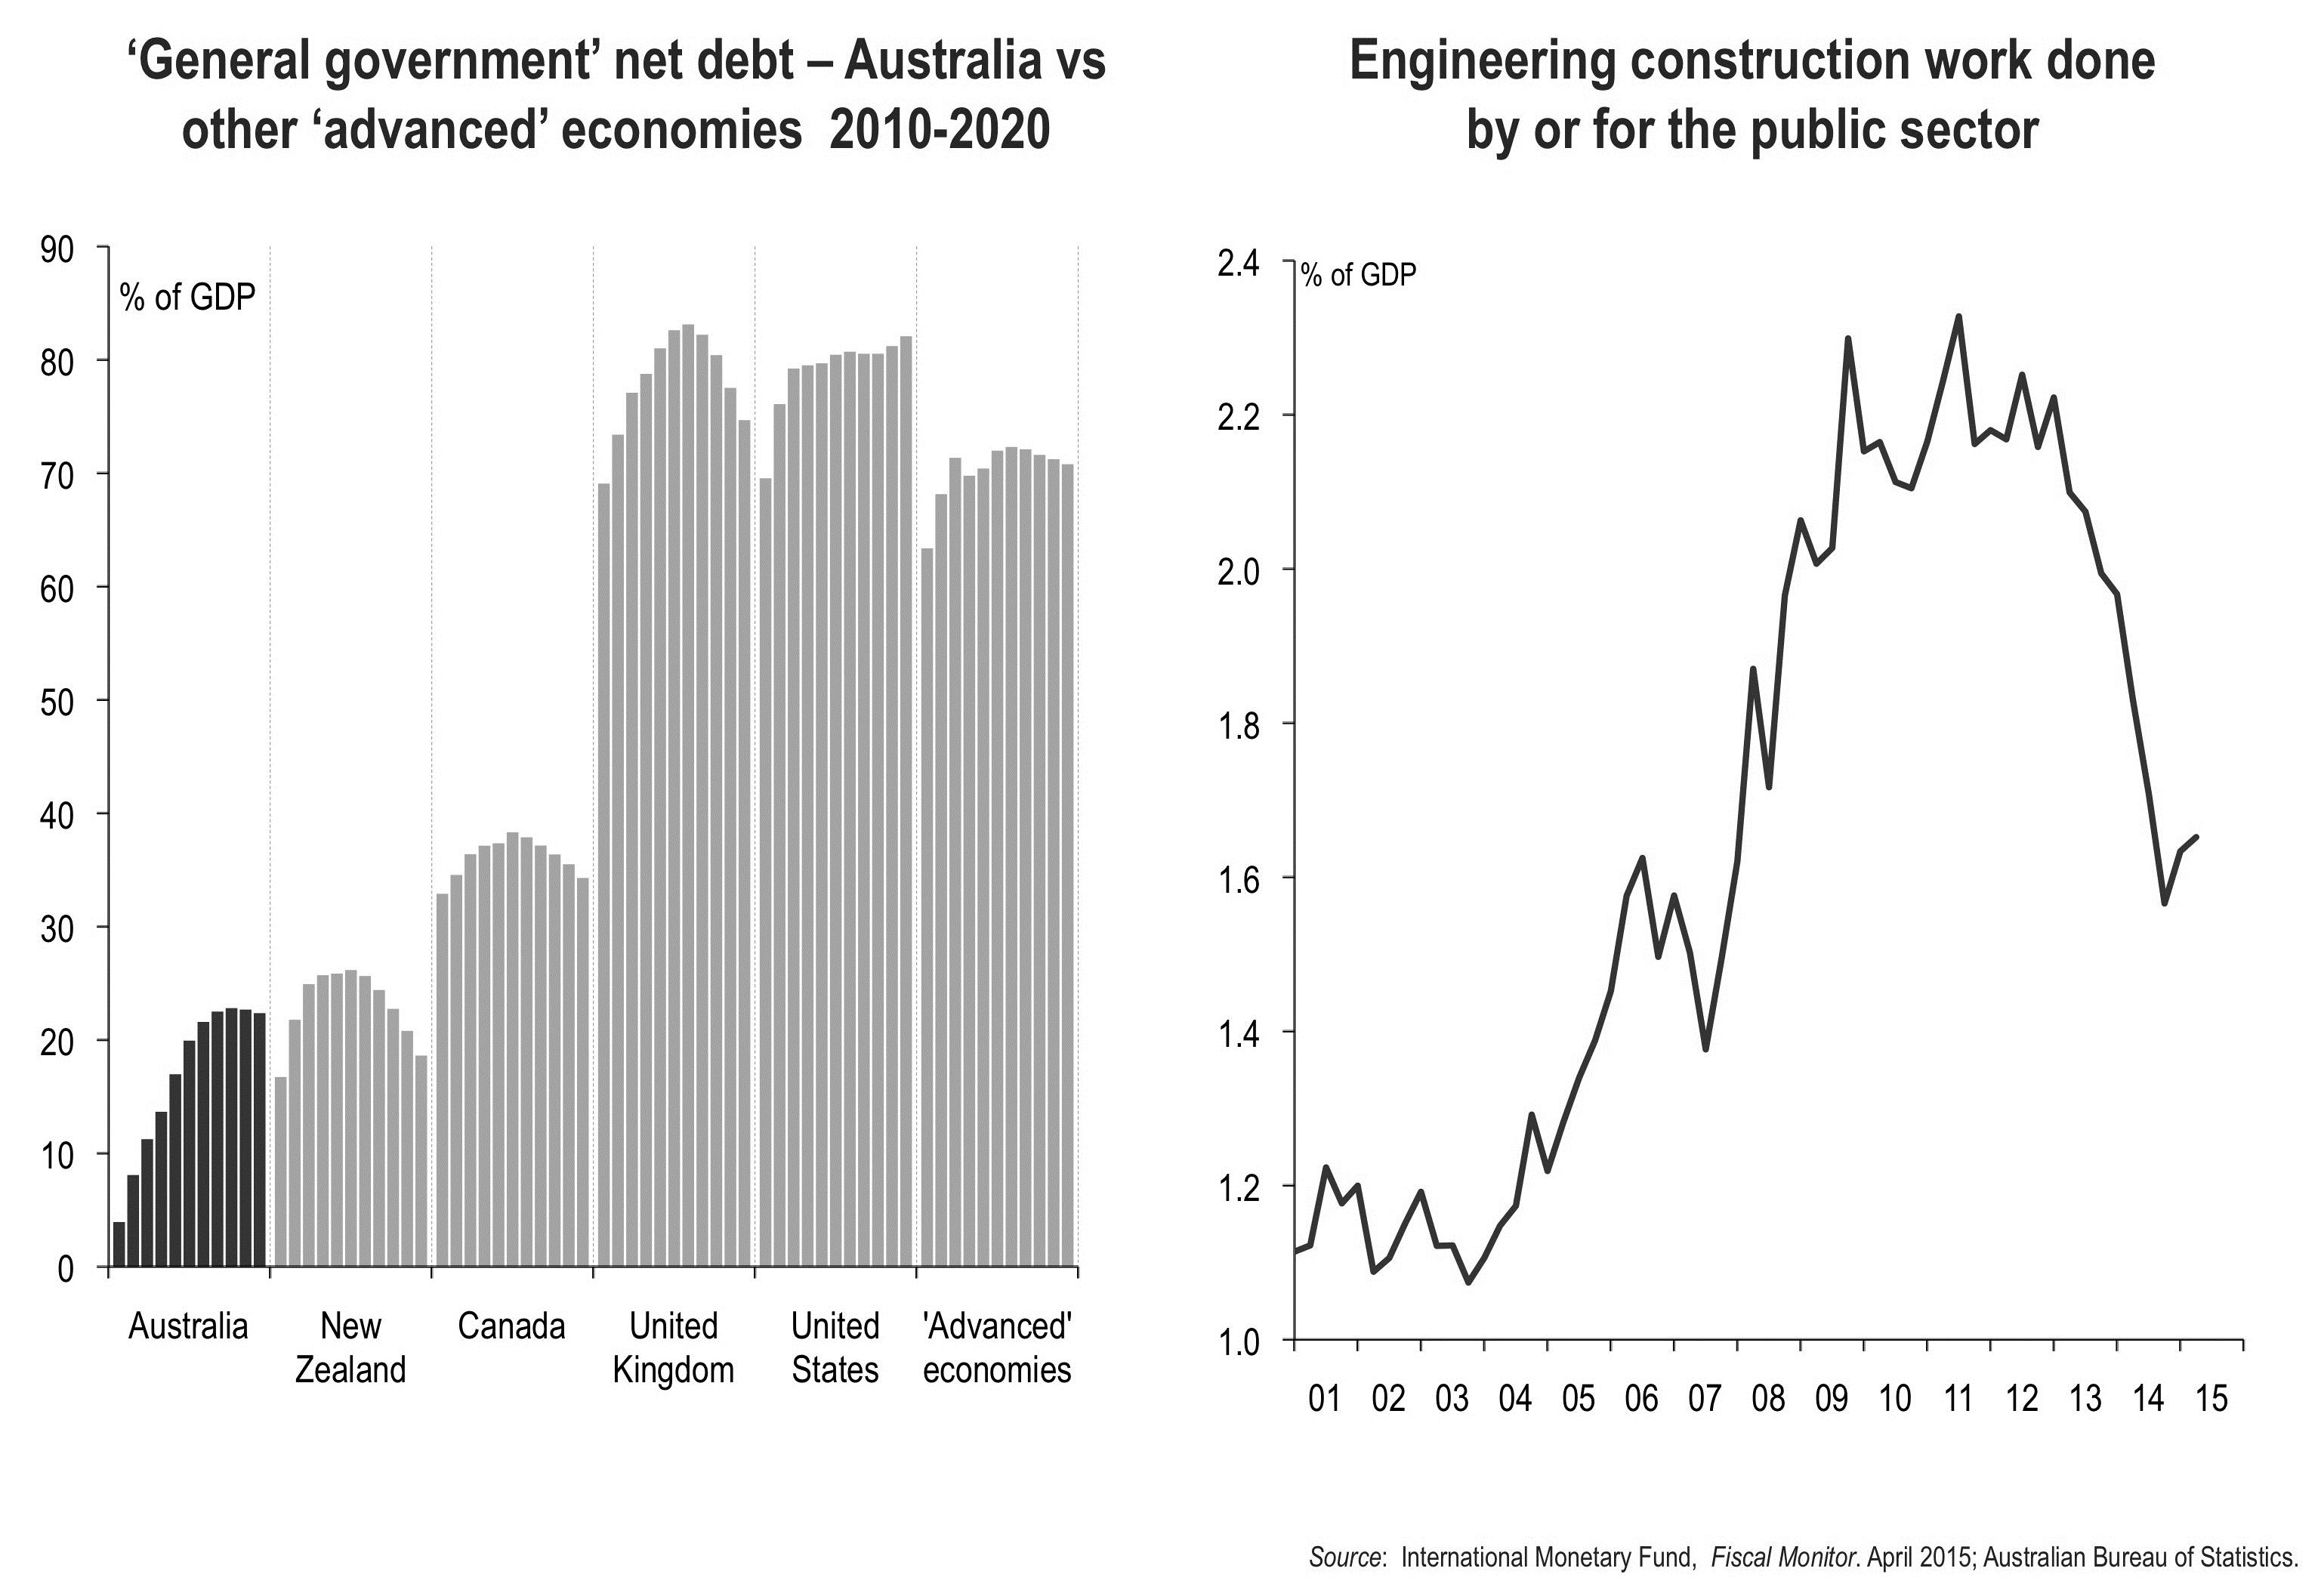
Figure 24(a): Australian government debt compared with other countries and (b): Government investment in public infrastructure.
If the unemployment rate really has peaked, then the RBA won’t lower the cash rate any more, and could lift rates next year.
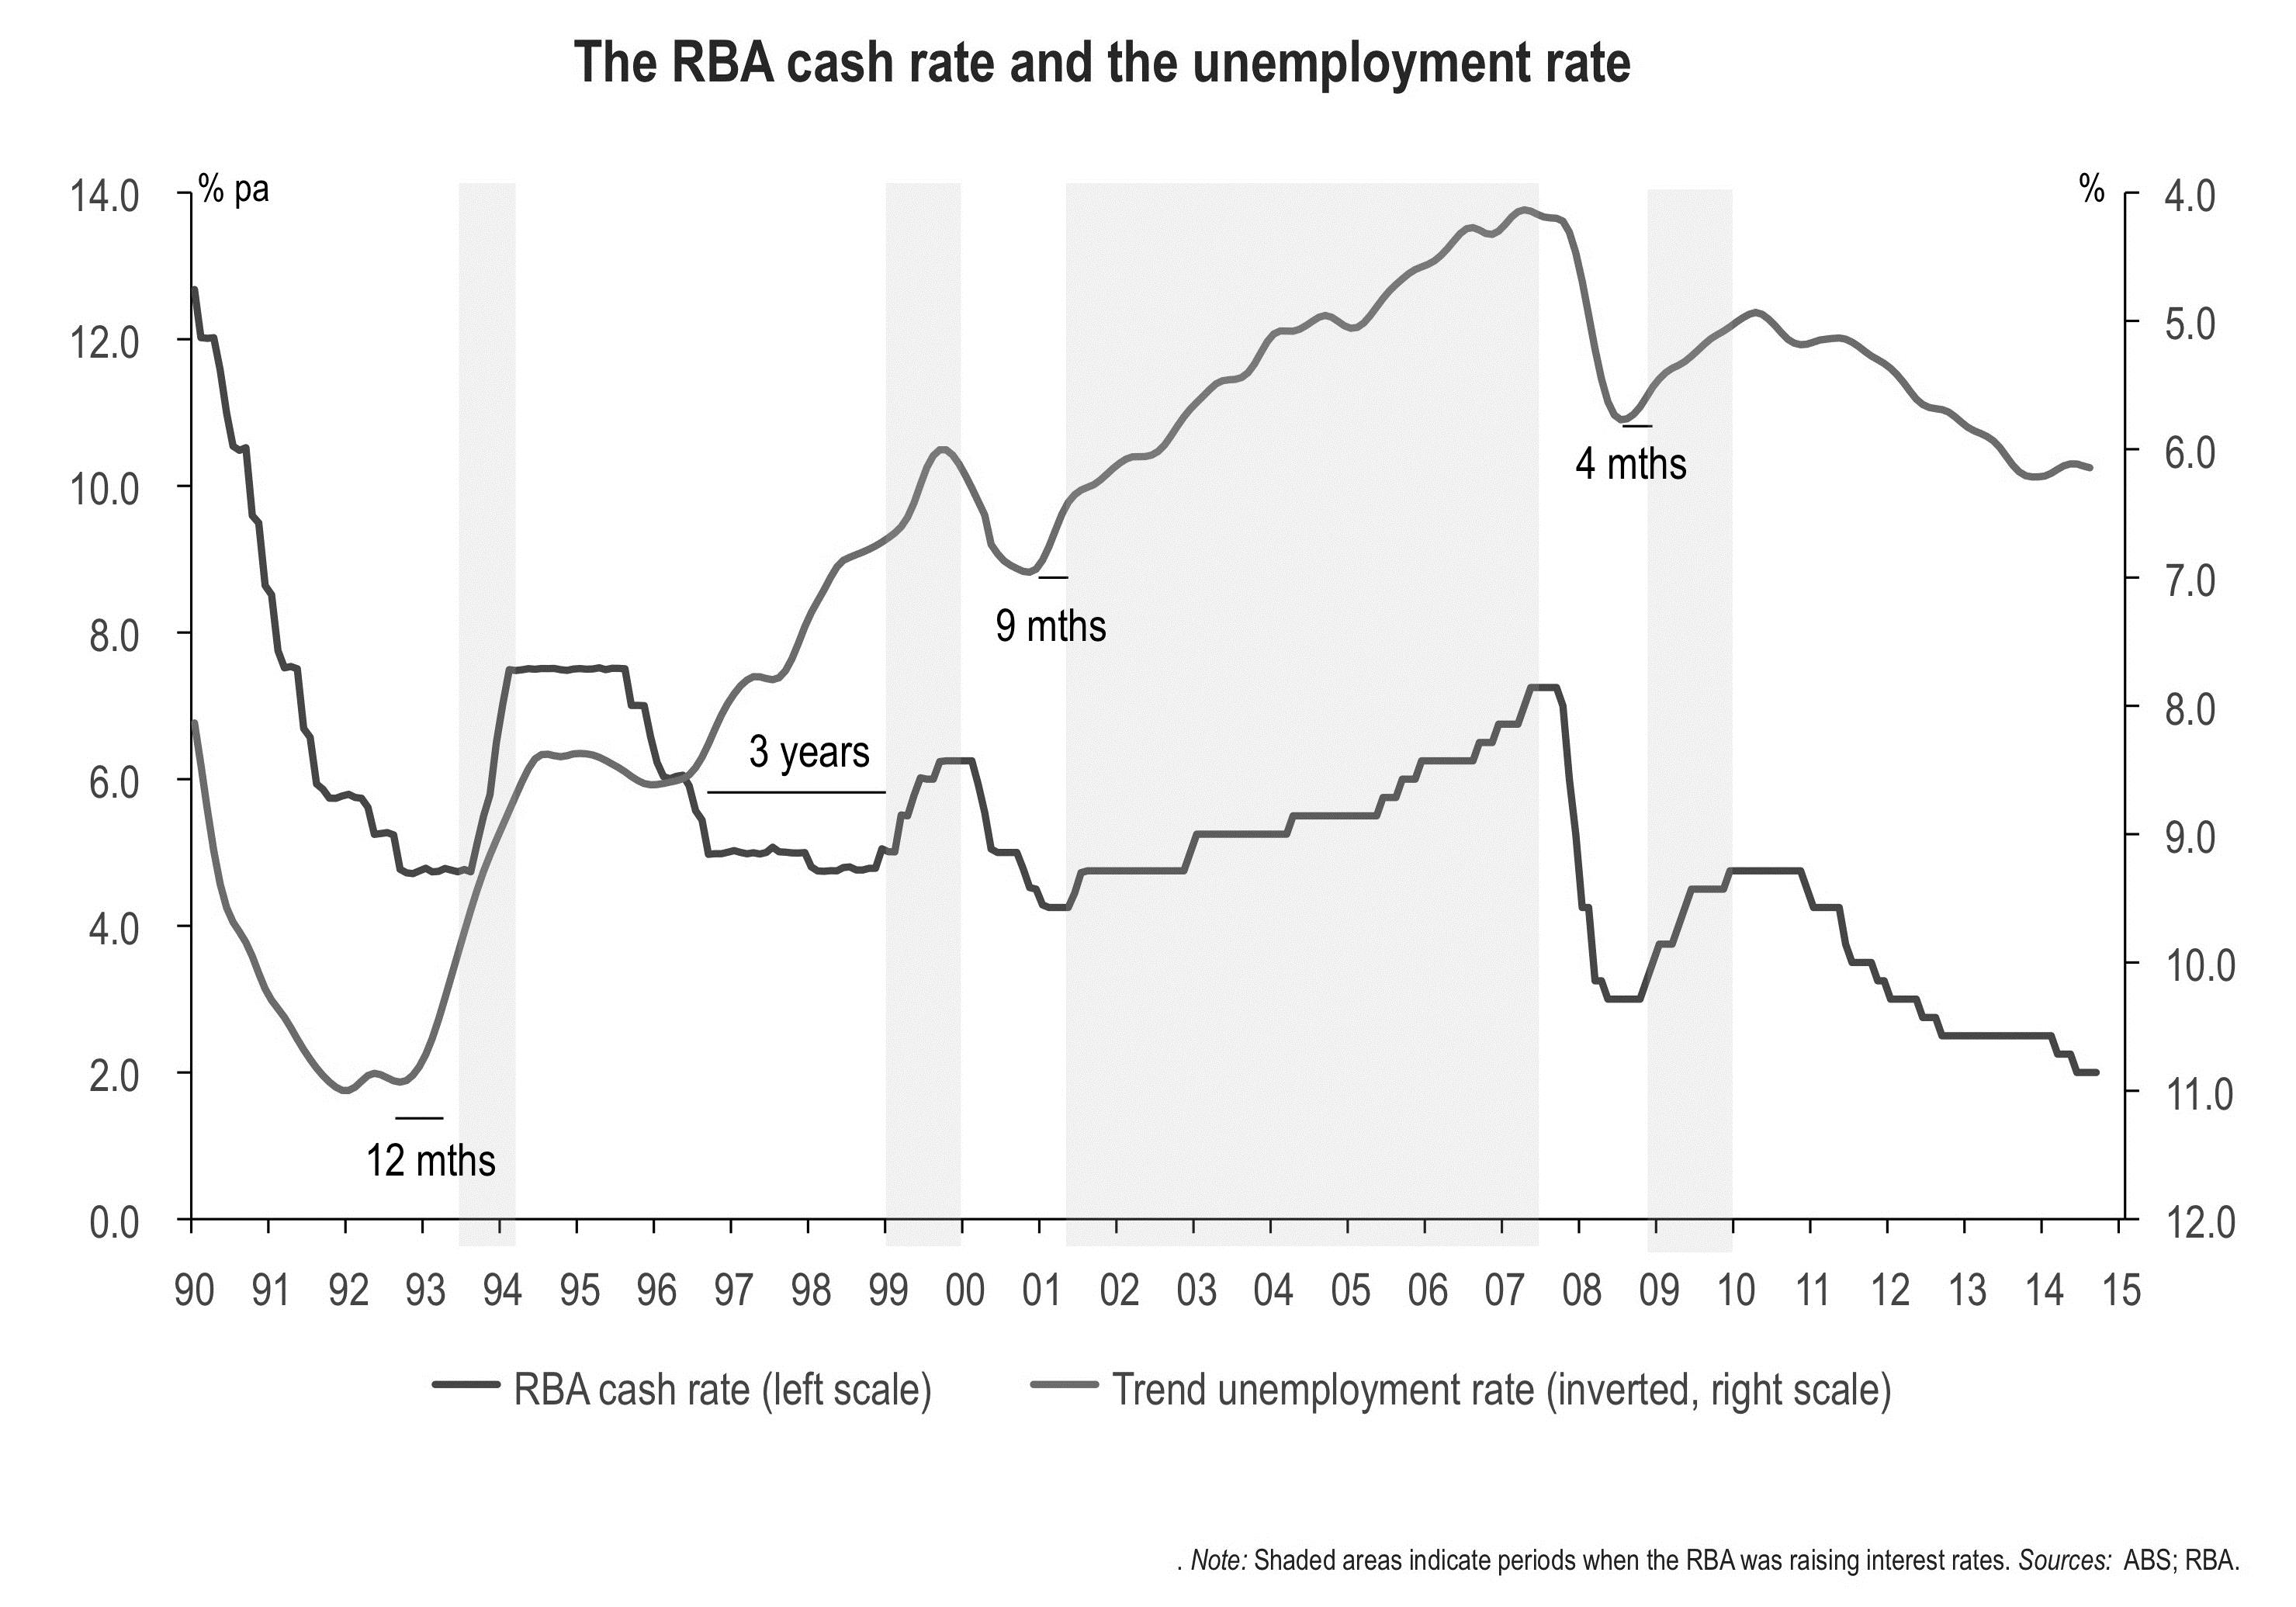
Figure 25: The RBA cash rate and the unemployment rate.
The opportunity for Australian agriculture
The numbers and spending power of ‘Asian middle classes’ will increase dramatically over the next 15 years.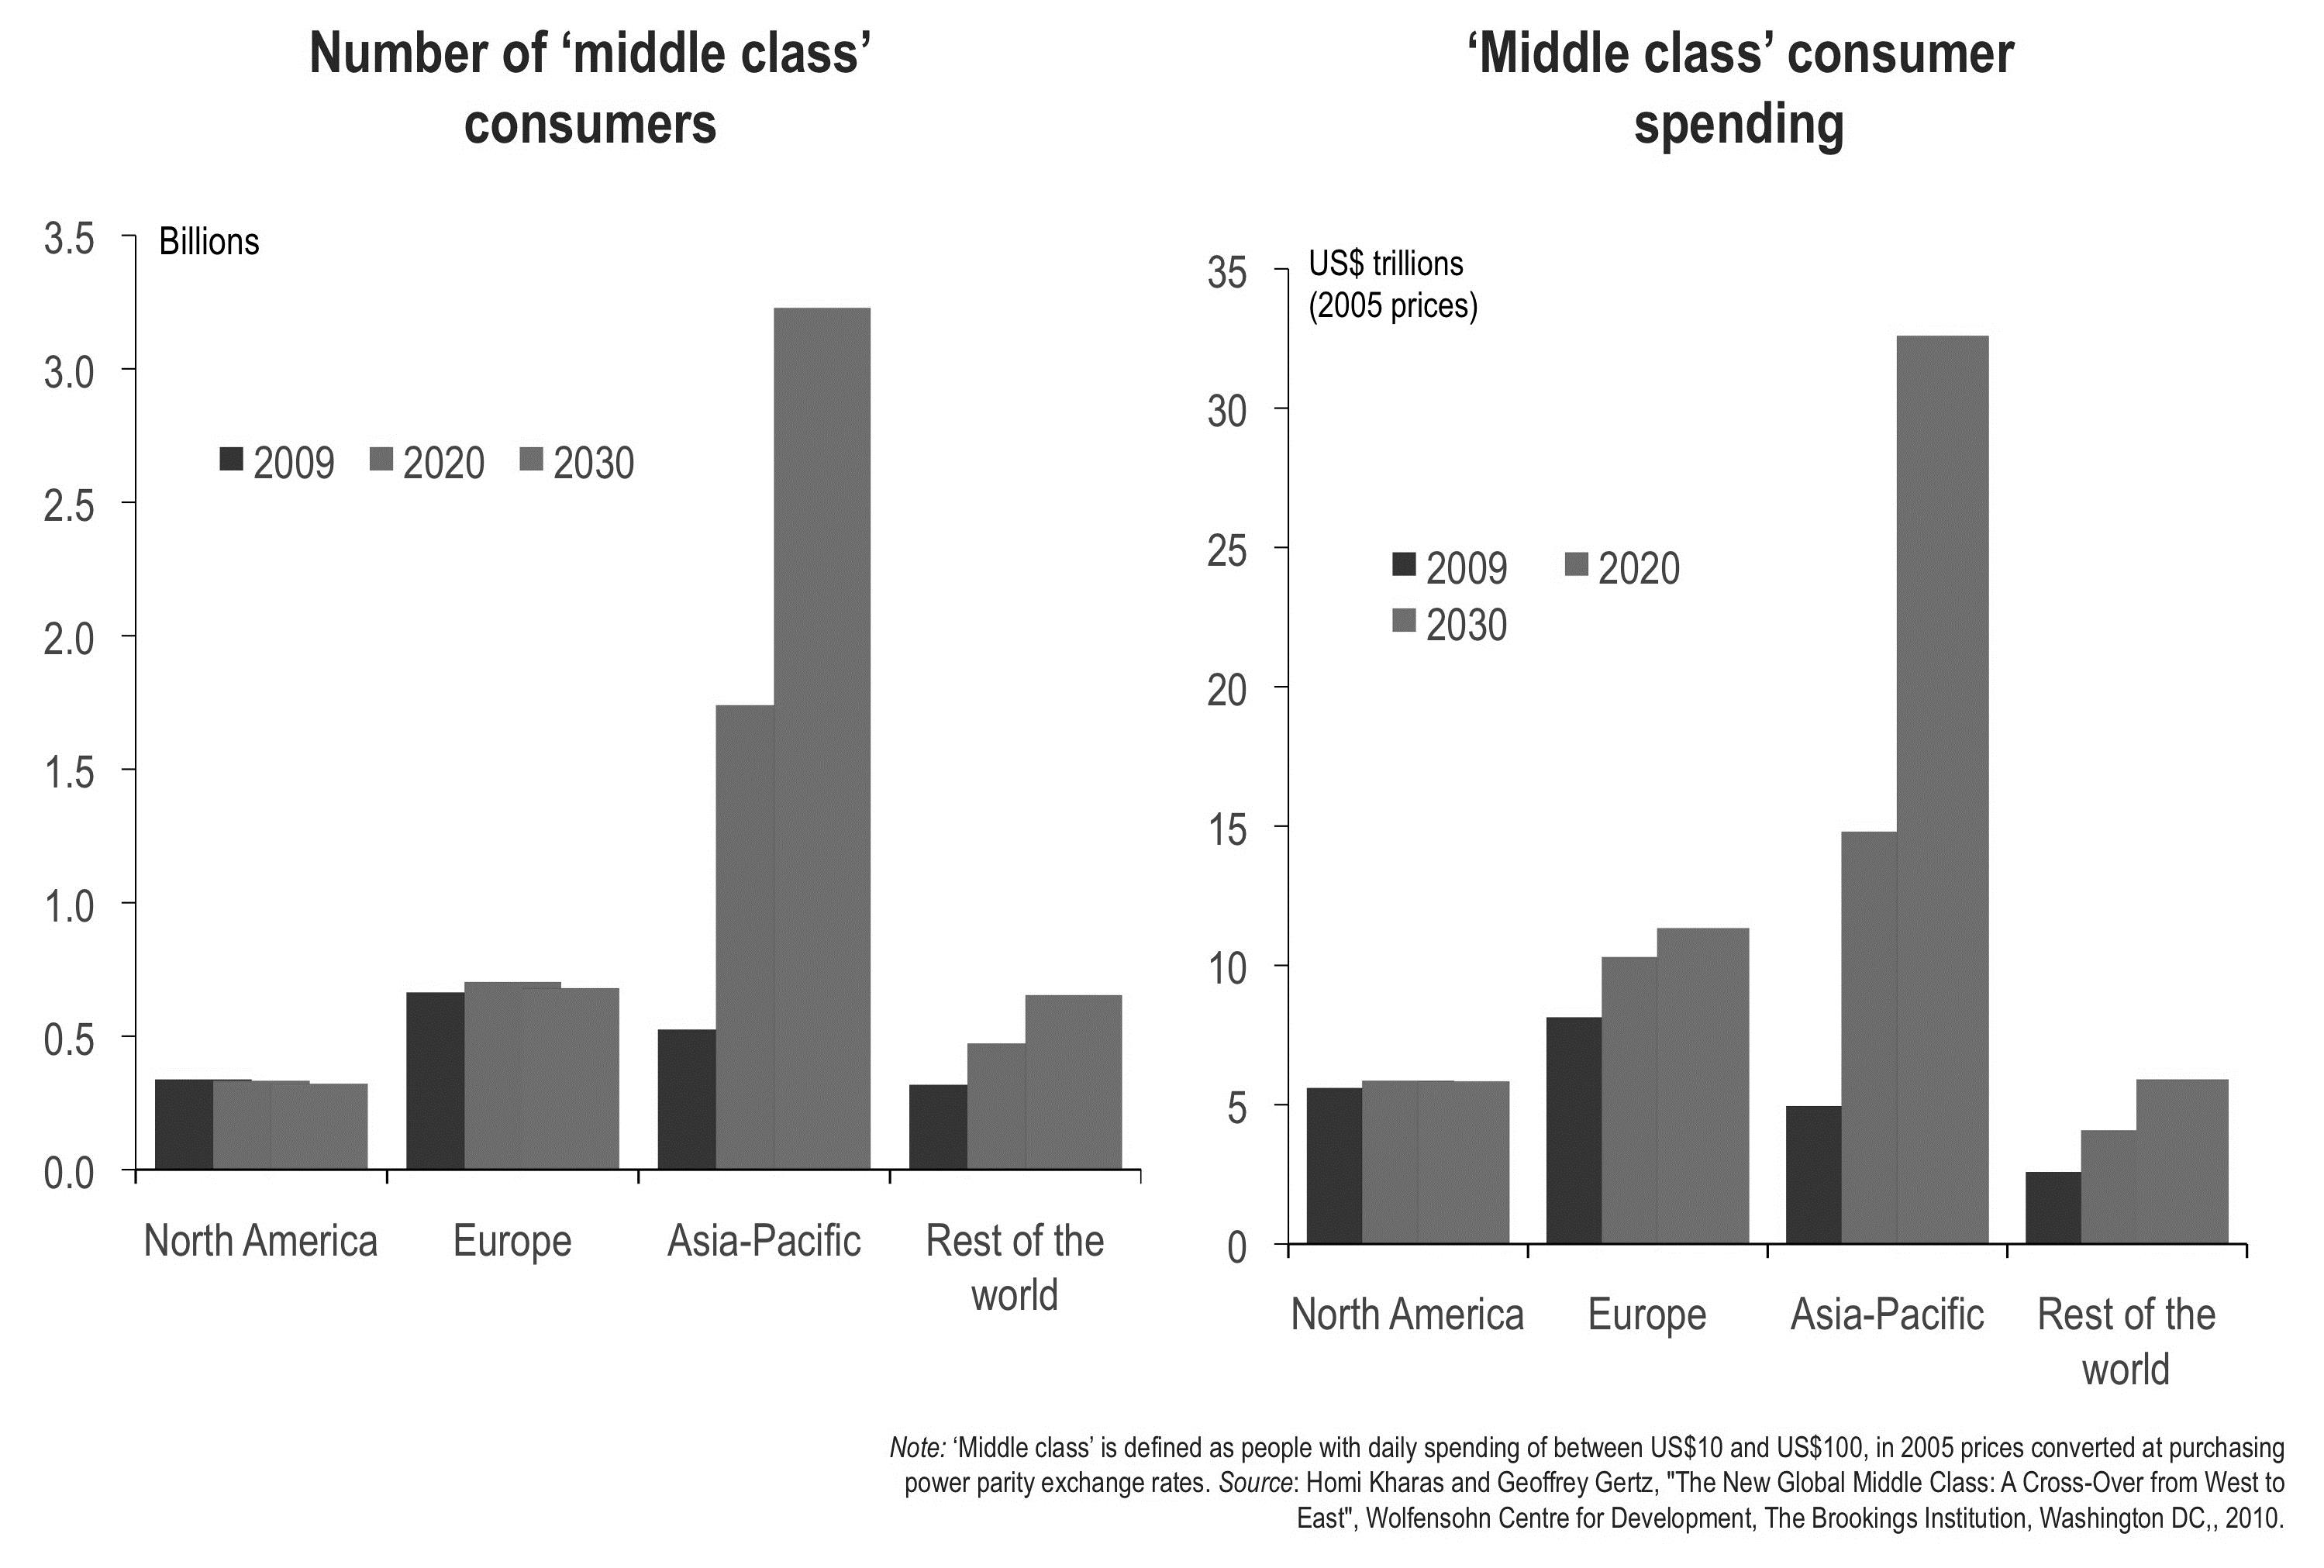
Figure 26 (a): Number of ‘middle class’ consumers and (b): ‘middle class’ consumer spending.
Agrifood consumption will rise sharply in lower- and middle-income Asian economies over the next few decades.
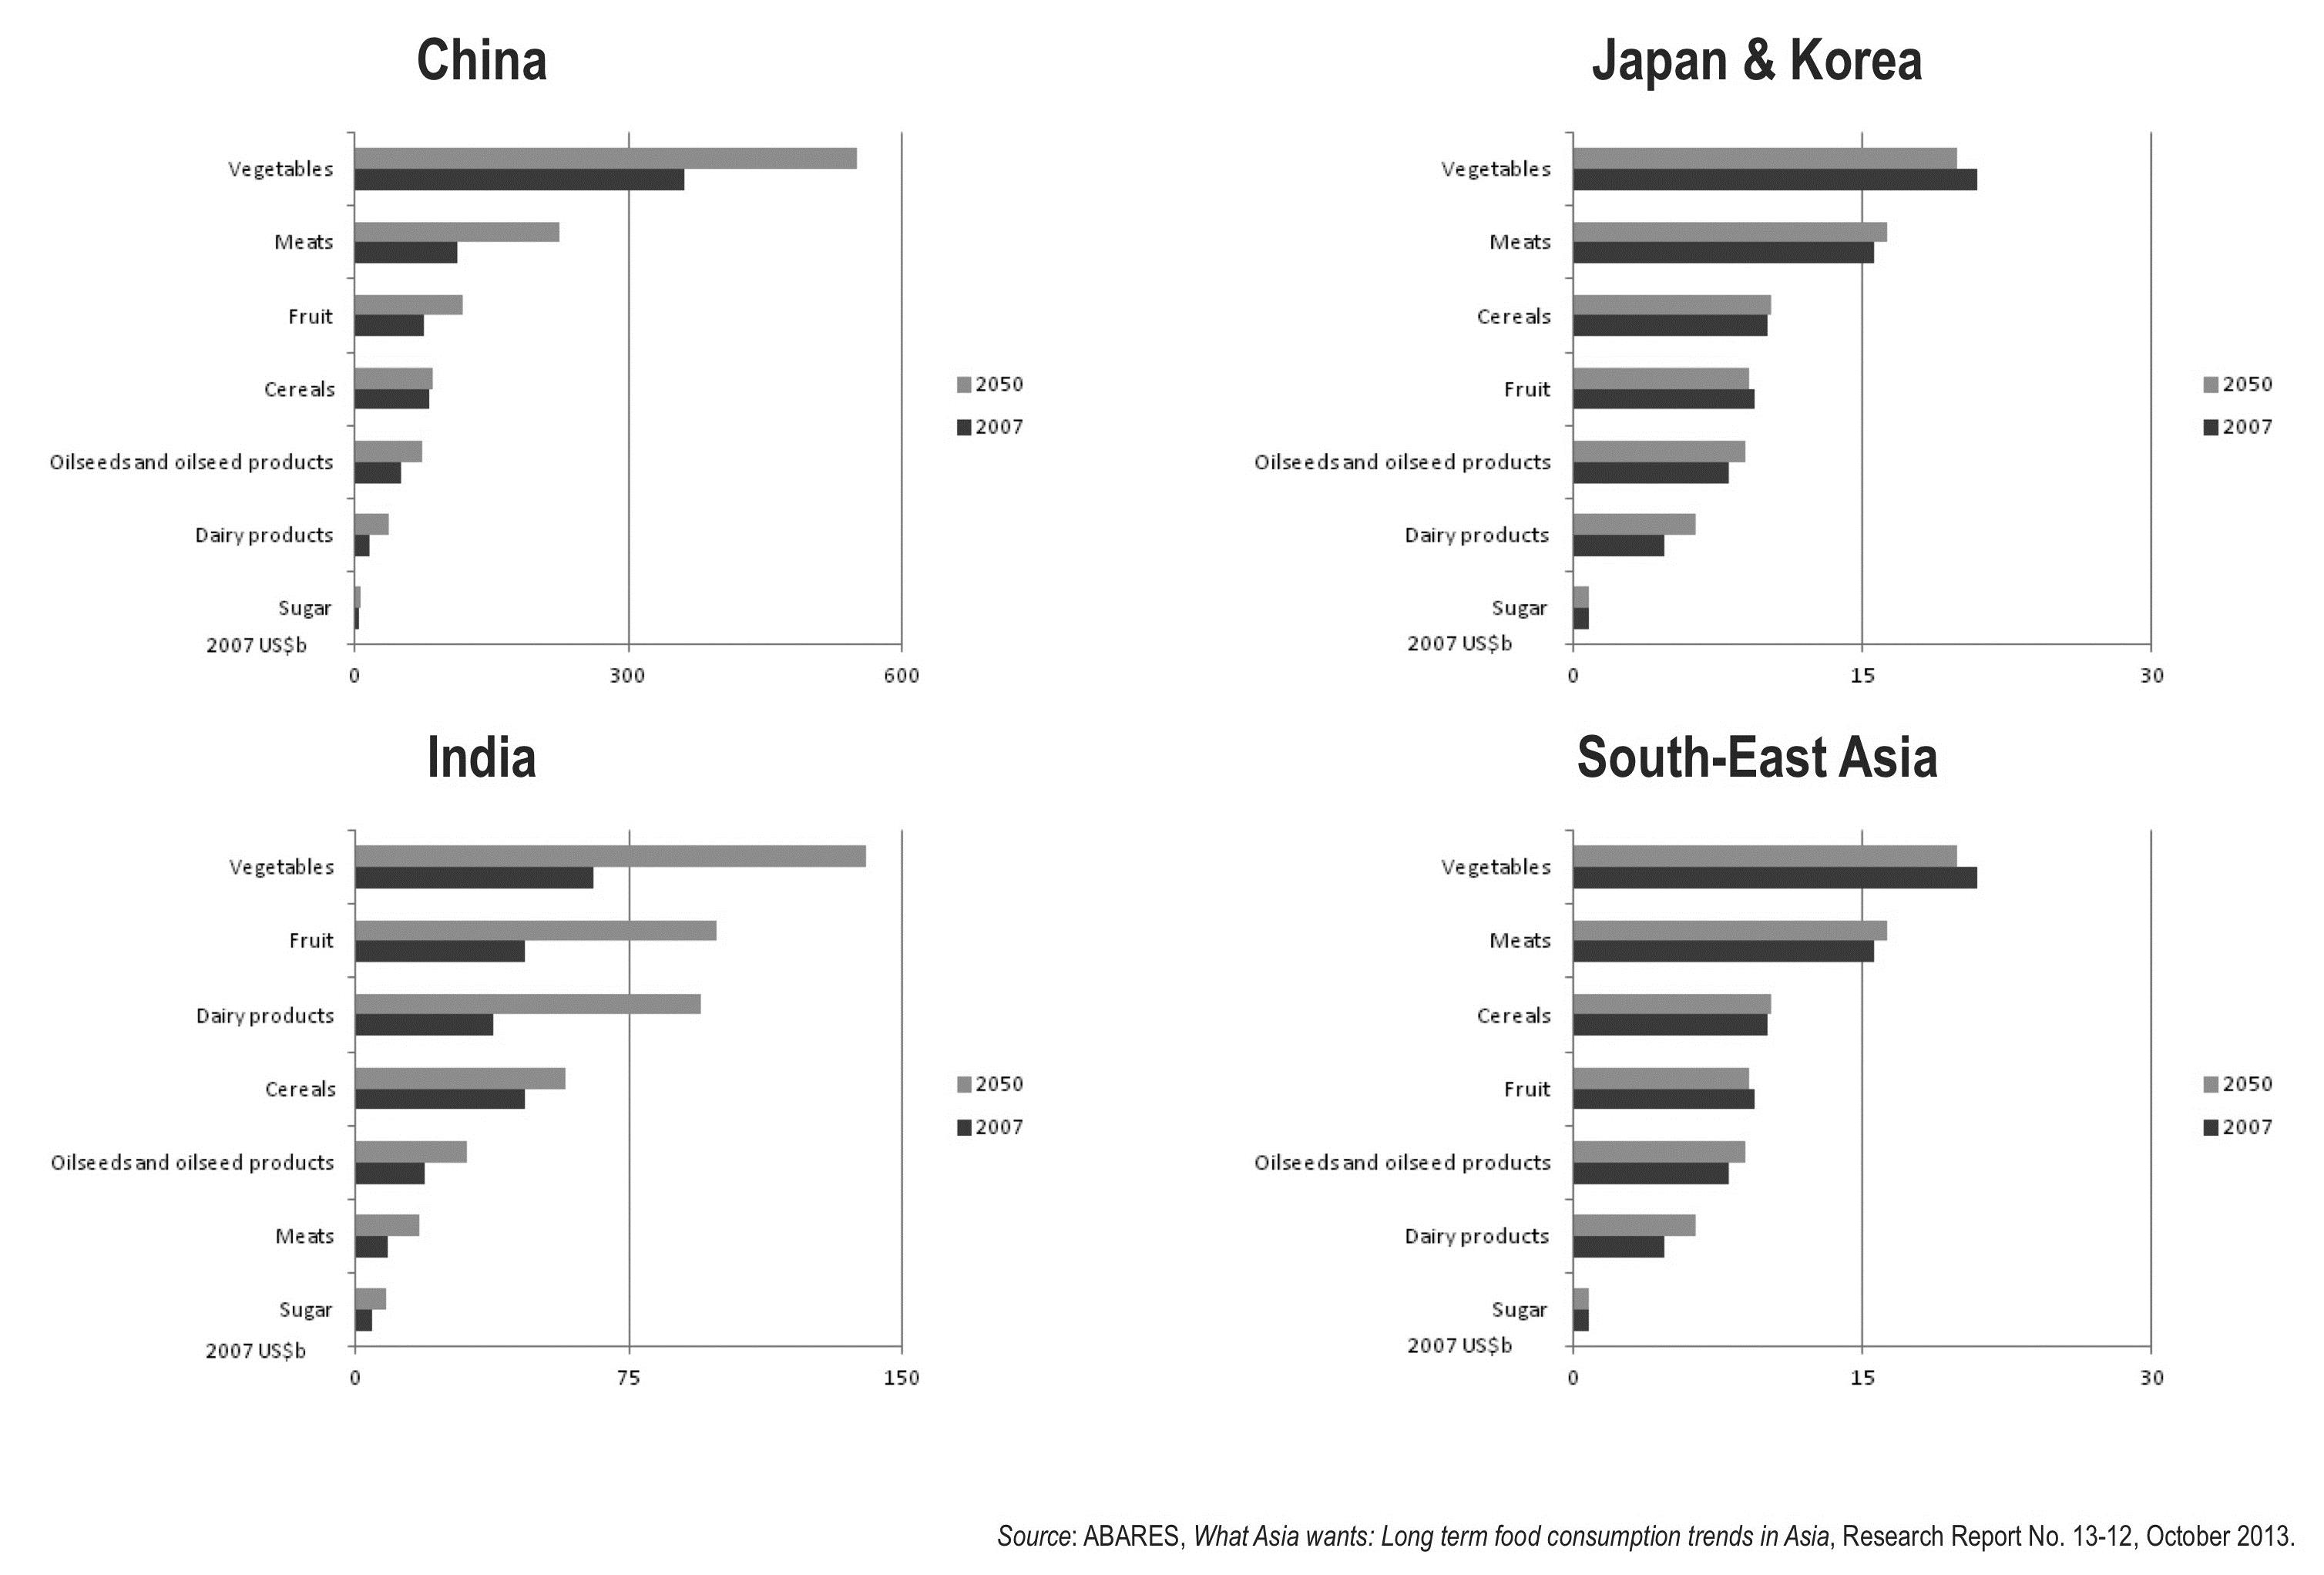
Figure 27: Predicted Asian consumption of agrifood in 2050 compared with 2007.
But Asia’s potential to lift agricultural production is limited by constraints on both land and water.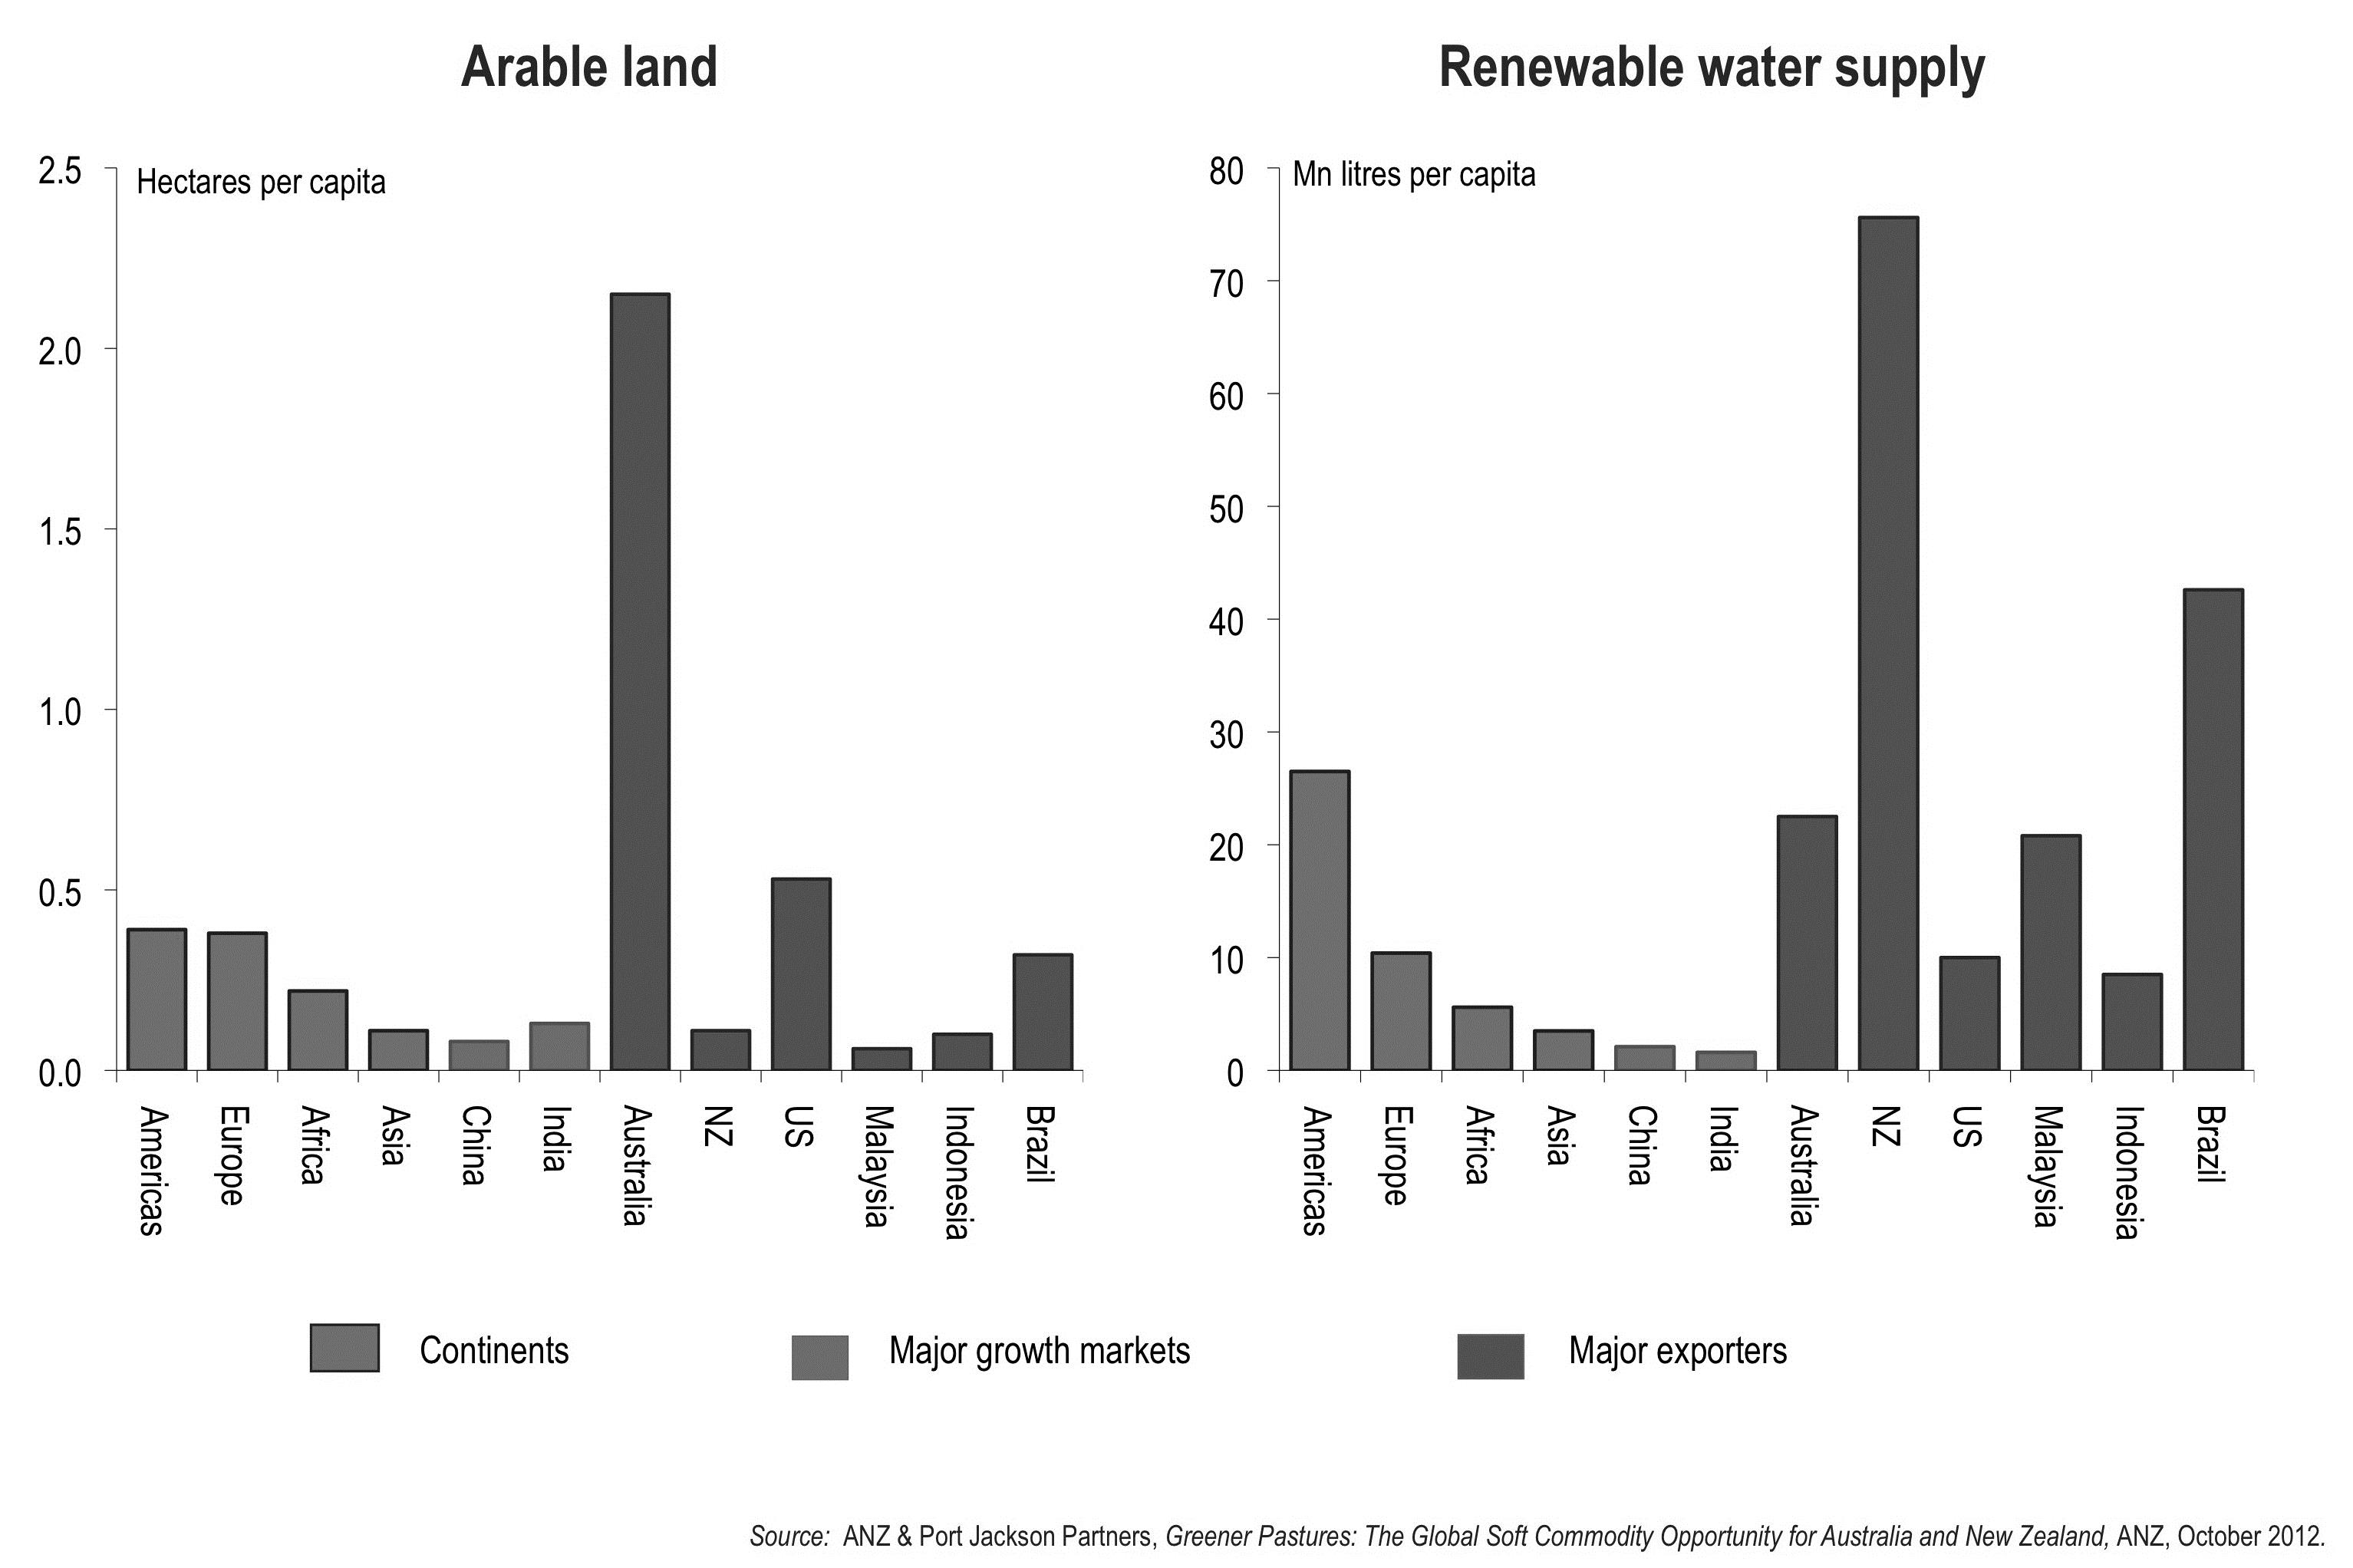
Figure 28: Australia’s arable land and renewable water supply compared to Asian and other countries.
So the growth rate of agricultural production is likely to be slow.
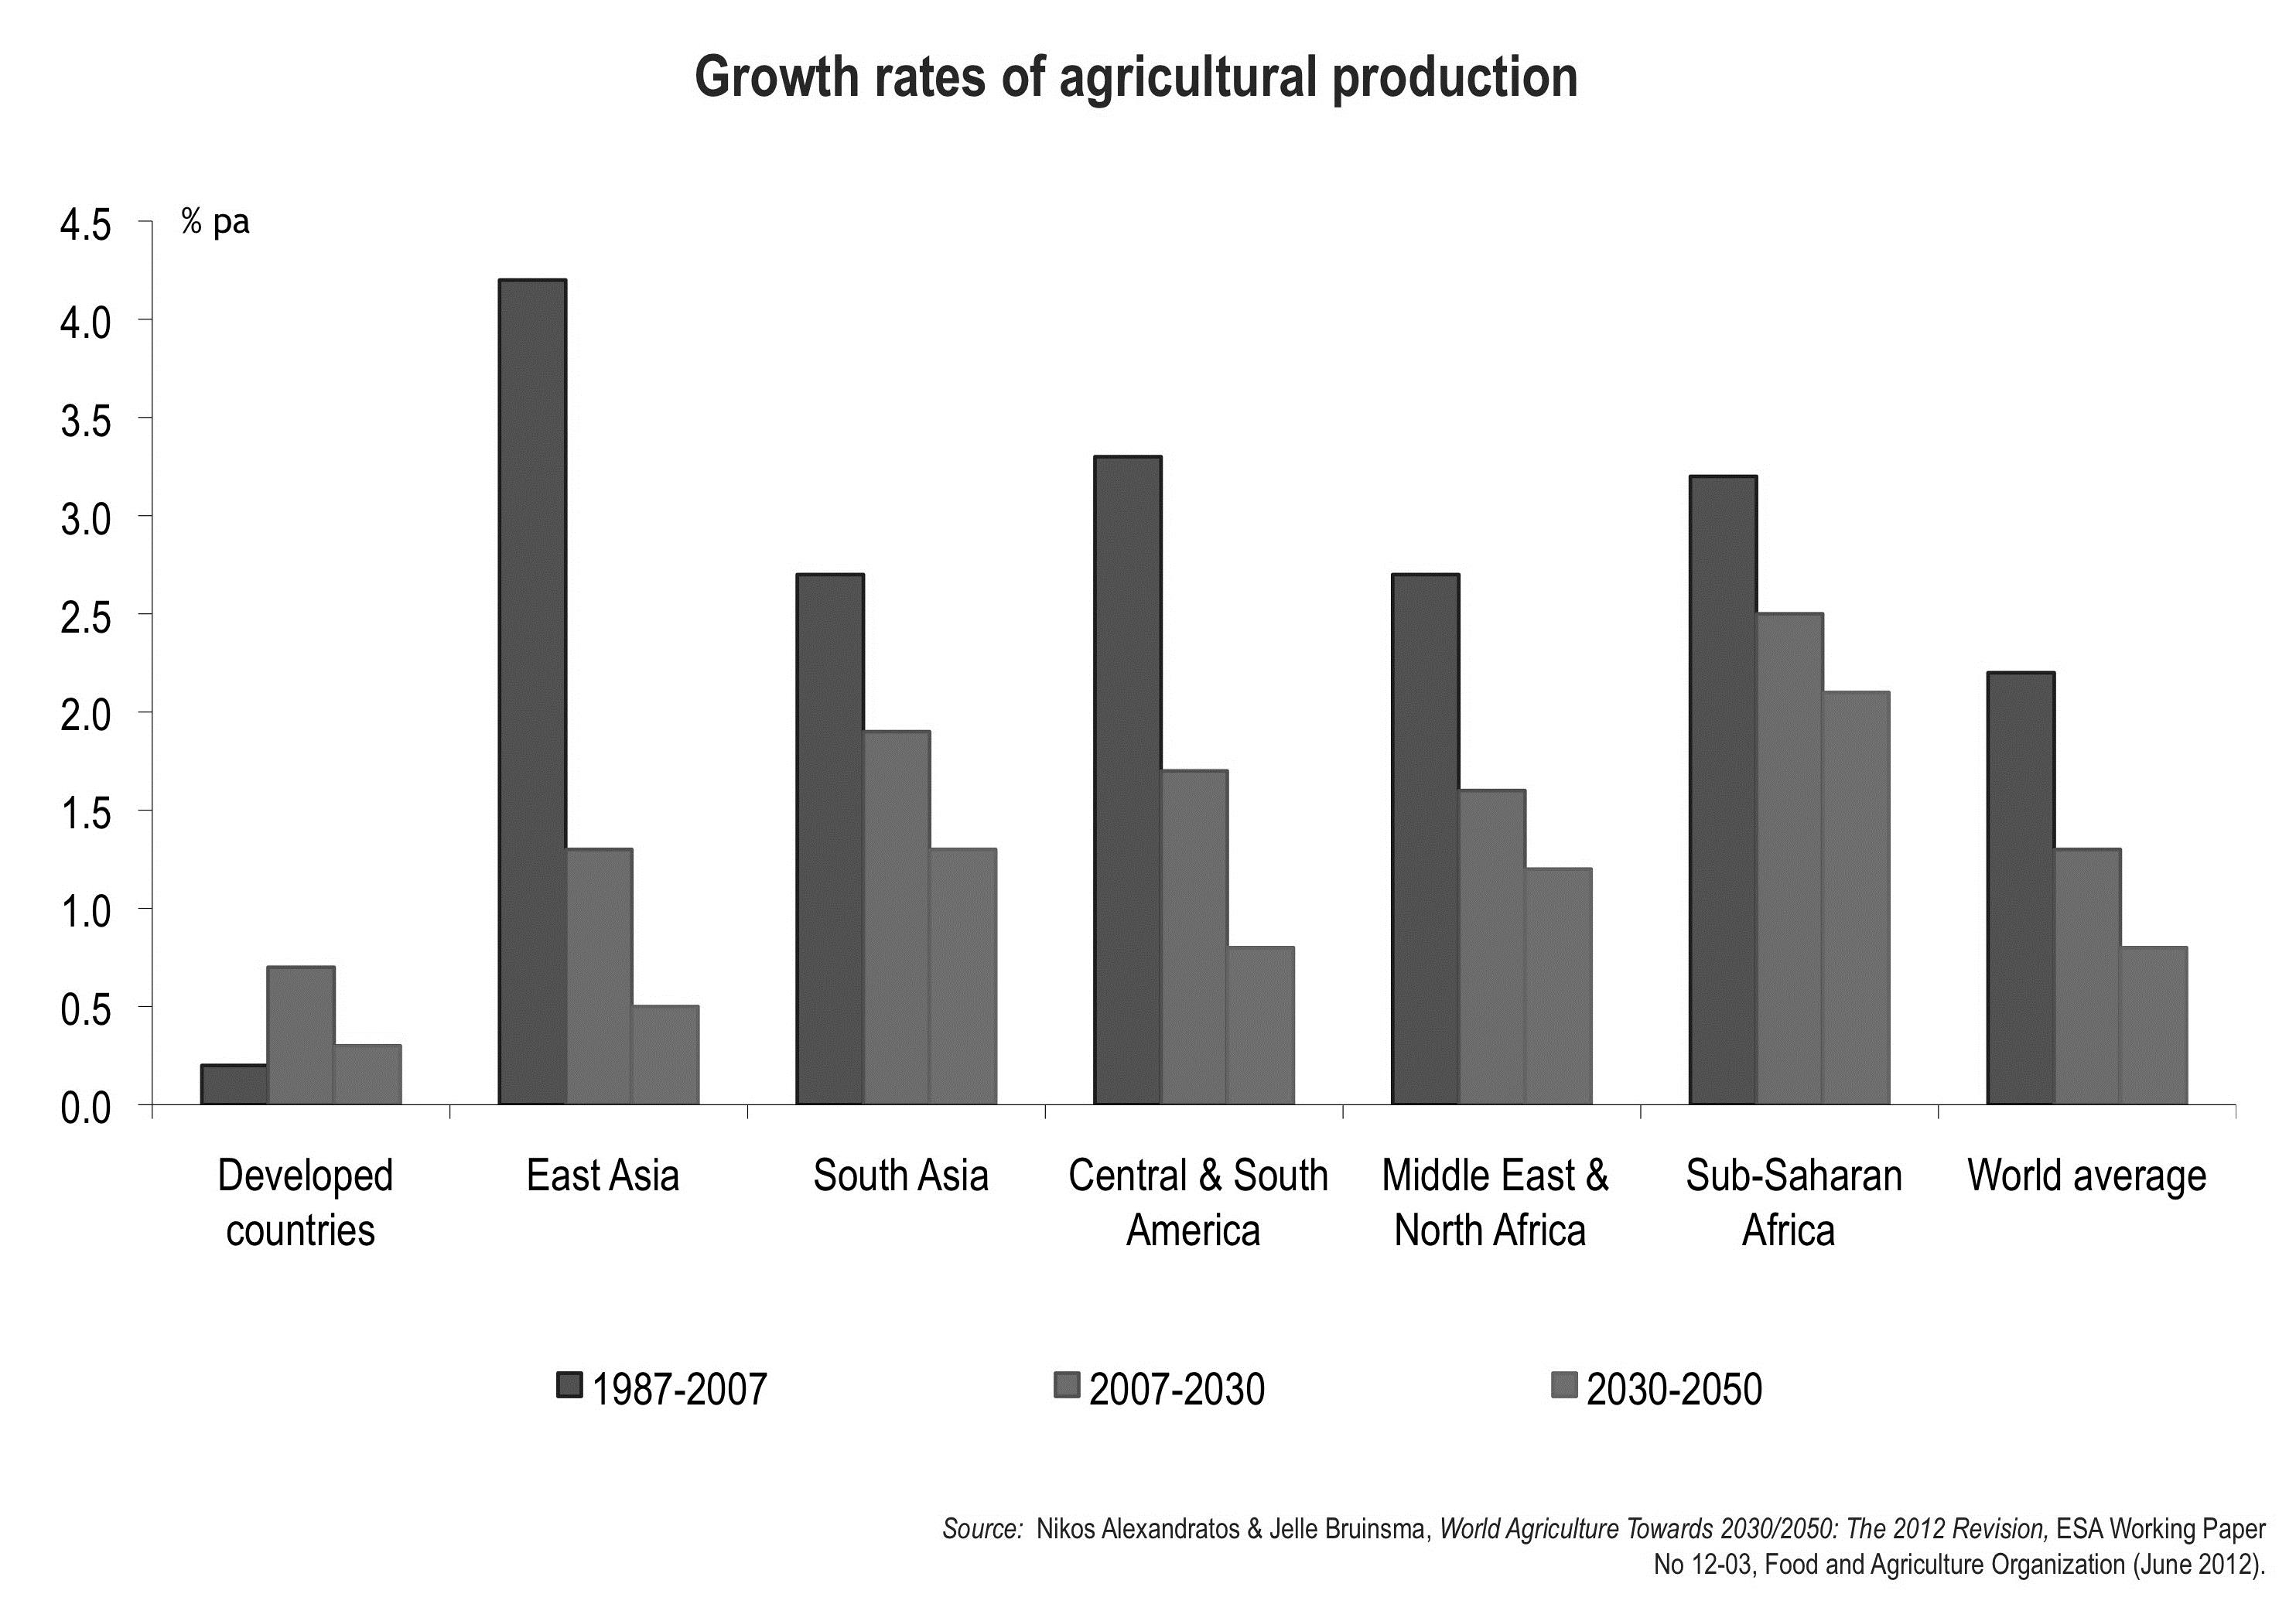
Figure 29: Predicted growth rates of agricultural production.
And Asian countries (in particular) will need to import a lot more food products.
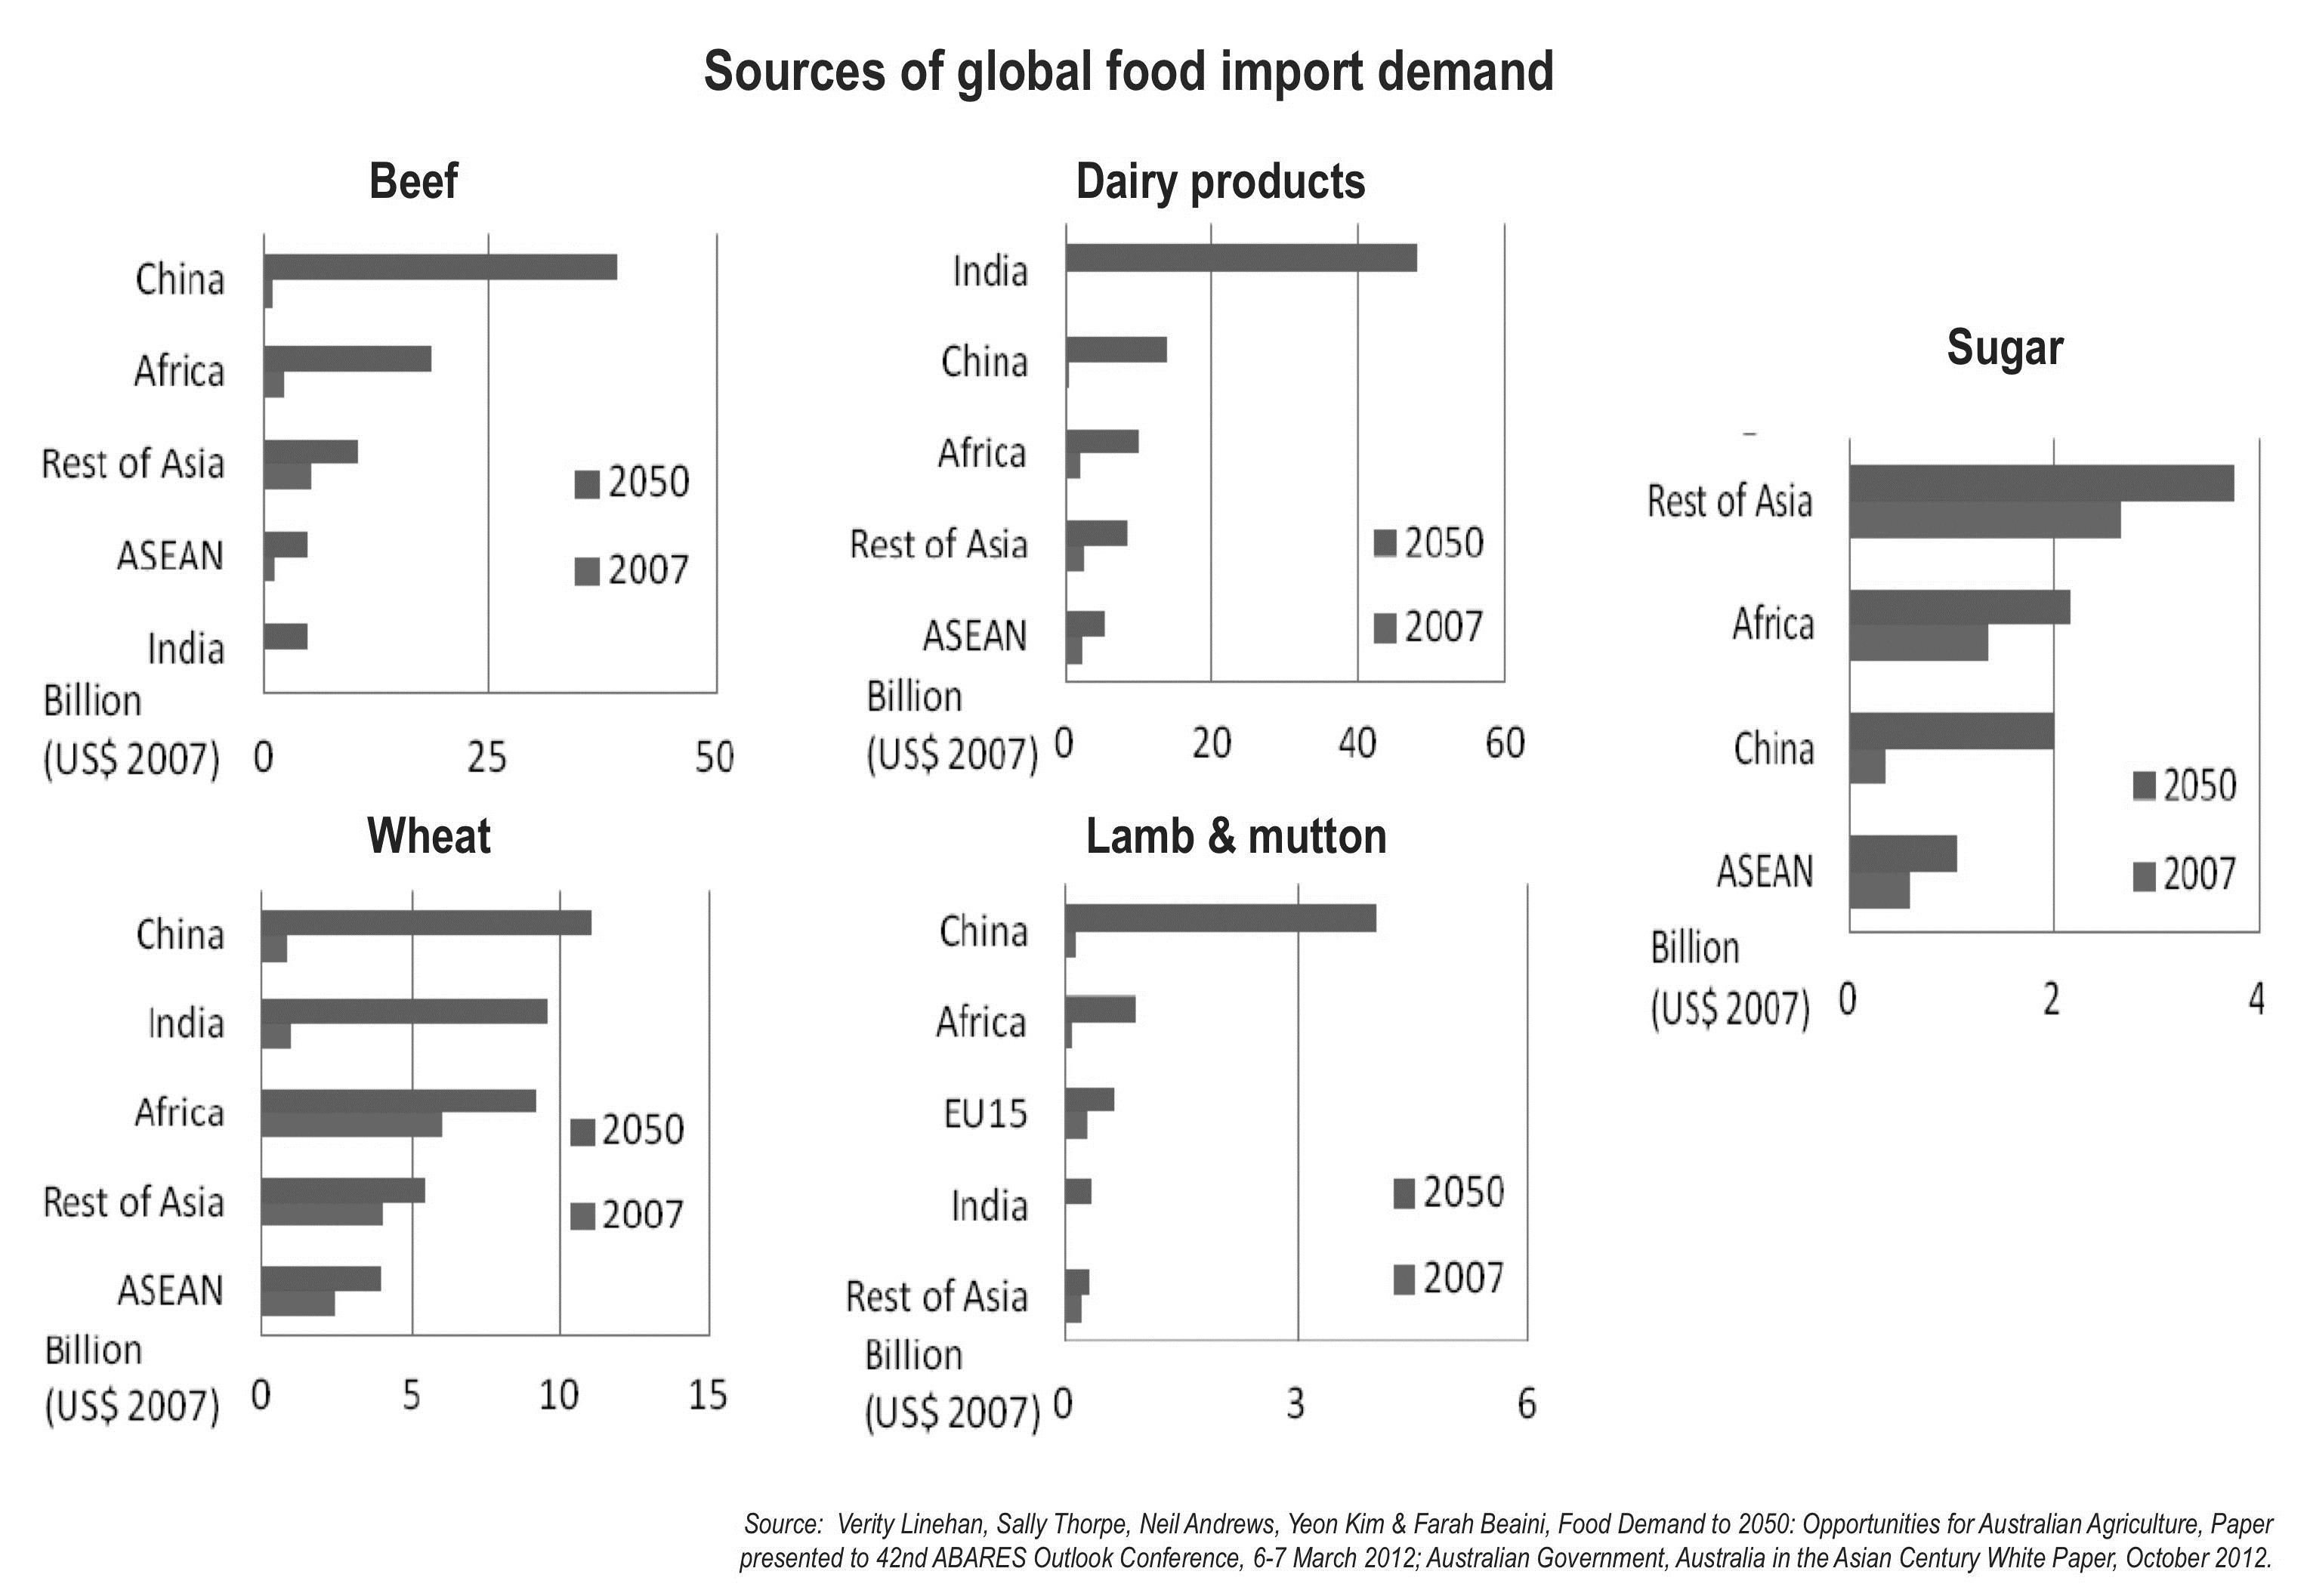
Figure 30: Sources of global food import demand.
The three ‘Free Trade Agreements’ completed last year do create some real opportunities for Australian agricultural producers
- No ‘Free Trade Agreement’ ever produces genuinely ‘free’ trade.
- Some of the ones Australia has signed in recent years (e.g. with the US or Thailand) didn’t do much for Australian exporters.
- However the agreements signed last year with Korea, Japan and China are genuinely ‘good’ agreements which open up genuine opportunities for Australian exporters, including agricultural exporters.
- The agreement with Korea:
- immediately abolishes Korean tariffs on Australian sugar, wheat and wine
- provides duty-free access for seasonal horticultural products (such as potatoes).
- phases out tariffs on beef, sheep meat, pork and dairy products over periods of between three and 13 years (in most cases).
- The agreement with Japan:
- provides for fairly swift reductions in tariffs on beef (though not complete elimination).
- institutes duty-free quotas for cheese and milk protein concentrates.
- allows greater access for a range of horticultural products (especially seasonal ones).
- eliminates the higher-bracket tariff on imports of standard Australian sugar.
- The agreement with China:
- provides for the phasing out of tariffs on beef, all dairy products, sheep meat, pork, fruit and vegetables over periods of 2-9 years.
- and for a duty-free quota of 30Kt of wool growing to 44Kt 2024, in addition to Australia’s existing access under a global 287Kt quota cases.
- These are much better deals than were on offer under the US-sponsored Trans-Pacific Partnership (TPP).
But to capitalise on that opportunity, Australian agriculture will need to improve its productivity and attract new capital investment, (inevitably) including from foreign sources (Figures 31 and 32).
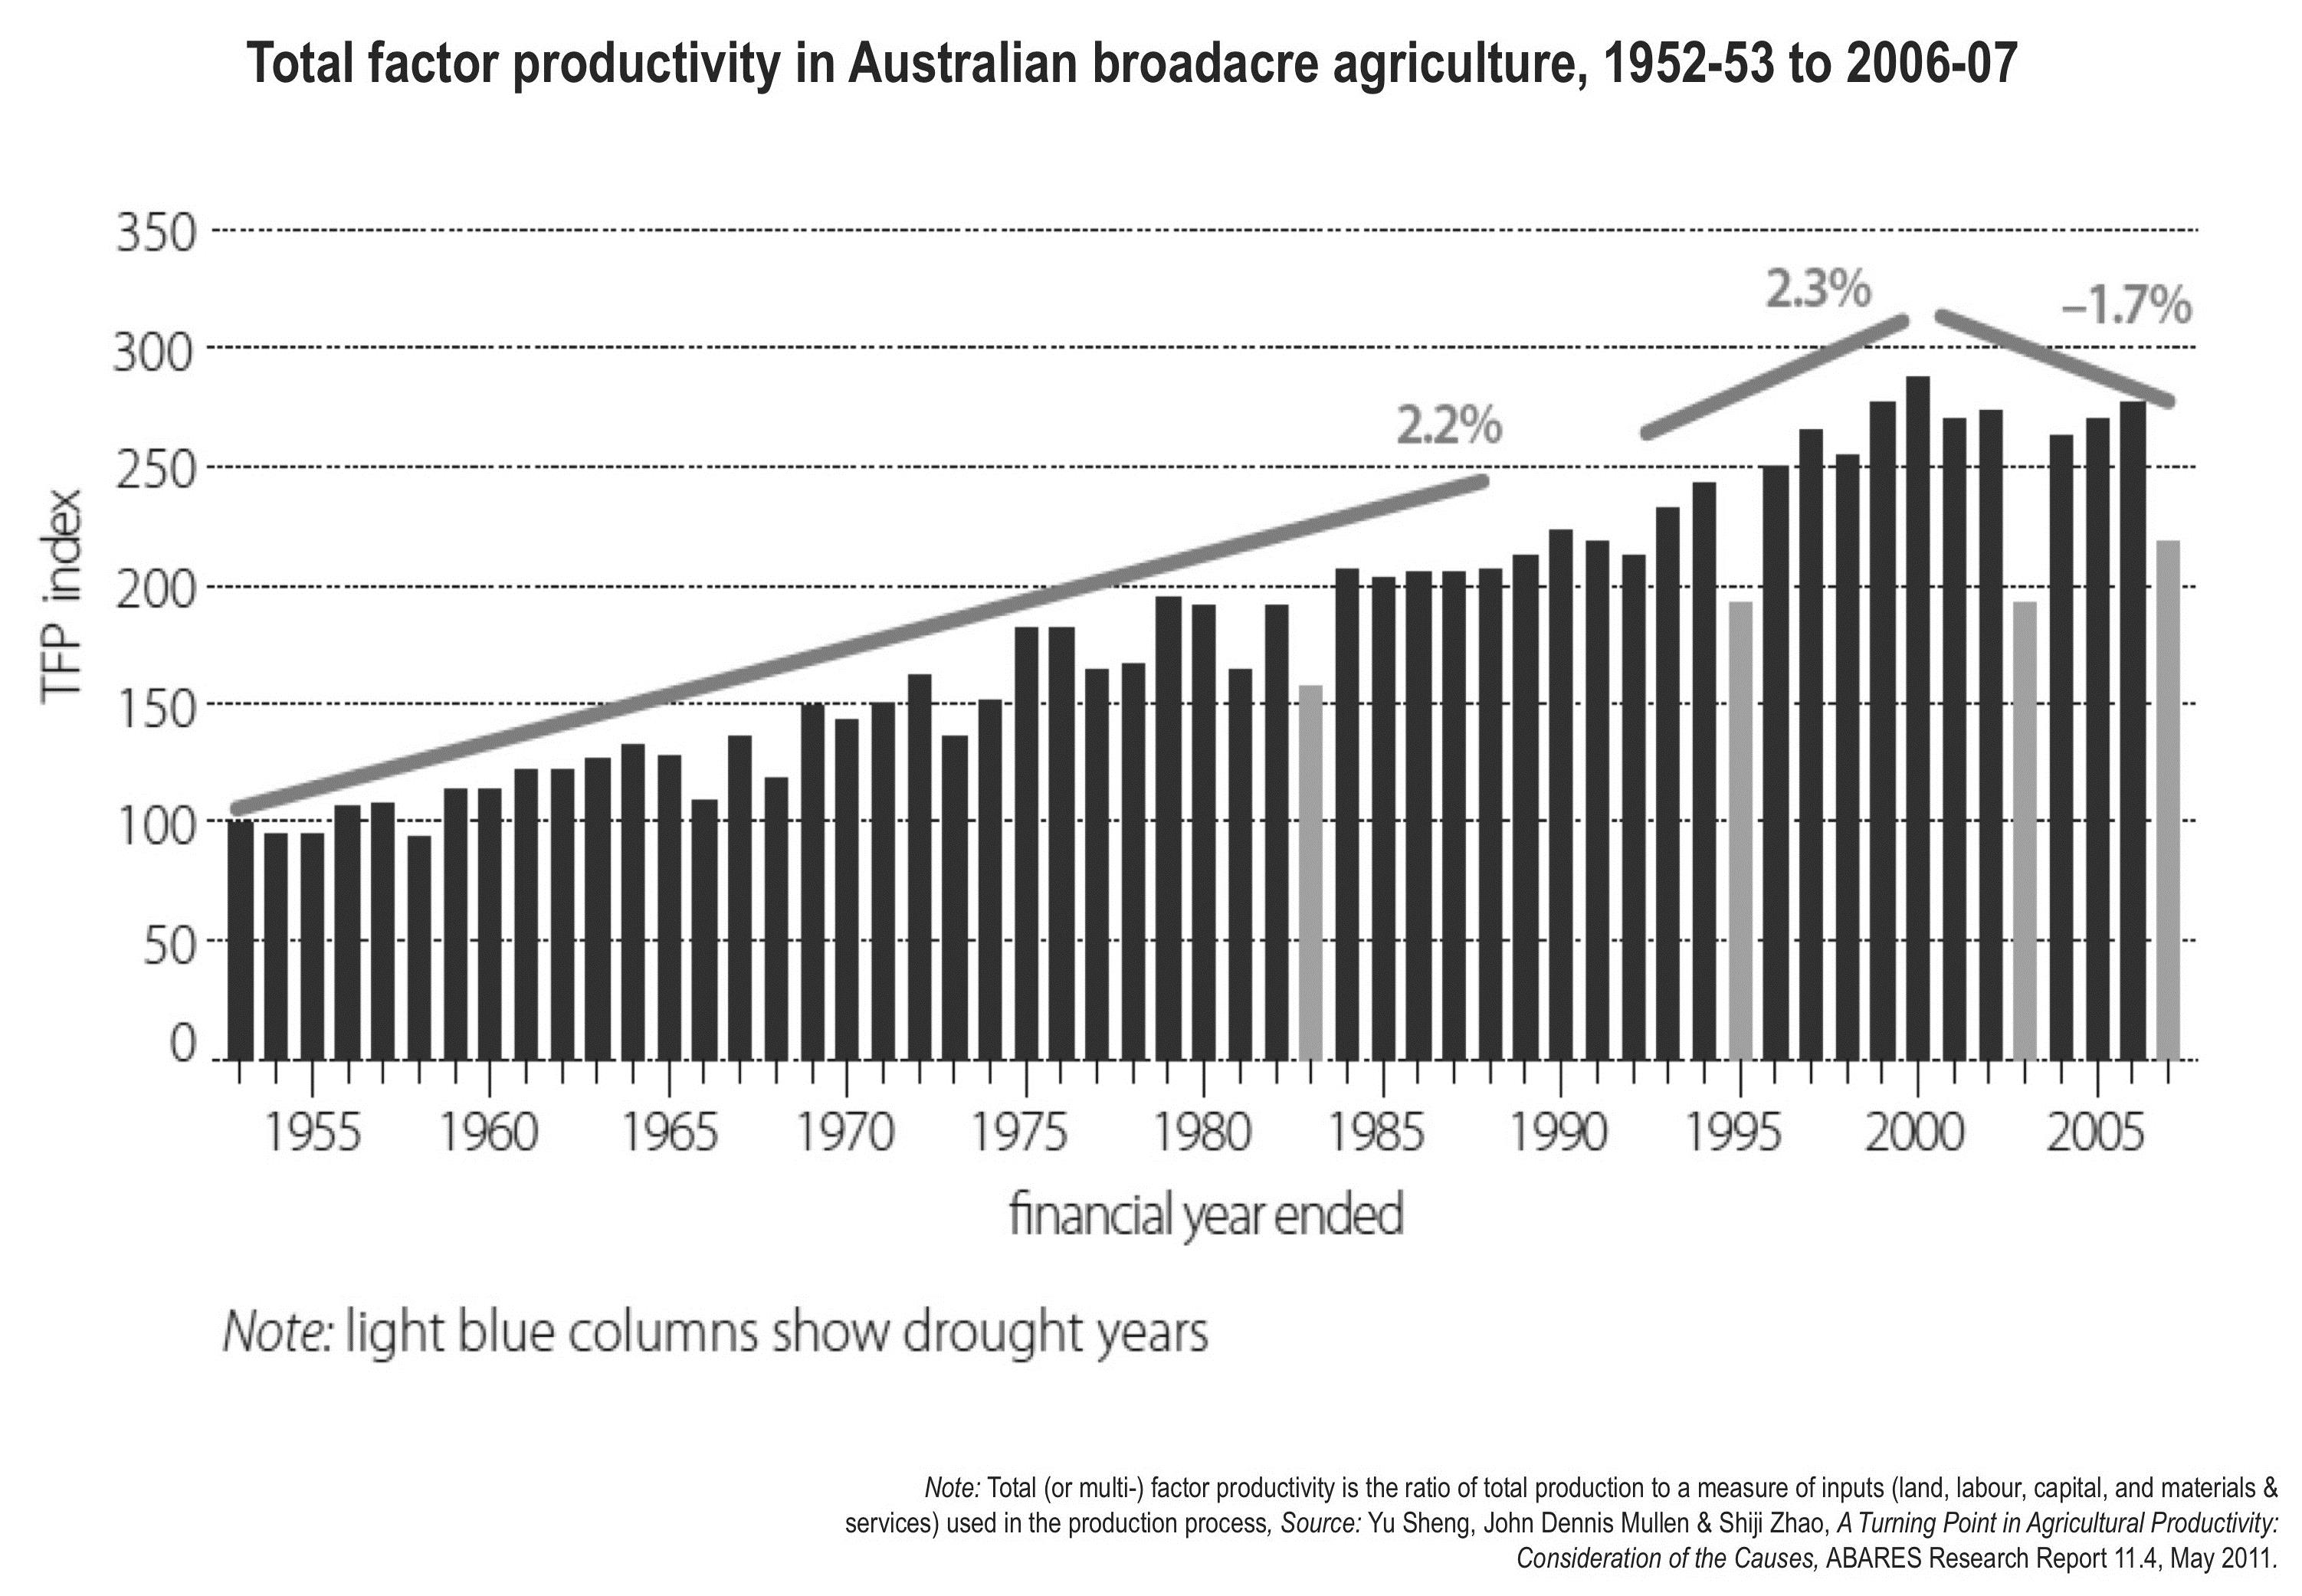
Figure 31: Total factor productivity in Australian broadacre agriculture, 1952-53 to 2006-07.
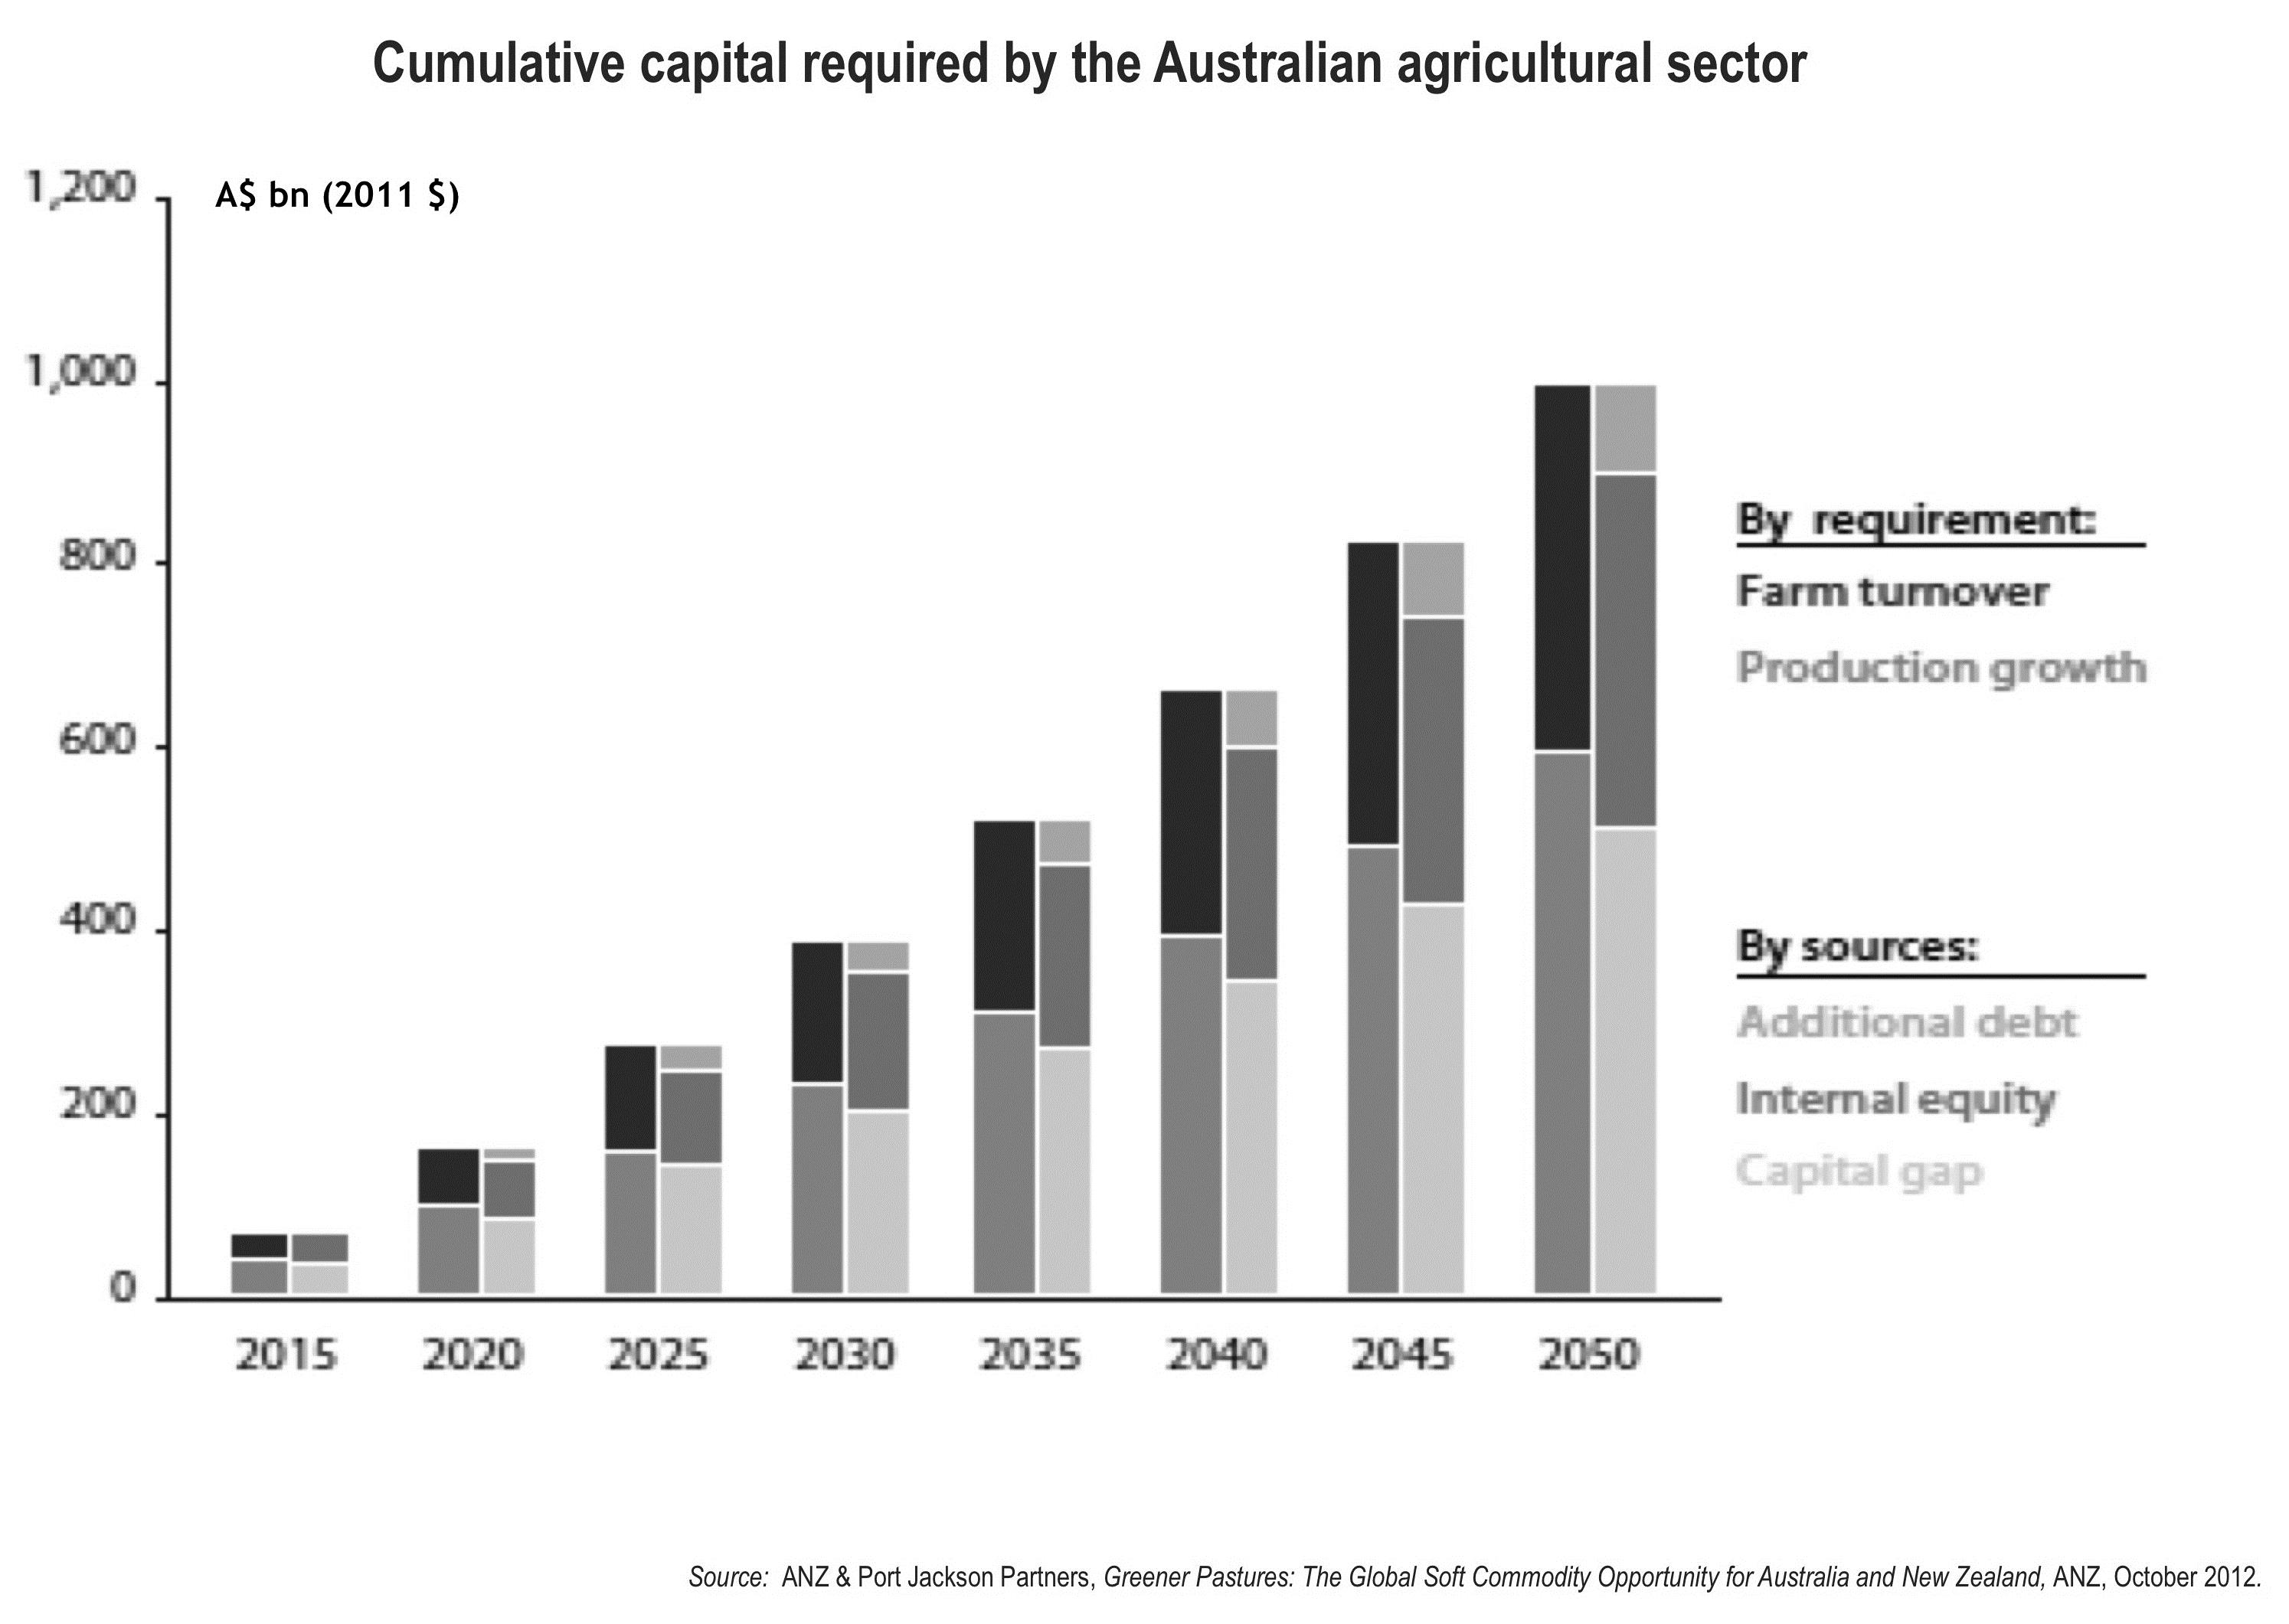
Figure 32: Cumulative capital required by the Australian agricultural sector.
Productivity growth has slowed across most major Australian agricultural sectors, except sheep farming, since 2000.
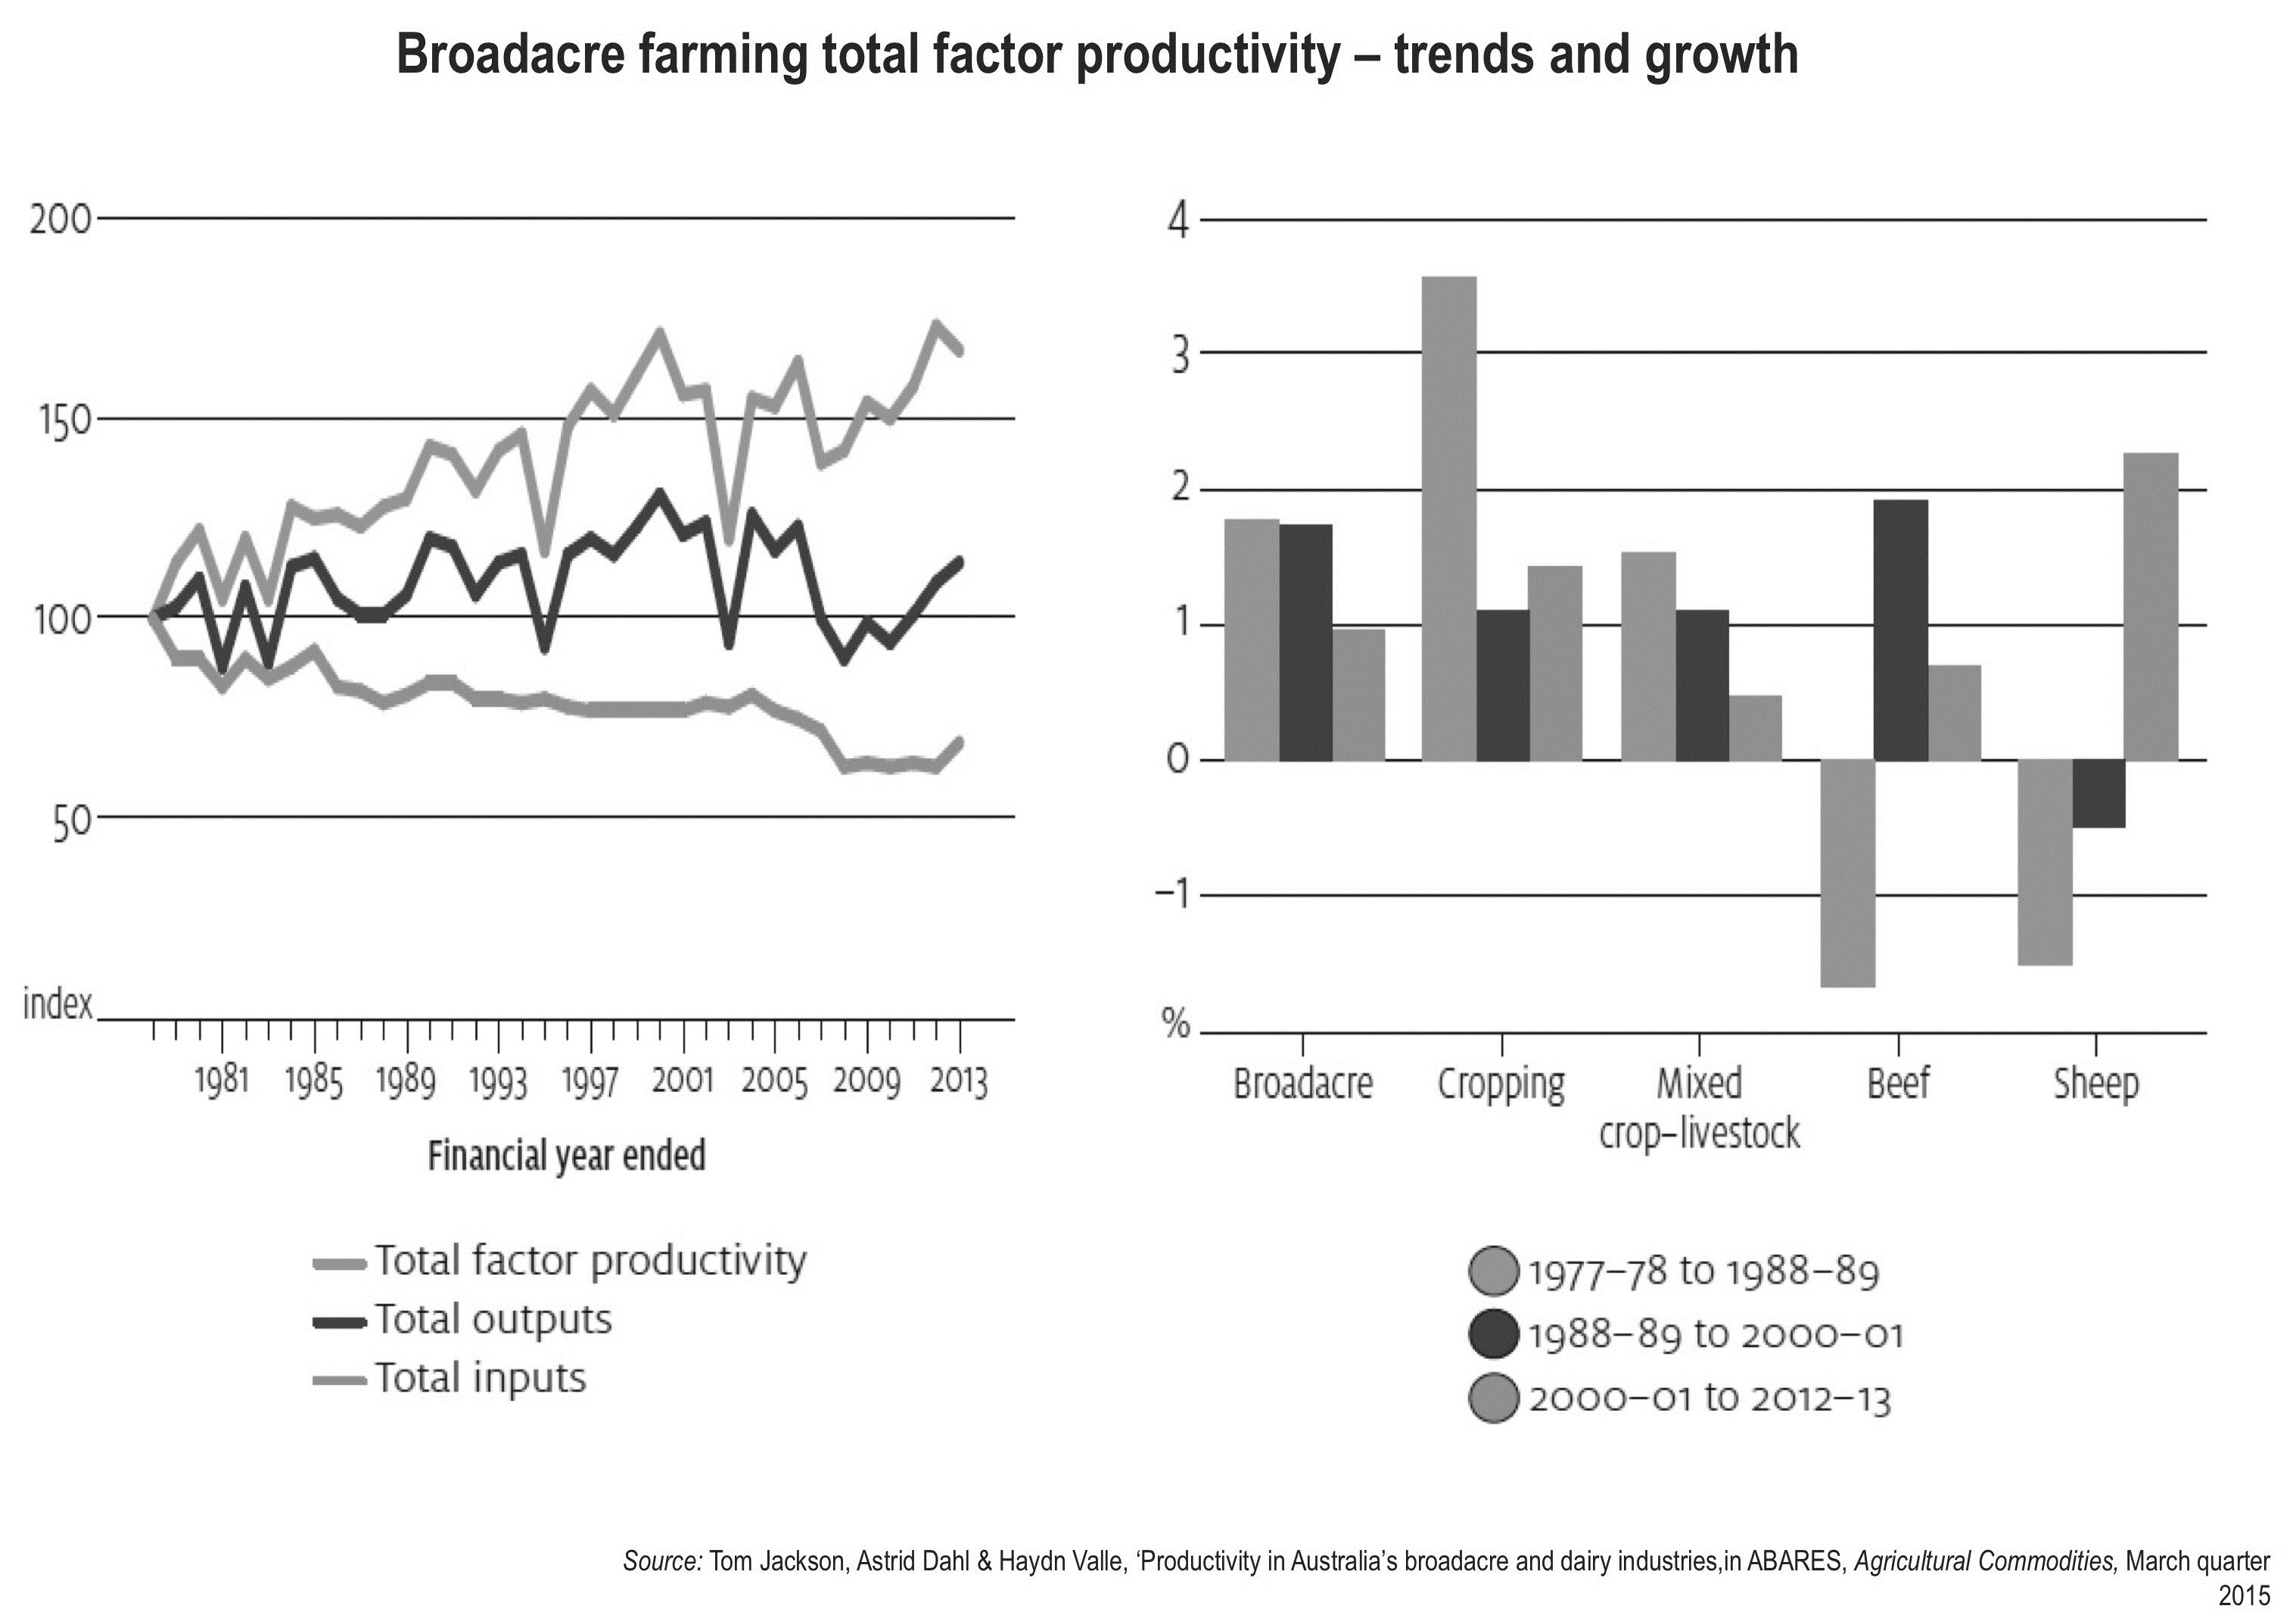
Figure 33: Broadacre farming total factor productivity – trends and growth.
Although it’s not the only factor, farm size does have a significant influence on productivity.
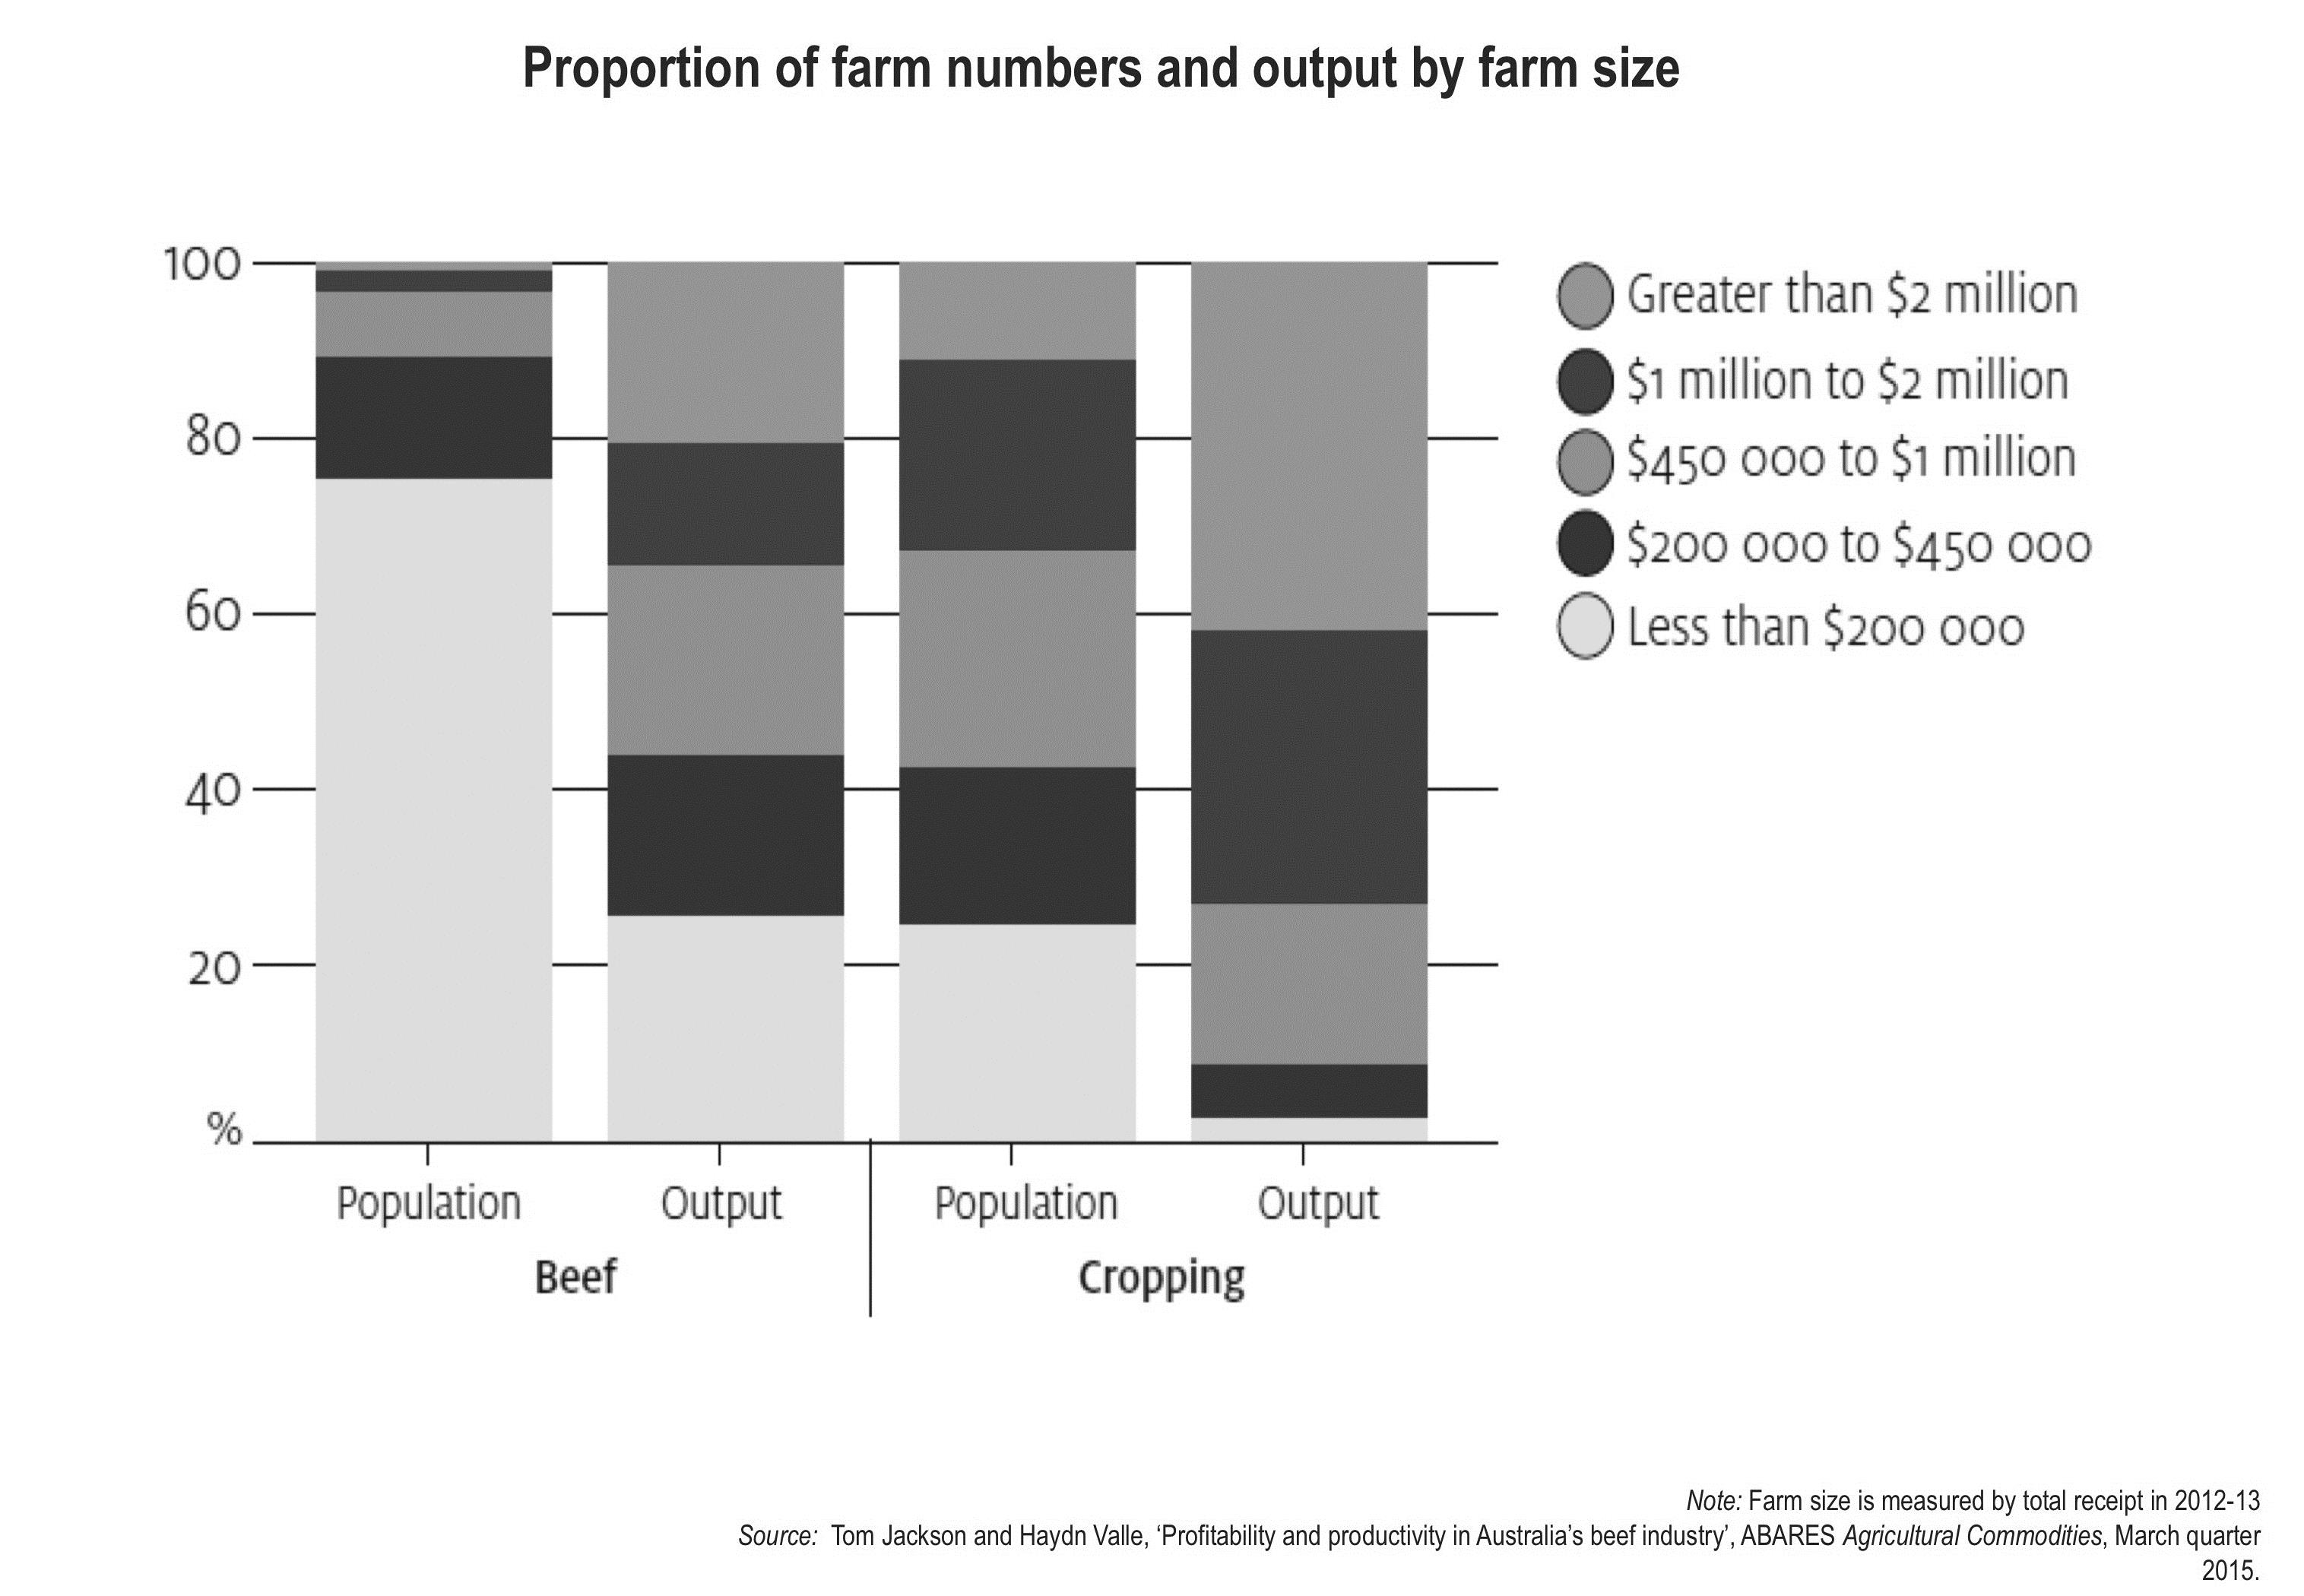
Figure 34: Proportion of farm numbers and output by farm size.
Farm size also has an important bearing on profitability, and hence on the capacity to invest in productivity improvement.
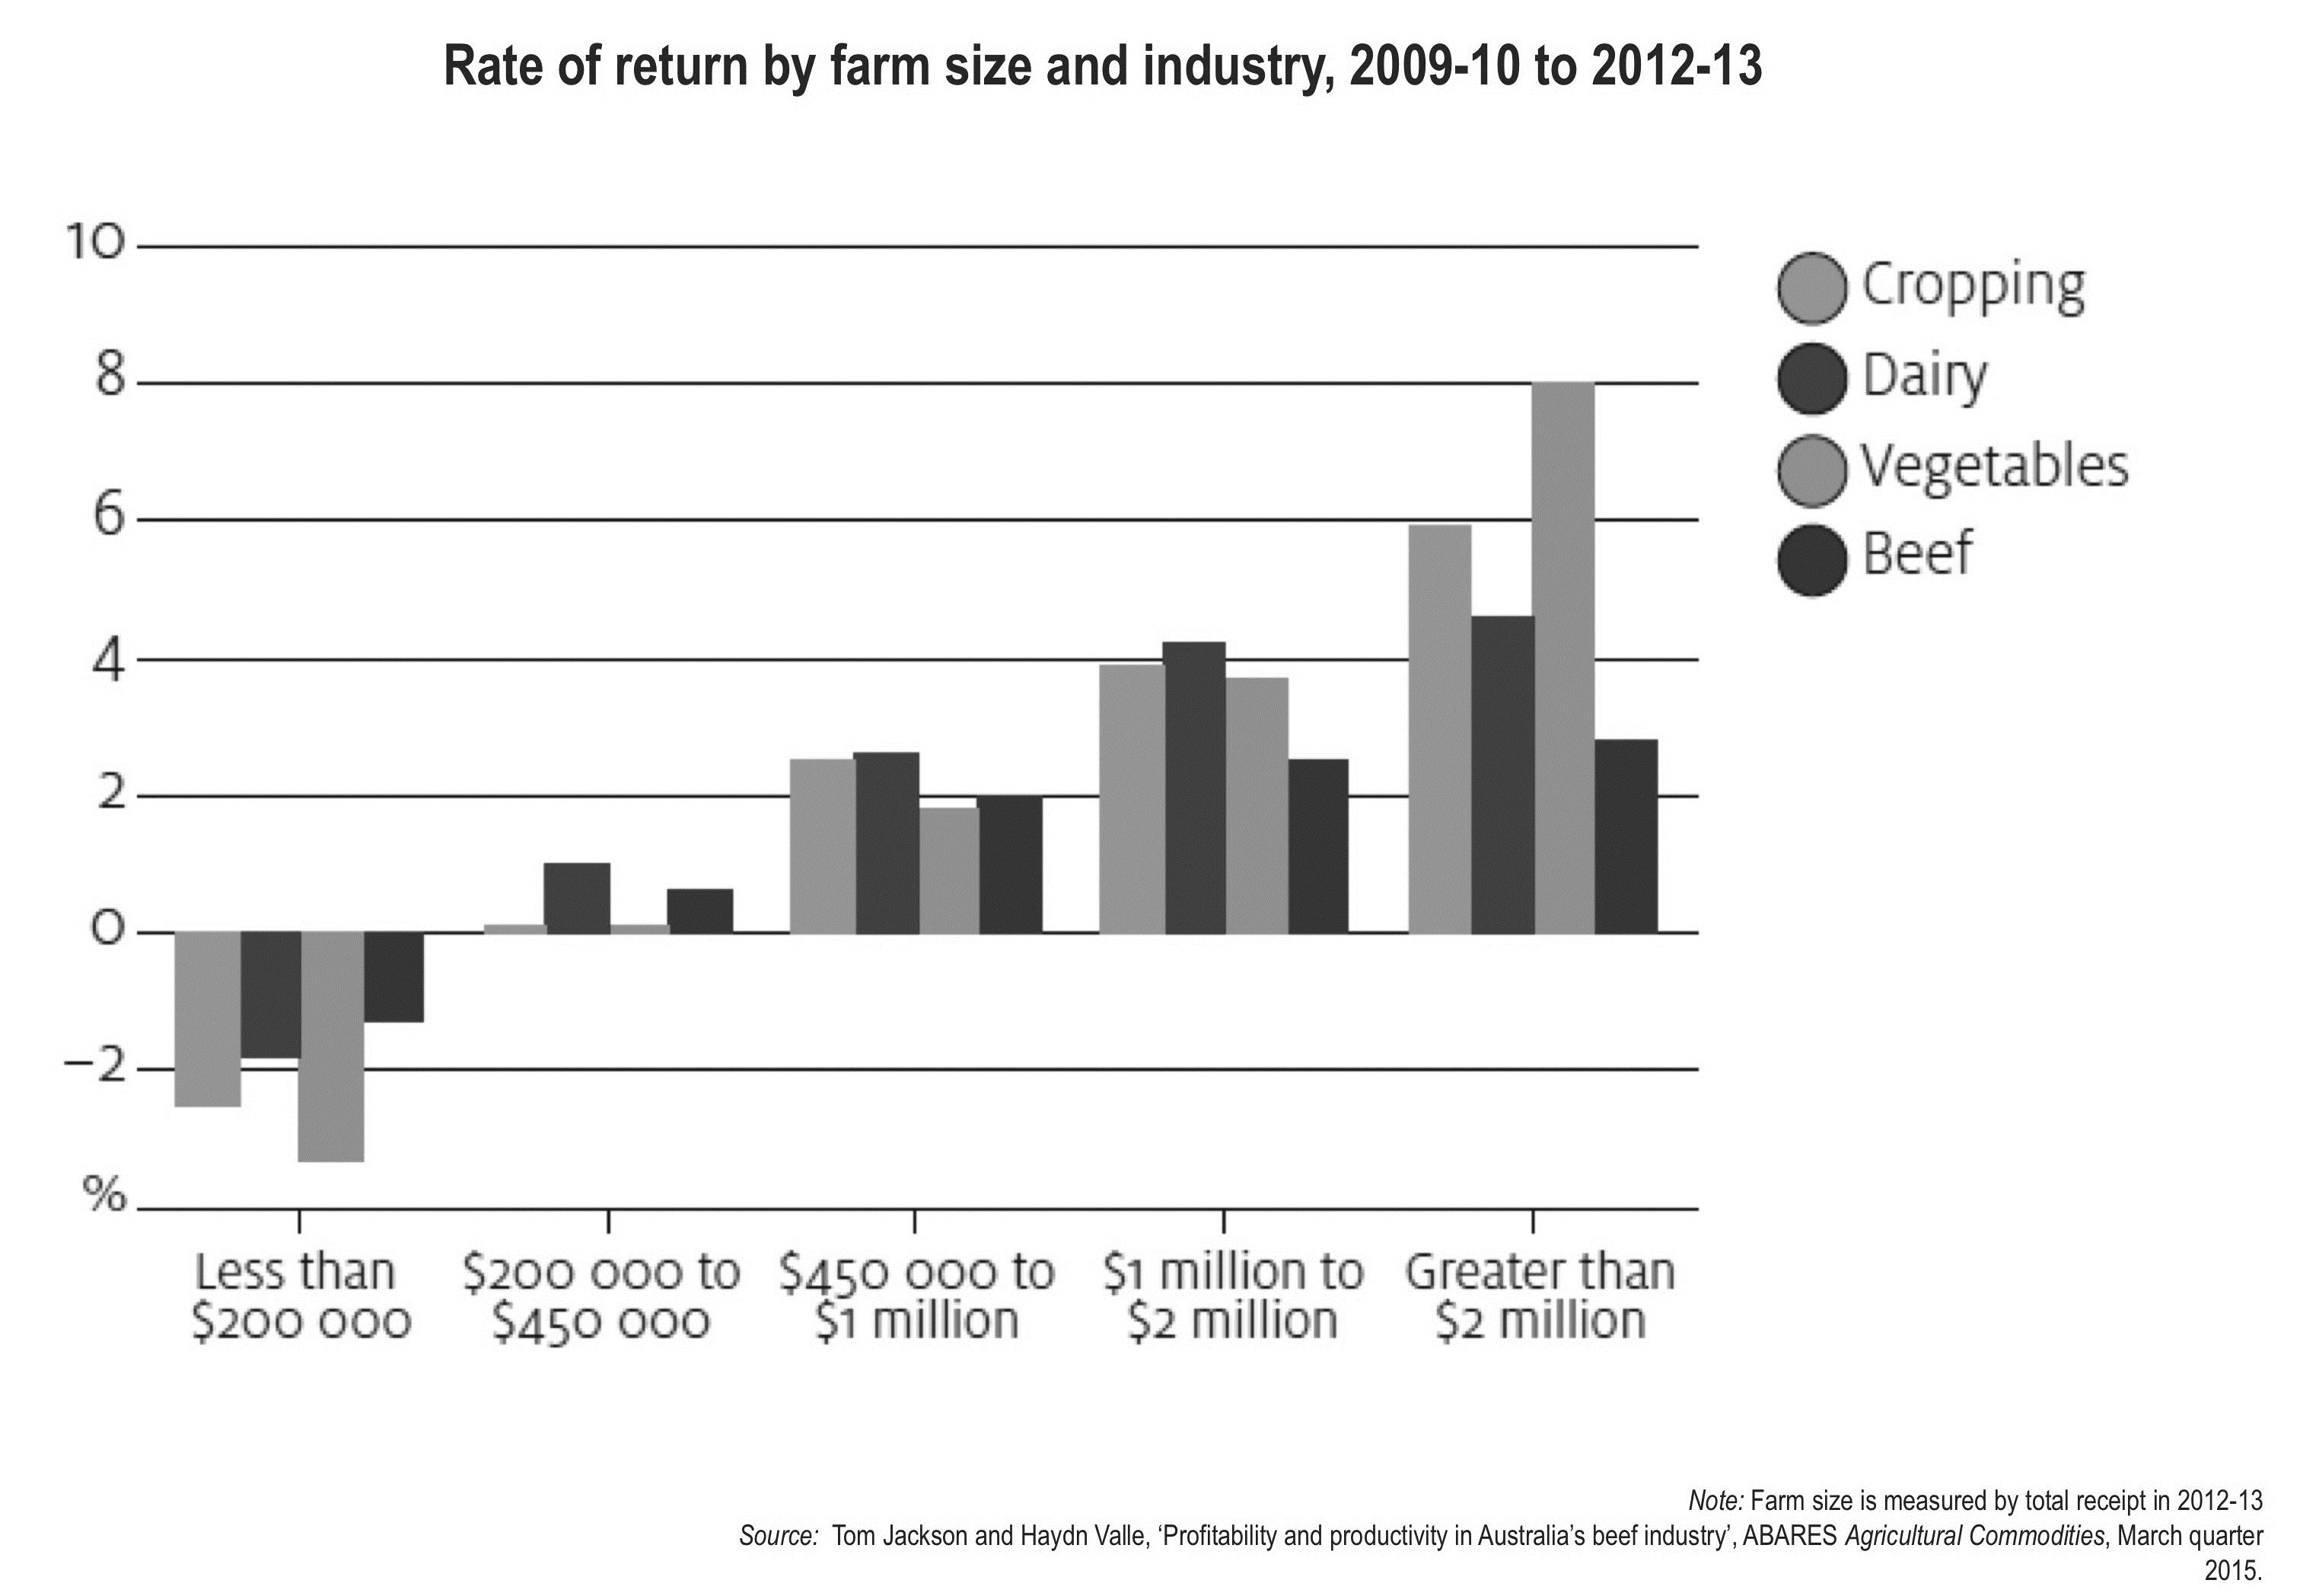
Figure 35: Rate of return by farm size and industry, 2009-10 to 2012-13.
Summary
What farmers need to know about the economy
- The recovery from the global financial crisis has been slow and uneven:
- the US and the UK have been doing better than Japan and continental Europe,
- the US will likely start raising interest rates before the end of this year, and;
- this will likely see the US$ rising further against other currencies (including the A$).
- China’s economy is slowing – reflecting longer term demographic and structural influences, as well as the downturn in its property market and exports:
- but a ‘hard landing’ for the Chinese economy still seems a low-probability scenario.
- Australia’s ‘resources boom’ is rapidly fading away:
- although resources exports will continue growing, they don’t generate much employment and the prices received for them will likely continue to decline.
- The rest of the Australian economy still looks patchy:
- record low interest rates have led to record levels of new dwelling construction,
- but rapid increases in Sydney and Melbourne property prices aren’t doing much good.
- Weak growth in household incomes means household spending is only growing slowly.
- Sluggish consumer and government spending is making business cautious about investing.
- A lower A$ is now helping:
- in particular with tourism, but will also provide a boost to other sectors including agriculture.
- The Reserve Bank won’t cut interest rates any further – but they will remain low by historical standards for a long time.
- Rapid growth and rising living standards in Asian economies presents enormous opportunities for Australian agriculture:
- but Australian agriculture needs to attract capital and boost productivity to capture them.
Important information
This document has been prepared by Saul Eslake on behalf of Corinna Economic Advisory Pty Ltd, ABN 165 668 058 69, whose registered office is located at Level 11, 114 William Street, Melbourne, Victoria 3000 Australia.
This document has been prepared for the use of the party or parties named on the first page hereof, and is not to be further circulated or distributed without permission.
This document does not purport to constitute investment advice. It should not be used or interpreted as an invitation or offer to engage in any kind of financial or other transaction, nor relied upon in order to undertake, or in the course of undertaking, any such transaction.
The information herein has been obtained from, and any opinions herein are based upon, sources believed reliable. The views expressed in this document accurately reflect the author’s personal views, including those about any and all financial instruments referred to herein. Neither Saul Eslake nor Corinna Economic Advisory Pty Ltd however makes any representation as to its accuracy or completeness and the information should not be relied upon as such. All opinions and estimates herein reflect the author’s judgement on the date of this document and are subject to change without notice. The author and Corinna Economic Advisory Pty Ltd expressly disclaim any responsibility, and shall not be liable, for any loss, damage, claim, liability, proceedings, cost or expense (“Liability”) arising directly or indirectly (and whether in tort (including negligence), contract, equity or otherwise) out of or in connection with the contents of and/or any omissions from this communication except where a Liability is made non-excludable by legislation.
Any opinions expressed herein should not be attributed to any other organisation with which Saul Eslake is affiliated.
Contact details
Saul Eslake
www.bettercallsaul.com.au
Was this page helpful?
YOUR FEEDBACK