Deep phosphorus placement case study integrating research into Darling Downs farming systems
Author: John ‘Cowboy’ Cameron, “Kintyre”, Bongeen Qld and Bede O'Mara, Incitec Pivot Fertilisers, Toowoomba | Date: 31 Jul 2015
Take home messages
- Soil test and monitor each paddock for P status to ascertain the Colwell P and BSES P numbers at 0-10cm and 10-30cm soil depths before commencing a deep P investment.
- Also have a good understanding of soil type, soil origin and any subsoil constraints in the profile to lower effective PAWC, through additional soil testing at 30-60cm, 60-90cm depths.
- Deep P can be applied without investing in new equipment; rather, adapting or simply using what is already on farm.
- Identify a time in your crop rotation aiming to minimise impact on your following crop and rotation.
- Any substantial applications of deep P will take more than 1 year to provide a return on investment, more likely 2-3 years.
Background
A small group of growers and agronomists formed the Central Downs Grower Group (CDGG) in 2014. The group meets every 1-2 months, discussing all things farming, and usually has a guest speaker attend each meeting. The local trial conducted by the Central Downs Grower Group, who was engaged by a GRDC Agribusiness Trial Extension tender to look at facets of grower adoption of deep phosphorus integration into Downs farming systems.
The purpose of the trial is to provide industry with more clarity on how to apply deep fertiliser and to provide growers with more information on the outcomes of investing in soil nutrition.
Methods
A low P farm site was identified with a CDDG group member on the Darling Downs. A selection of P applications were applied using a predetermined randomised trial design replicated three times, to identify and assess the P responses and the practicalities of applying Deep P using farmer equipment.
Five (5) different P applications (combinations of varying rates & application row direction) and one (1) Nil P application were compared. These consisted of:
- Farmer Practice
- Deep rip 0P in the row
- Deep 40P with row
- Deep 0P across the row
- Deep 40 P across the row
- Seed only no starter or deep P
Granulock® Z at 40kg/ha (8.7kgP/ha) was applied in furrow with the seed at the planting operation across all treatments, except the Nil P (Treatment 6) plots.
The field trial site was previously a grass paddock until August 2013, at which time it was offset disced followed by three passes with a John Deere chisel plough. Soil tests for fertiliser requirements were undertaken in September 2013, the soil tests identified the low phosphorus status of the paddock. Very little rain fell during the 2013/14 summer fallow. 280mm of rain was recorded at the site during late March 2014, which allowed a crop planting opportunity in June 2014.
The randomised plots size width was 24m wide and 48m long. The trial site area was calibrated and measured using the tractor GPS system (Trimble) and each treatment received an appropriate GPS coordinate to enable individual compilation of data from the randomised configuration.
Phosphorus and tillage (rip) treatments were applied using a tyne planter fitted with Flexicoil 550lb breakout and stealth points.
This was immediately followed by Urea applications of up to 46kgN/ha (100kg/ha) were applied on 50cm row spacing’s with full disturbance (chisel plough) on 2/6/2014.
Lastly, the EGA Gregory wheat at 45kg/ha was planted the same day using the same Flexicoil adaptors. All tynes travelled in the same row. Granulock Z at 40kg/ha was applied in furrow with the seed at the planting operation across all treatments except the zero P (Treatment 6) plots.
Fuel consumption was noted from the tractor performance monitor during applications.
The trial site was soil cored for nutritional status and for soil moisture, taken early in the fallow (Sept 2014) at depths of 0-15cm, 15cm-30cm, 30cm-60cm, 60cm-90cm post planting.
Crop establishment counts were taken on 1/7/2014, 28DAS (days after sowing). The number of wheat seedlings established was counted at 10 sites per plot, each consisting of 1 metre of the row.
The EGA Gregory wheat trial site was tested for canopy density variations during the growing season using a hand held GreenSeeker® (3*10m of row scanned per plot). The scans were taken at GS 30-31 and GS 41. Dry matter cuts were also taken at GS 41.
The plots were harvested on 3/11/2014 and bin-weighed. From each trial plot the grain was tested for moisture, screenings, protein and test weighed kg/HL. Each grain sample was tested and categorised through the local grain handler in accordance to the national bin-grading standard. Grain samples from each plot were tested for their nutrient concentration and assessed for the nutrient removal per 1000kgs (1T) of grain/ha.
Each trial site treatment was soil tested post-harvest for its nutritional and moisture status within the row and inter-row. Each treatment was assessed for its nutrient removal and evaluated against the treatment costs.
WUE calculations were not completed, as rainfall records for the preceding fallow were unavailable, and growing season rainfall (GSR) was only 22mm in August 2014.
Monitoring of each site treatment for soil moisture, soil nutritional changes and grain removal will continue in 2015 and 2016.
Results
Grain yield
Decile 1 rainfall received during the 2014 wheat crop at ‘Knapdale’ delivered both disappointment and optimism. Whilst grain yields grown were well below average, the grain yield difference between the treatments was encouraging. In a more average season, it is expected that the base yield level would be significantly higher than in 2014, thus markedly increasing the returns from the treatments applied, and potentially reducing the number of crops required to break-even.
All grain yield figures are presented as moisture corrected to 12%, to allow comparison.
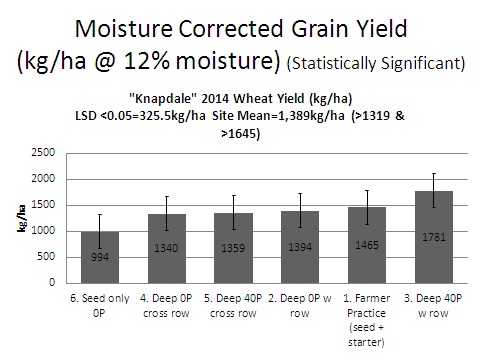
Figure 1. 2014 CDGG trial grain yield
Significant grain yield differences were observed (Figure 1) between treatment 6 (seed only-nil P applications) @ 994kg/ha grain-and all other treatments: treatment 4 (Deep rip 0P, cross row), treatment 5 (Deep rip 40P cross row), treatment 2 (Deep rip 0P with row), and treatment 1 (Farmer practice seed + starter) @ 1340kg/ha, 1359kg/ha, 1394kg/ha, and 1465kg/ha respectively.
Grain yield differences between treatments 4, 5, 2, and 1 (i.e. the lowest yielding treatment) were not statistically significant.
Grain yield differences between treatment 3 and 1 (i.e. highest yielding to the second highest yielding treatment) were not statistically significant.
However, grain yield differences were significant between treatment 3 (Deep rip 40P with row) @ 1781kg/ha grain yield, (i.e. the highest yielding treatment) to treatments 2, 4, 5 and 6 compared in the trial.
Grain yield results from 2014 indicate that application of deep immobile nutrients like phosphorus in bands close in proximity to the intended crop row is important for crop access, and thus provides maximum benefit for the first crop following application.
Grain quality
No statistically significant differences were observed in grain protein, screenings, and grain weight between treatments. Given the below average seasonal conditions experienced, no particular trends were observed.
Grain nutrient removal
Table 1. 2014 CDGG Trial Grain Nutrient Removal data
| Trt | Treatment | Total Crop N removal (kg/ha) | kg/ha of P removed per tonne of grain | Total P removal (kg/ha) | Total K removal (kg/ ha) | **Total Zn removed per ha (grams/ha) |
| 1 | Farmer Practise |
30.57 | 2.50 | 3.66 | 5.76 | 33.21 |
|---|---|---|---|---|---|---|
| 2 | Deep 0P with row | 28.51 | 2.53 | 3.53 | 5.53 | 30.67 |
| 3 | Deep 40P with row | 35.89 | 2.67 | 4.75 | 7.18 | 35.62 |
| 4 | Deep 0P cross row | 27.24 | 2.63 | 3.53 | 5.32 | 29.48 |
| 5 | Deep 40P cross row | 28.69 | 2.67 | 3.62 | 5.30 | 28.54 |
| 6 | Seed only, nil starter or deep P | 20.81 | 2.30 | 2.29 | 3.55 | 24.85 |
Table 1 compares the nutrient removal of the farmer practice (Treatment 1) against the highest and lowest yielding treatments (Treatments 3 and 6 respectively). It is noted that increasing yield generally drove a corresponding increase in grain nutrient removal.
Where any phosphorus was added (Treatments 1, 2, 3, 4 and 5) compared to none in the seed only (Treatment 6), a resultant increase in kilograms of phosphorus removal per tonne of grain was observed in Table 1. This increase in grain phosphorus concentration suggests that the applied phosphorus indeed made it into the plant, and into the grain and that the highest phosphorus removal rates per tonne of grain came from treatments 3 and 6, where the highest total phosphorus rates were supplied.
Further then, grain yield corresponded with the highest total phosphorus removal per hectare. The highest yielding Deep rip + 40P treatment (Treatment 3) removed significantly higher total phosphorus kg/ha, or 107% greater total P removal than the seed alone treatment (Treatment 6), with 79% additional yield.
The farmer practice (Treatment 1) also removed more total phosphorus per hectare than the seed alone Treatment 6. In fact, 60% greater total P removal per hectare in Treatment 1 from a 47% yield increase compared to Treatment 6 (seed only nil P).
From the 2014 trial season, it is noted that the farmer practice (Treatment 1) phosphorus application of starter @ 8.7kgP/ha, exceeded that of crop removal of 3.66kgP/ha for the same treatment by 5.06kgP/ha. It is suggested that additional yield contribution and thus additional total phosphorus removal per hectare was supplied from the additional with row Deep rip+40P from Treatment 3.
As mentioned earlier, given the well below average season and yield outcomes in 2014, it is expected that average seasonal property wheat yields under the same fallow treatment would be closer to 4t/ha, thus P removal rates from starter P would be in the vicinity of 10kgP/ha. This would mean that the applied Farmer Practice P rate of 8.7kgP/ha falls just shy of replacing removed P from wheat.
Higher nitrogen, potassium and zinc (removals per hectare) were observed where additional phosphorus was supplied (Treatments 1, 2, 3, 4 and 5) and all were greater than in the nil P seed only treatment (Treatment 6) nitrogen, potassium and zinc totals removed in kilograms per hectare.
Economics
Table 2. 2014 CDGG trial economics
| Trt | Treatment | Treatment cost $/ha (net of pre-plant urea) | Mean Yield (t/ha) @ 12% moisture | Grain Price $/t (AUH2) | Total revenue $/ha | Net return (total rev - planting, deep rip & P fert costs) $/ha | $/ha net return variance (vs Farmer Trt) |
|---|---|---|---|---|---|---|---|
| 1 | Farmer Practice | $102.50 | 1.465 | $315.00 | $461.48 | $358.98 | - |
| 2 | Deep 0P with row | $171.50 | 1.394 | $315.00 | $439.11 | $267.61 | -$91.37 |
| 4 | Deep 0P cross row | $171.50 | 1.340 | $315.00 | $422.10 | $250.60 | -$108.38 |
| 3 | Deep 40P with row** | $315.50 | 1.781 | $315.00 | $561.02 | $245.52 | -$113.46 |
| 6 | Seed only, nil starter or deep P | $70.50 | 0.994 | $315.00 | $313.11 | $242.61 | -$116.37 |
| 5 | Deep 40P cross row | $315.50 | 1.359 | $315.00 | $428.09 | $112.59 | -$246.39 |
(*NOTE: Treatment costs: planting + starter @ $102.50/ha; planting nil starter @$70.50/ha; Deep cult 0P @ $70/ha; Deep cult + 183kg/ha Granulock®Z @ $213/ha)
Whilst the benefits from applied phosphorus as starter fertiliser to a responsive soil are well documented, these results clearly reinforce that benefit. This is demonstrated in Table 2 by the additional 0.471t/ha grain yield achieved from the farmer practice treatment (Treatment 1: seed + starter @ 8.7kgP/ha) which realised a $116.37/ha greater net return than that of the seed alone nil P treatment (Treatment 6).
The effects of deep ripping in treatments 2 and 4 (rip + zero P) regardless of rip direction, provided a negative economic return, despite additional grain yields and net returns of up to $25/ha greater than the seed only treatment (treatment 6).
Even when additional deep P was added with the deep rip in treatment 5 (deep 40P cross row), the grain yield remained similar at 1.359t/ha compared to treatments 2 and 4, with grain yields of 1.394t/ha and 1.340t/ha respectively. Further, the added cost of the deep fertiliser eroded the returns to the point that an additional $144/ha investment resulted in no additional return from this investment from this crop. Hopefully rip direction, fertiliser row direction and season were to blame here, and it is hoped that crop recovery of the deep applied P fertiliser is measured in future years.
Treatment 3 (deep rip + 40P) was the highest yielding treatment (as seen in Figure 1), and yielded an additional 0.316t/ha than the farmer practice treatment (Treatment 1: seed + starter @ 8.7kgP/ha). Treatment 3 also provided additional net revenue of $99.54/ha, better than the farmer practice (Treatment 1), however the additional fertiliser investment and application cost of $213/ha for Treatment 3, meant that a negative net return/ha of $113.46 was the result from this crop.
Summary
It is difficult to assess the overall benefits of Deep P in one season; further monitoring will provide a better understanding of the long term and economic benefits. The higher rates of Deep applied 40kg/ha P did not return an economic return in Year 1, however further assessments in future years from average seasons will enable a more informed evaluation.
Deep placement of P and tillage is expensive and any future benefit is still to be evaluated, a standard rate of 8.7kgs of P per ha (40kgs of Granulock® Z) has provided the most economic return as the farmer practice. Importantly, soil testing for nutrients and constraints, using relevant interpretation logic and paddock cropping history are critical tools for assessing the need for the deep placement of P.
Table 2 clearly indicated that the practice of not applying any starter P to low P soils would provide negative economic returns.
Acknowledgements
The research undertaken as part of this project is made possible by the significant contributions of growers through both trial cooperation and the support of the GRDC. The authors would like to thank them for their continued support:
- Mr John ‘Cowboy’ Cameron-Grower.
- Mr Jamie Innes-Agronomist, Landmark.
- Mr Michael T Burgis & Associates-Consultant.
- Mr Dale Jeude and all members of the Central Downs Grower Group.
- Mr John Piper and all members of the Clifton-Allora Topcrop Group.
- Dr Mike Bell-QAFFI
- Dr David Lawrence and Mr Brad Taylor-DAF Qld.
- Mr Howard Cox and Dr Andrew Zull-DAF Qld.
- Dr Alison Kelly-Statistics for the Australian Grains Industry (SAGI)-DAF Qld.
Contact details
John ‘Cowboy’ Cameron
“Kintyre” Bongeen, Qld, 4356
Ph: 0427 037 212
Email: cowboy.3@bigpond.com
Reviewed by
Michael Burgis
Varieties displaying this symbol beside them are protected under the Plant Breeders Rights Act 1994.
Granulock® is a registered trademark of Incitec Pivot Limited.
Incitec Pivot Fertilisers is a business of Incitec Pivot Limited, ABN 42 004 080 264.
GreenSeeker® is a registered trademark of Trimble Navigation Limited.
GRDC Project Code: CLI00001,
Was this page helpful?
YOUR FEEDBACK