Diseases of pulse crops in 2014
Author: Rohan Kimber, Jenny Davidson, Matthew Rodda, Mohammad Aftab and Jeff Paull | Date: 10 Feb 2015
Rohan Kimber1, Jenny Davidson1, Matthew Rodda2, Mohammad Aftab2 and Jeff Paull3,
1South Australian Research and Development Institute; 2Victorian Department of Environment and Primary Industries; 3University of Adelaide, School of Ag, Food and Wine, Waite Campus, South Australia.
GRDC project codes: DAS00139, DAV00129, DAV0119, UA00127
SAGIT project codes: S1208, S1203
Keywords: Ascochyta lentis, Ascochyta fabae, blackspot, Botrytis, virus, virulence, resistance.
Take home message
- A virulent strain of Ascochyta lentis able to infect the previously resistant cultivar Nipper is widespread across South Australia and Victoria. This cultivar should be managed similar to Nugget for ascochyta blight.
- A virulent strain of Ascochyta fabae able to infect PBA Rana and Farah is common in the lower and mid north of South Australia. These crops will require foliar fungicides when grown in these regions.
- Geographical effects on Ascochyta fabae resistance, that represent ‘point of origin’ of resistant faba bean accessions, illustrate the need for sourcing diverse germplasm.
- Low infection rate from Beet Western Yellows Virus (syn: Turnip Yellows Virus) inferred this virus had minimal impact on pulse crops in 2014.
- Crop topping timing and delayed harvest timing can reduce faba bean seed quality.
Ascochyta blight
Faba beans
Ascochyta blight leaf spot was observed at high levels in many crops in mid-winter, as a result of spread during ongoing rain. Some crops of Farah and PBA Rana were affected in the lower and mid north of SA where a new virulent strain of the fungus has been identified. Farah should now be considered susceptible to the disease, comparable with Fiesta, and managed accordingly viz. early fungicide sprays ahead of rain events during late July and early August to slow the spread of disease, with follow up sprays in spring ahead of rain events to prevent pod infection.
Detailed controlled environment testing of Ascochyta fabae isolates collected from the mid-North of the state confirmed that several new isolates had overcome the resistance of Farah and PBA Rana, but Ascot, Nura and PBA Samira remain resistant. This has prompted large-scale screening in 2014 of breeding material and sources of resistance to Ascochyta blight that had been selected in previous years, to identify lines resistant to the “new” pathotype. Over 80 germplasm accessions were tested with isolates that represented the “old” (collected in 2010) and “new” (collected in 2013) pathotypes. The results showed 73 accessions, with an overall rating of three or less, were resistant to the “old” pathotype, but only 24 of these accessions were also resistant to the “new” pathotype (Figure 1). What was also shown was the presence of distinct geographical variation, related to the ‘point of origin’ where these sources of germplasm were collected. The majority of accessions resistant to the “new” pathotype originated from the Middle East and Mediterranean Basin, while accessions from China were susceptible or very susceptible to the “new” pathotype (Figure 1). There was also considerable variation in the reaction of accessions within a region; for example, while some lines from the Middle East were resistant, others were moderately susceptible to very susceptible to the “new” pathotype (Figure 1).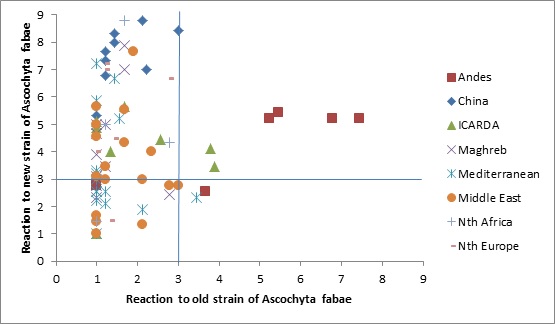
Figure 1. Reaction of faba bean accessions to “old” and “new” isolates of Ascochyta fabae. Accessions are colour coded to indicate their ‘point of origin’ within geographical regions. Plants were inoculated with a spore suspension of a single isolate and maintained under humid conditions in a glasshouse. Disease was rated on a scale of 1 (resistant) to 9 (very susceptible).
Lentils
Ascochyta blight was very low on lentils in 2014 due to the dry conditions during August and spring. However growers should be vigilant about controlling this disease as inoculum will carryover for two to three seasons. Isolates of Ascochyta lentis have been collected from numerous naturally infected lentil field trials in South Australia and Victoria from 2010 to 2014 and tested in controlled environment conditions on five lentil hosts viz; Indianhead, ILL7537, Nipper, Northfield and the susceptible check Cumra. Infection on the cultivar Nipper is increasingly common and ascochyta blight lesions have become more aggressive on this cultivar in recent years. Of the 21 isolates collected in 2013 from Nipper, the four most aggressive in controlled studies were originally from Hart, Riverton, Melton and Kulpara and the remaining 17 isolates were from ten sites on Yorke Peninsula and from Tarlee. The lentil entries in the 2014 National Variety Trials were tested against an isolate virulent on Nipper as well as an isolate avirulent on Nipper. Results of the virulent isolate were comparable with disease assessments in the PBA breeding trial at Mallala in 2013 and the PBA breeding trial at Horsham in 2014 (Table 1). The correlation coefficient for comparison of the Nipper virulent isolate (FT12013) with Mallala = 0.82 (P<0.001) and with Horsham raw data = 0.87 (P<0.001); the correlation coefficient for comparison of the Nipper avirulent isolate (FT10002) with Mallala = 0.53 (P<0.02) and with Horsham raw data = 0.68 (P<0.001). Results were comparable between the two field sites i.e. correlation coefficient = 0.92 (P<0.001). These results indicate the widespread nature of the Nipper virulent form of A. lentis. This work is funded by the South Australian Grains Industry Trust (SAGIT).
Table 1. Ascochyta blight disease scores on National Variety Trial lentils 2014 inoculated with three separate isolates of Ascochyta lentis in a controlled environment room compared to disease scores in Mallala PBA trial in 2013 and Horsham PBA trial 2014. Results in isolate tests show the % plant disease on two week old seedlings averaged for four plants x four replicates. Results for Mallala and Horsham trials are averaged for three replicates.
|
Total % Plant Score |
|||||||
|---|---|---|---|---|---|---|---|
|
Lentil line |
Control isolate |
Avirulent isolate on Nipper |
Virulent isolate on Nipper |
Mallala PBA trial 2013 |
Horsham PBA trial 2014 |
||
|
|
Kewell |
FT10002 |
FT12013 |
raw data |
Sqrt Asco % raw data |
||
|
BOOMER |
0.00 |
0.08 |
1.42 |
0.0 |
1.10 |
||
|
CIPAL 0901 |
6.25 |
0.00 |
0.00 |
0.0 |
0.55 |
1.2 |
|
|
CIPAL 1204 |
2.67 |
0.00 |
0.42 |
0.0 |
0.54 |
0.3 |
|
|
CIPAL 1301 |
0.00 |
0.00 |
0.08 |
0.0 |
0.36 |
0.3 |
|
|
CIPAL 1302 |
13.75 |
0.00 |
0.08 |
0.0 |
0.53 |
0.1 |
|
|
CIPAL 1303 |
7.08 |
0.00 |
0.92 |
0.0 |
0.41 |
0.3 |
|
|
NIPPER |
0.00 |
0.08 |
8.33 |
13.3 |
2.20 |
0.2 |
|
|
NORTHFIELD |
0.83 |
3.64 |
17.92 |
3.3 |
1.88 |
4.9 |
|
|
NUGGET |
1.75 |
5.50 |
12.50 |
8.3 |
2.20 |
3.5 |
|
|
PBA ACE |
0.00 |
0.00 |
0.00 |
0.0 |
0.36 |
5.2 |
|
|
PBA BLITZ |
1.00 |
5.25 |
3.08 |
3.3 |
1.18 |
0.1 |
|
|
PBA BOLT |
0.67 |
0.00 |
0.00 |
1.7 |
0.53 |
1.4 |
|
|
PBA BOUNTY |
0.09 |
1.58 |
9.64 |
10.0 |
2.08 |
0.3 |
|
|
PBA FLASH |
3.67 |
4.58 |
22.92 |
28.3 |
3.51 |
4.3 |
|
|
PBA GIANT |
1.08 |
1.25 |
1.64 |
3.3 |
2.00 |
12.3 |
|
|
PBA GREENFIELD |
0.00 |
3.58 |
5.91 |
1.7 |
2.37 |
4.0 |
|
|
PBA HERALD |
0.08 |
0.00 |
0.00 |
0.0 |
1.00 |
5.6 |
|
|
PBA JUMBO |
1.42 |
3.33 |
14.17 |
8.3 |
2.25 |
1.0 |
|
|
PBA JUMBO2 |
0.83 |
0.00 |
0.00 |
0.0 |
0.03 |
5.0 |
|
|
PBA HURRICANE |
8.17 |
0.08 |
0.08 |
0.0 |
0.67 |
0.0 |
|
|
Isd |
3.88 |
1.9 |
0.34 |
0.4 |
|||
Field peas
Blackspot on seedling crops of field peas was severe in some districts due to frequent rain events. This was despite the relatively low risk forecast by Blackspot Manager. Ongoing rain through June and July created continual spore splash which overcame this predicted lower risk.
Botrytis diseases on seedling pulse crops
Chocolate spot lesions on faba beans were identified in the lower north region of South Australia and unconfirmed reports of the same disease came from Eyre Peninsula. The warm, humid conditions early in the season allowed the fungus, Botrytis fabae, to infect seedling crops. These infections were a risk to the crops as they act as disease foci once the canopies close over. Botrytis grey mould was also severe on vetch crops in the mid north of SA due to the unusually mild conditions during late May to June. The dry conditions in August and spring halted the progression of these diseases.
Viruses in pulse crops 2014
The presence of six different viruses in pulse and medic crops and trials was tested in mid-winter (July – August) and again in mid spring (late September – October) with results presented in Table 2. There were few obvious symptoms of virus infection in the majority of pulse crops, except for medic stands and the occasional lentil crop with yellowing and reddening symptoms associated with virus infection. Beet Western Yellows Virus (BWYV) (synonym: Turnip Yellows Virus) was detected in all pulse crop types with a generally low infection rate although one lentil crop recorded 92% infection. Results suggested that yield loss was negligible in pulses from BWYV. Conversely the 44.3% average infection rate in the seven positive medic tests inferred that medics had production losses from BWYV infection. Pea Seed borne Mosaic Virus (PSbMV) was present at low levels in faba beans while two of the field pea sites recorded approximately 20% infection from this virus. Cucumber Mosaic Virus (CMV) was not widespread and where present had low infection rates, although one lentil crop showed 100% infection rate and one medic stand 20% infection rate. Alfalfa Mosaic Virus (AMV) was only detected in two crops but the faba bean crop had 100% infection. Bean Leaf Roll Virus (BLRV) and Bean Yellow Mosaic Virus (BLRV) were not detected at any of the sites.
Table 2. Results of virus testing in pulse and medic crops and trials in South Australia in 2014.
|
Crop type |
Number of crops or trials tested |
Test period |
Number of crops with positive virus tests (average % infection rate in brackets) |
|||||
|---|---|---|---|---|---|---|---|---|
|
|
|
|
BWYV |
PSbMV |
CMV |
AMV |
BLRV |
BYMV |
|
faba beans |
24 |
Jul - Aug |
6 (2%) |
4 (4.5%) |
0 |
1 (100%) |
0 |
0 |
|
19 |
Sep - Oct |
11 (2%, 1 at 62%) |
1 (6%) |
0 |
0 |
0 |
0 |
|
|
field peas |
9 |
Jul - Aug |
8 (20.1%) |
7 (6.1%) |
1 (2%) |
0 |
0 |
0 |
|
6 |
Sep - Oct |
4 (3%) |
4 (20.5%) |
0 |
0 |
0 |
0 |
|
|
lentil |
10 |
Jul - Aug |
3 (4%, 1 at 92%) |
0 |
3 (1%, 1 at 100%) |
0 |
0 |
0 |
|
4 |
Sep - Oct |
3 (2.7%) |
0 |
2 (6.5%) |
1 (4%) |
0 |
0 |
|
|
chickpea |
11 |
Jul - Aug |
1 (1%) |
0 |
0 |
0 |
0 |
0 |
|
5 |
Sep - Oct |
1 (2%) |
0 |
0 |
0 |
0 |
0 |
|
|
medic |
11 |
Jul - Aug |
7 (44.3%) |
0 |
1 (20%) |
0 |
0 |
0 |
|
lupin |
1 |
Jul - Aug |
1 (13%) |
0 |
0 |
0 |
0 |
0 |
|
vetch |
2 |
Jul - Aug |
0 |
0 |
0 |
0 |
0 |
0 |
BWYV = Beet Western Yellow Virus (synonym: Turnip Yellows Virus)
PSbMV= Pea Seed borne Mosaic Virus
CMV = Cumcumber Mosaic Virus
AMV = Alfalfa Mosaic Virus
BLRV = Bean Leafroll Virus
BYMV = Bean Yellow Mosaic Virus
Seed quality in faba bean – trial results 2013
The agronomic practices of crop topping and windrowing on faba bean grain quality, as well as the impact of mechanical damage (e.g. wheel-tracks), were examined in three field trials conducted in three growing regions (Eyre Peninsula, Mid North and South East). Preliminary results from the 2013 trials are presented in this paper. This research is funded by SAGIT to examine the issue of field mould in faba bean, and is conducted in collaboration with the Southern Pulse Agronomy project, which is funded by the GRDC. Several grain quality attributes were examined on seed harvested from the different treatments: total number of blemished seed (accumulative measure), colour tone (measured using Minolta Chroma meter CR-310), 100 grain weight, grain uniformity (visual – colour and size score), number of weather-stained seed, number or shrivelled seed, number of seed with ascochyta staining, number of seed with residual adhesions from pod wall. These parameters were used to measure seed quality, in relevance to the potential incidence of field mould and impact of potential down grading or rejection lots at grain receival silos.
The results are presented in Tables 3-8. The 2013 season was not favourable to the development of field mould on seed at the sites examined in this study. The climatic conditions experienced in the spring were relatively dry, though conductive conditions to disease were experienced in winter and some spring rains did perpetuate development of ascochyta staining on seed and weather damage to developed pods. The trends observed from this study can be used to provide a guide as to the dynamics of factors affecting seed development that may occur in seasons of wet conditions in spring or early summer.
The key take home messages of the impact of agronomic practices examined in faba bean seed quality were:
- Variety has a significant effect on seed quality. Fiesta (and Farah included in the EP trial) was consistently shown to have poorer seed quality than PBA Rana (Table 3, 4 and 6-8).
- Mechanical damage (wheel-tracks) has little to no effect on the main seed quality attributes (data not presented). However, a higher incidence of chocolate spot was recorded in damaged plots, which could present instances of reduced seed quality when conditions remain conducive.
- The practice of windrowing in itself had no effect on seed quality (Table 3). Significant differences such as colour, grain weight and uniformity was driven by variety type (PBA Rana being superior).
- The influence of windrowing timing (early, mid & late) had little effect on seed quality. However, when a late windrow treatment was combined with a late harvest treatment (mimicking leaving windrow for longer period before pickup), a significant reduction in seed quality was seen (Table 4 and 5). The variety Fiesta was more susceptible to this effect than PBA Rana.
- Crop topping timing had a significant effect on seed quality at the EP trial (Table 6), where early implementation of crop topping increased shrivelling, weather staining and exposure to ascochyta staining. This site was the wettest site of the three in 2013, and this effect was not evident within the SE and MN trials.
- The superior seed quality of PBA Rana showed it was more tolerant to the variation of agronomic practises that might affect seed quality examined in this study, compared to Fiesta and Farah which have less consistent colour and size.
Further analyses are being conducted on the effect of crop topping on newer variety types, and results from the 2014 trials are being collated.
2013 Field Mould trials – Summary table of analyses
|
Table 3: Windrow treat Eyre Peninsula |
Fiesta x Windrow |
Rana x Windrow |
Fiesta x Conv |
Rana x Conv |
LSD (P) |
Fiesta mean |
Rana Mean |
LSD (P) |
Windrow Mean |
Conv Mean |
LSD (P) |
|---|---|---|---|---|---|---|---|---|---|---|---|
|
Blemish total |
NS |
NS |
NS |
NS |
ns |
NS |
NS |
ns |
NS |
NS |
ns |
|
Colour tone |
NS |
NS |
NS |
NS |
ns |
57.66 |
58.89 |
0.86 (0.013)) |
58.34 |
58.21 |
ns |
|
100grain wt |
NS |
NS |
NS |
NS |
ns |
68.62 |
75.15 |
1.85 (<0.001) |
70.88 |
72.89 |
2.56 (0.09) |
|
Uniformity |
1.75 |
1.75 |
2.75 |
1.5 |
1.653 (0.04) |
2.25 |
1.62 |
0.586 (0.04) |
2.12 |
1.75 |
ns |
|
Stain |
NS |
NS |
NS |
NS |
ns |
NS |
NS |
ns |
NS |
NS |
ns |
|
Shriveling |
NS |
NS |
NS |
NS |
ns |
NS |
NS |
ns |
NS |
NS |
ns |
|
Table 4: Windrow treat Mid North |
Fiesta Mean |
Rana Mean |
LSD (P) |
Early WR |
Mid WR |
Late WR |
Late WR - delay |
LSD (P) |
Comment |
|---|---|---|---|---|---|---|---|---|---|
|
Blemish total |
15.6 |
4.1 |
5.61 (<0.001) |
7.0 |
4.2 |
8.9 |
19.2 |
7.94 (0.004) |
Interaction |
|
Colour tone |
52.72 |
54.16 |
0.75 (<0.001) |
52.49 |
54.42 |
54.04 |
52.8 |
1.06 (0.003) |
No interaction |
|
Uniformity |
3.77 |
2.00 |
0.53 (<0.001) |
NS |
NS |
NS |
NS |
NS |
Interaction |
|
Stain |
6.24 |
1.5 |
3.21 (0.006) |
3.5 |
1.73 |
2.5 |
7.75 |
4.53 (0.052) |
No interaction |
|
Shriveling |
3.43 |
0.56 |
1.21 (<0.001) |
2.5 |
0.6 |
1.62 |
3.25 |
1.72 (0.025) |
No interaction |
|
Asco (seed) |
5.5 |
1.94 |
2.48 (0.007) |
1.0 |
1.76 |
4.38 |
7.75 |
3.50 (0.003) |
Interaction |
|
Table 5: Windrow treat Mid North -interaction |
Fiesta x Early WR |
Rana x Early WR |
Fiesta x mid WR |
Rana x Mid WR |
Fiesta x Late WR |
Rana x Late WR |
Fiesta x late WR - delay |
Rana x Late WR - delay |
LSD (P) |
|---|---|---|---|---|---|---|---|---|---|
|
Blemish total |
11.2 |
2.7 |
5.3 |
3.0 |
13.0 |
4.8 |
32.8 |
5.8 |
11.23 (0.023) |
|
Colour tone |
NS |
NS |
NS |
NS |
NS |
NS |
NS |
NS |
NS |
|
Uniformity |
5.00 |
1.75 |
3.10 |
2.00 |
3.00 |
2.50 |
4.00 |
1.75 |
1.06 (0.005) |
|
Stain |
NS |
NS |
NS |
NS |
NS |
NS |
NS |
NS |
NS |
|
Shriveling |
NS |
NS |
NS |
NS |
NS |
NS |
NS |
NS |
NS |
|
Asco (seed) |
1.5 |
0.5 |
1.76 |
1.75 |
6.25 |
2.5 |
12.5 |
3.0 |
4.95 (0.045) |
Notes relevant to analysis:
The interaction (Variety by Windrow) is presented first in Table 3. Interaction effects were only observed in the Mid-North trial (Table 5).
Conv = Conventional harvest.
|
Table 6: Crop Top x Fungicide x Variety – Eyre Pen |
CT Timing Early |
CT timing Mid |
CT Timing Late |
Ct timing Nil |
LSD (P) |
AF08014 mean |
Farah mean |
Fiesta Mean |
Rana Mean |
LSD (P) |
Comment |
|
|---|---|---|---|---|---|---|---|---|---|---|---|---|
|
Blemish total |
41.40 |
19.90 |
10.20 |
10.20 |
16.86 (0.012) |
19.20 |
26.00 |
25.80 |
10.70 |
6.28 (<0.001) |
Interaction |
|
|
Colour tone |
52.01 |
53.02 |
52.97 |
53.24 |
0.54 (0.006) |
54.80 |
51.75 |
51.49 |
53.24 |
0.56 (<0.001) |
No interaction |
|
|
100grain wt |
60.40 |
68.33 |
67.55 |
69.02 |
1.89 (<0.001) |
64.12 |
64.76 |
63.80 |
72.62 |
1.65 (<0.001) |
No interaction |
|
|
Uniformity |
3.60 |
3.00 |
2.60 |
2.38 |
0.76 (0.031) |
NS |
NS |
NS |
NS |
NS |
No interaction |
|
|
Stain |
14.90 |
6.29 |
3.27 |
3.46 |
6.81 (0.018) |
4.83 |
8.04 |
9.56 |
5.48 |
2.35 (<0.001) |
No interaction |
|
|
Shriveling |
14.44 |
9.67 |
4.04 |
4.17 |
9.01 (0.082) |
9.00 |
11.08 |
9.83 |
2.40 |
3.17 (<0.001) |
Interaction |
|
|
Asco (On seed) |
11.74 |
3.67 |
2.71 |
2.21 |
3.02 (<0.001) |
5.25 |
5.88 |
5.88 |
3.33 |
2.27 (0.09) |
Interaction |
|
|
Pod Wall |
NS |
NS |
NS |
NS |
NS |
0.167 |
0.75 |
0.993 |
0.59 |
0.51 (0.017) |
No interaction |
|
|
Table 7: Crop Top x Fungicide x Variety – South East |
CT Timing Early |
CT timing Mid |
CT Timing Late |
Ct timing Nil |
LSD (P) |
AF08014 mean |
Fiesta Mean |
Rana Mean |
LSD (P) |
Comment |
|
|---|---|---|---|---|---|---|---|---|---|---|---|
|
Blemish total |
NS |
NS |
NS |
NS |
NS |
4.08 |
13.62 |
1.75 |
2.64 (<0.001) |
No Interaction |
|
|
Colour tone |
NS |
NS |
NS |
NS |
NS |
56.49 |
55.04 |
54.28 |
0.48 (<0.001) |
No interaction |
|
|
100grain wt |
72.54 |
73.37 |
74.23 |
74.71 |
1.28 (0.024) |
66.62 |
69.48 |
85.04 |
1.15 (<0.001) |
No interaction |
|
|
Uniformity |
2.39 |
2.72 |
2.78 |
2.28 |
0.29 (0.014) |
2.17 |
3.46 |
2.00 |
0.40 (<0.001) |
No interaction |
|
|
Stain |
NS |
NS |
NS |
NS |
NS |
1.29 |
1.92 |
0.62 |
0.84 (0.014) |
No interaction |
|
|
Shriveling |
2.39 |
3.72 |
2.44 |
0.72 |
2.08 (0.064) |
1.50 |
5.33 |
0.13 |
1.62 (<0.001) |
No Interaction |
|
|
Pod Wall |
NS |
NS |
NS |
NS |
NS |
1.31 |
6.17 |
1.00 |
1.16 (<0.001) |
No interaction |
|
|
Table 8: Crop Top x Fungicide x Variety – Mid North |
CT Timing Early |
CT timing Mid |
CT Timing Late |
Ct timing Nil |
LSD (P) |
Fiesta Mean |
Rana Mean |
LSD (P) |
Comment |
|
|---|---|---|---|---|---|---|---|---|---|---|
|
Blemish total |
NS |
NS |
NS |
NS |
NS |
19.08 |
6.04 |
3.73 (<0.001) |
No Interaction |
|
|
Colour tone |
NS |
NS |
NS |
NS |
NS |
52.94 |
54.56 |
0.48 (<0.001) |
Interaction |
|
|
100grain wt |
71.09 |
75.24 |
76.5 |
75.51 |
2.66 (0.01) |
71.85 |
77.32 |
1.87 (<0.001) |
No interaction |
|
|
Uniformity |
5.0 |
3.67 |
4.0 |
3.92 |
0.73 (0.017) |
4.708 |
3.583 |
0.38 (<0.001) |
No interaction |
|
|
Stain |
NS |
NS |
NS |
NS |
NS |
7.23 |
5.17 |
1.86 (0.032) |
Interaction |
|
|
Shriveling |
NS |
NS |
NS |
NS |
NS |
6.85 |
2.63 |
1.54 (<0.001) |
No Interaction |
|
|
Pod Wall |
NS |
NS |
NS |
NS |
NS |
3.58 |
2.21 |
0.72 (0.001) |
No interaction |
|
|
Asco (seed) |
NS |
NS |
NS |
NS |
NS |
NS |
NS |
NS |
||
Notes relevant to analysis: Ascochyta not included in analysis as no seed staining from ascochyta was observed in the South East trial
Was this page helpful?
YOUR FEEDBACK