Grain Marketing- wheat, canola and barley outlook
Author: Malcolm Bartholomaeus | Date: 09 Oct 2014
Malcolm Bartholomaeus,
AvantAgri Australia
Take home messages
- There are a number of year in year out grain marketing strategies that will work most of the time:
- Target the January – April sweet spot for old season wheat sales and new season forward sales, and avoid selling mid year.
- Sell malt barley off the header, but look for pre-harvest and post harvest opportunities for feed barley.
- Look to forward sell canola in the June to August period, after your crop is in the ground, and then off the header and during the early post harvest shipping period.
- This harvest:
- There remains a lot of uncertainty about how this season will finish for us; yield and quality wise.
- There are price risks as we go into our harvest this year, with a record global crop projected, but also large volumes of feed grade wheat and tightness in milling wheat supplies, and current Australian prices are at a strong premium to CBOT futures. Will that hold?
- There should be good risk premiums in global prices in early 2015 that should suit both old and new season sales.
- Long term:
- The world can grow enough grain to feed itself, but grain production has to be profitable.
- We have gone through a period of high wheat, corn and soybean prices, driven by shortages. Those high prices have triggered a lift in output to record levels.
- On average, grain growing will be profitable, but there will be periods of low prices.
Marketing strategies
There are a few marketing strategies that can be used in a general year in year out approach to grain marketing. The trick is to look for when to deviate from that plan. If there are no triggers to change, then stick to the plan.
Wheat
The sweet spot for wheat tends to be in the January to April period most years. This becomes a good time to sell both old season wheat, and begin the forward sales program for new season.
If we look in a little more detail, we can see that:
- There are some grades that trade at stronger levels during harvest. An example is higher protein wheats. The theory is that the trade (exporters and domestic endusers) will accumulate it while it is available, pushing up the premium at that time. Later in the year the risk is that all wheat begins to trade at the same price level.
- Lower grades like ASW and AGP tend to be more heavily discounted at harvest, with the grade spread closing up post harvest, making these wheats lower risk to hold for post harvest marketing.
- Avoid holding old season wheat for sale mid year. It is rare for the market to consistently rally enough to cover the costs of holding (interest and storage costs).
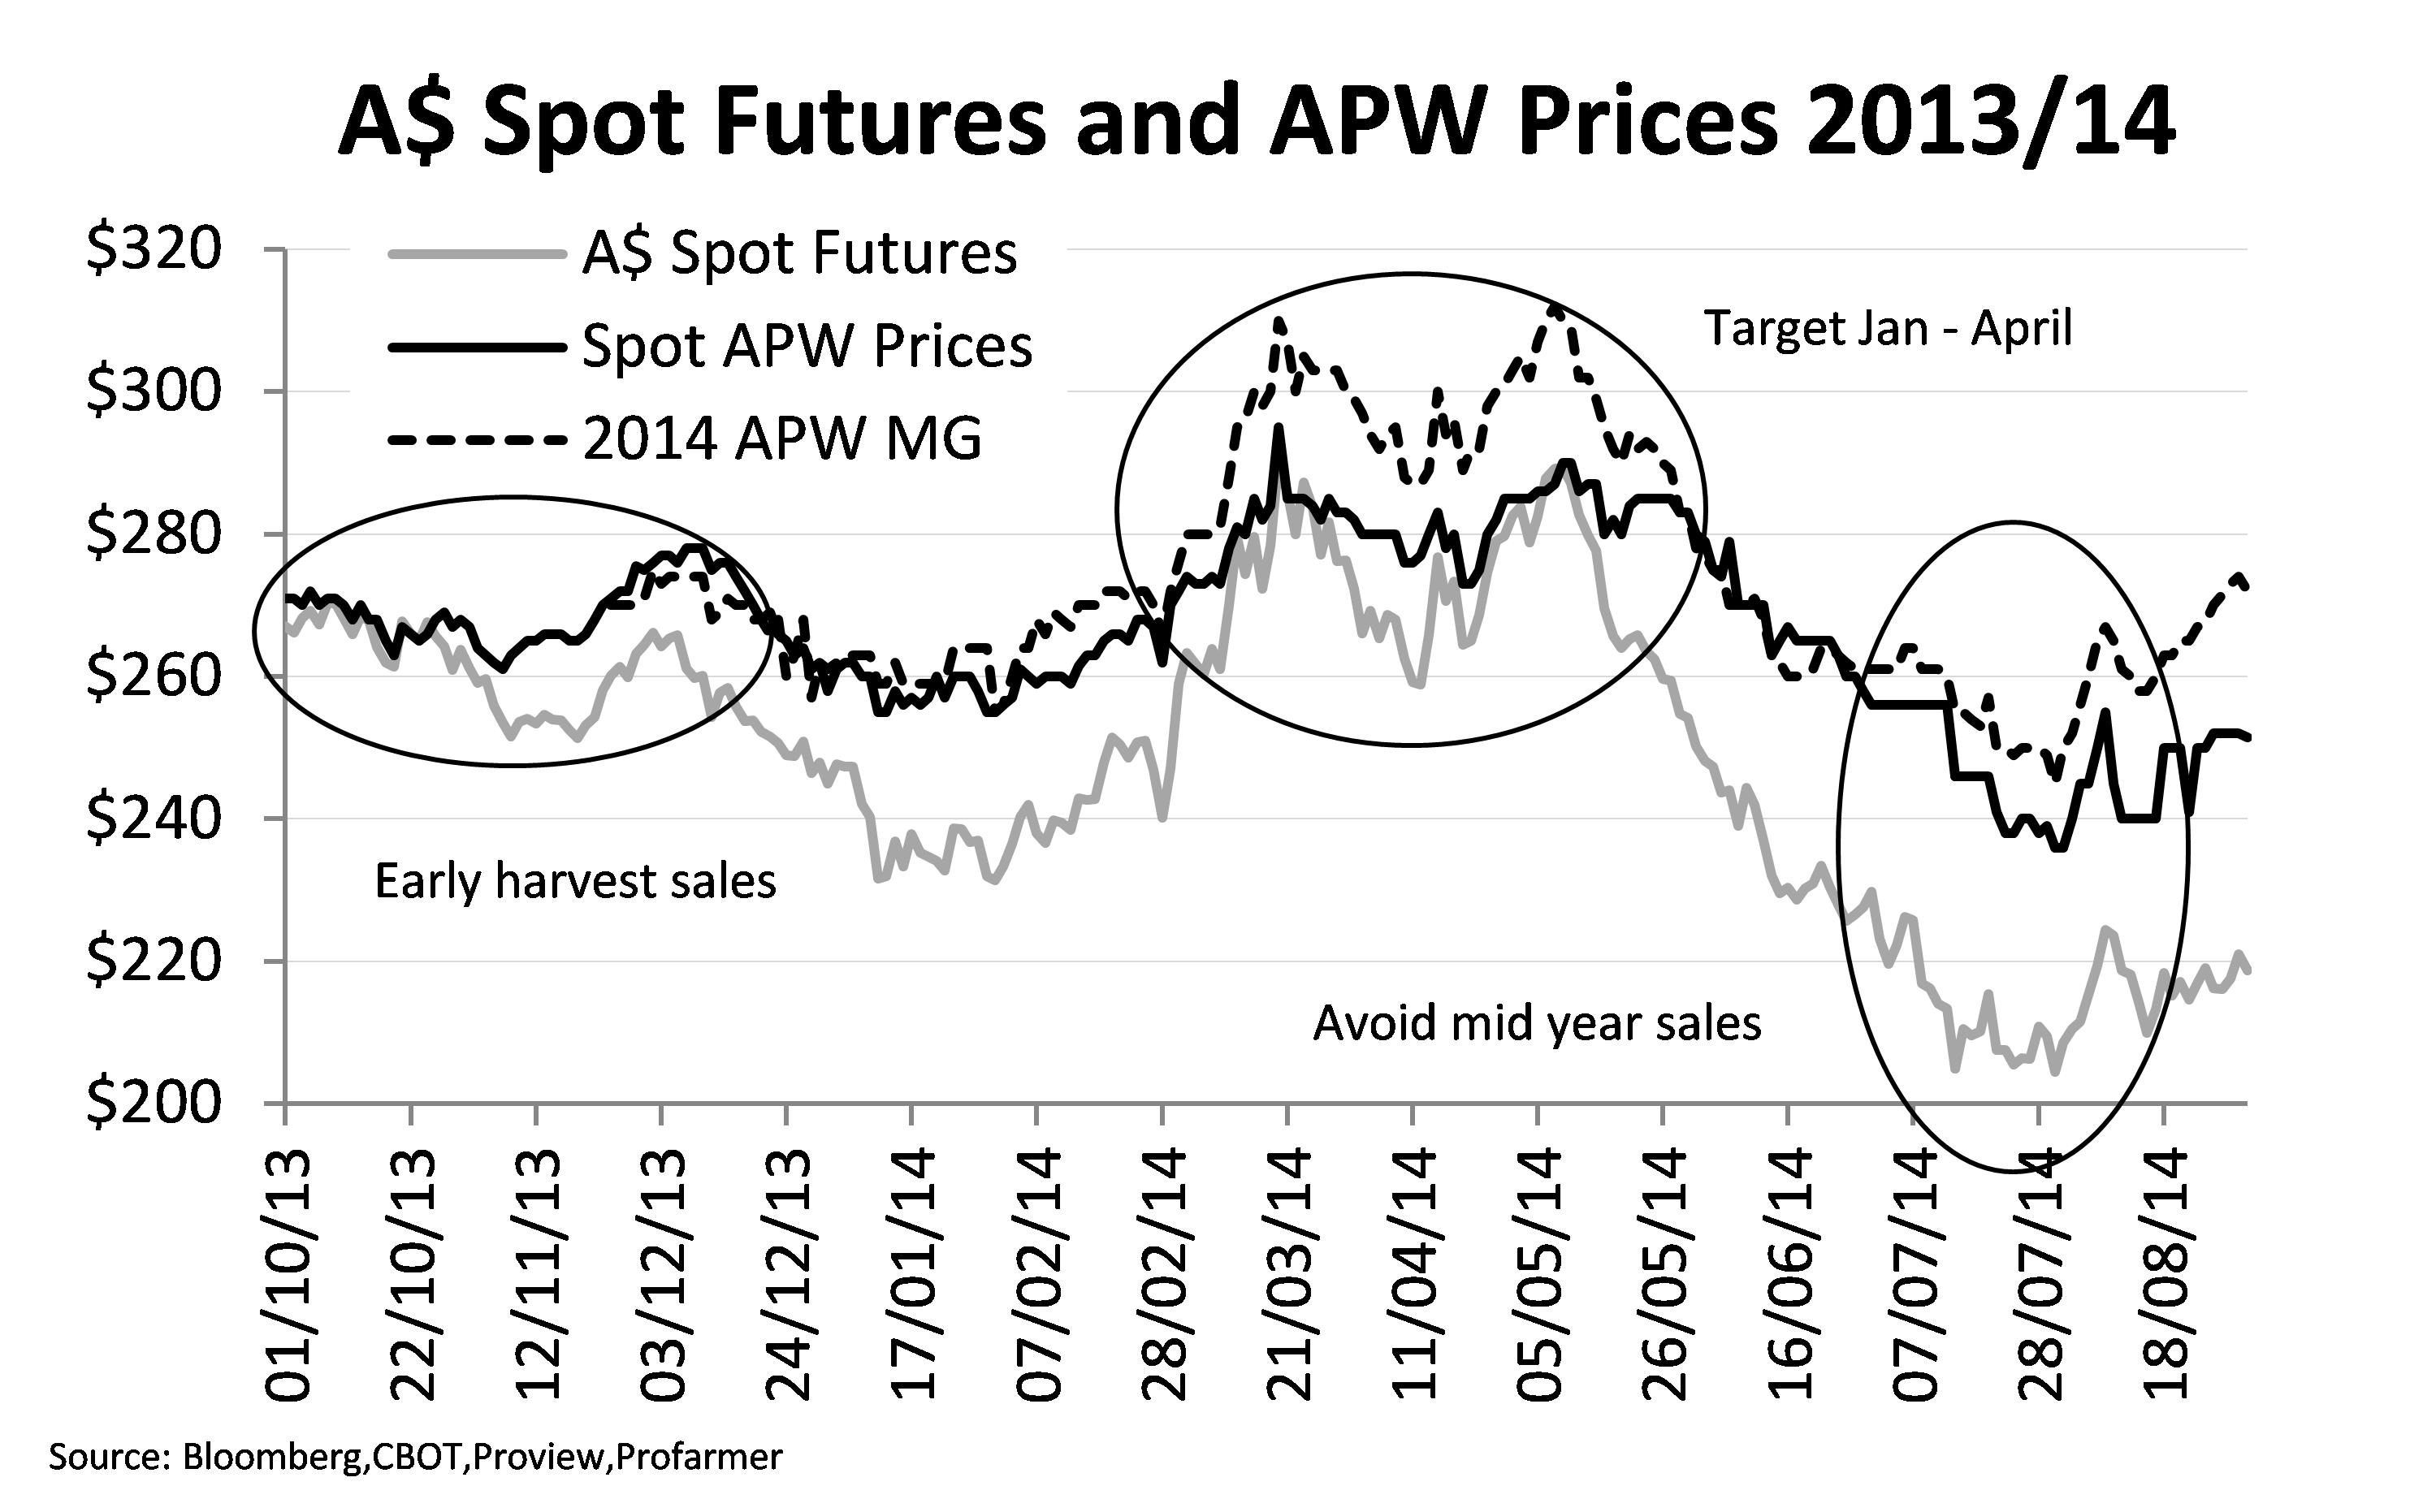
Figure 1. A$ spot futures and APW prices 2013/14.
The strategy of targeting early post harvest for wheat sales (both old and new season) has performed well in four of the last six seasons. The exceptions are 2010 and 2012, when dry seasons in Russia eventually drove the market sharply higher in the June – August period. Those gains might have been foregone for the old season crop, but were there to capture on the new season crop.
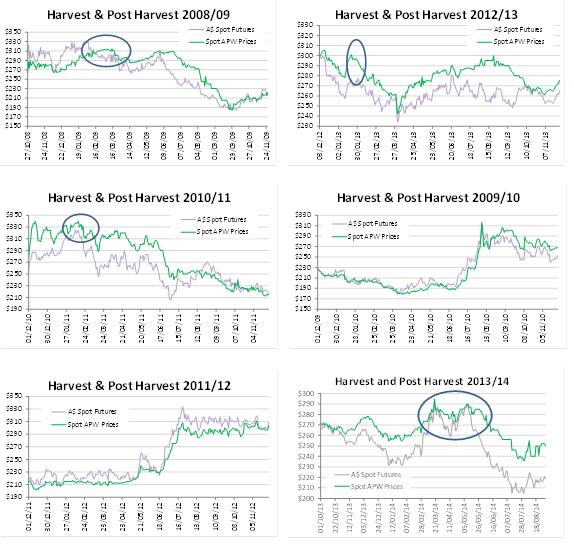
Figure 2(a-f). Harvest and post harvest prices from 2008/09 to 2013/14.
Holding wheat for sale mid year, or after the end of June, is high risk, and that includes holding on farm. There is the risk of the global market driving wheat prices lower as the year unfolds, plus the costs of holding wheat for later sale.
Most years the results from storing grain on farm are set by moves in the underlying wheat market, and are secured by those who warehouse and/or those who store on farm. Where on farm storage gets ahead is if there are cost savings in freight, and savings in the cost of owning and operating on farm storage versus the costs of renting storage from the BHC’s. There should also be small gains from selling to end users and traders who have to compete with the cost of grain being turned out from a BHC facility.
Table 1. On farm response to change in price base.
|
Selling Mid Year - $20/t Drop in Price Base |
|||
|---|---|---|---|
|
|
BHC Harvest |
BHC Mid Year |
Ex farm |
|
Del Cash Price |
$240.00 |
$220.00 |
$240.00 |
|
Frt to BHC |
$12.00 |
$12.00 |
|
|
Frt to Farm Silo |
$4.00 |
||
|
Interest |
$6.60 |
$6.60 |
|
|
BHC Storage |
$7.50 |
||
|
On Farm Storage |
$12.00 |
||
|
Frt to end user |
$12.00 |
||
|
Net Farm |
$228.00 |
$193.90 |
$205.40 |
|
Selling Mid Year - $40/t lift in Price base |
|||
|
|
BHC Harvest |
BHC Mid Year |
ExFarm |
|
Del Cash Price |
$240.00 |
$280.00 |
$300.00 |
|
Frt to BHC |
$12.00 |
$12.00 |
|
|
Frt to Farm Silo |
$4.00 |
||
|
Interest |
$6.60 |
$6.60 |
|
|
BHC Storage |
$7.50 |
||
|
On Farm Storage |
$12.00 |
||
|
Frt to end user |
$12.00 |
||
|
Net Farm |
$228.00 |
$253.90 |
$265.40 |
NOTE: The economics of on farm storage vary from individual to individual. The important points are to fully allow for the cost of owning and operating on farm storage, and to extract as much premium from selling outside the system as possible.
Barley
Although there is a strong correlation between barley and wheat prices, which tends to mean if year on year there is a move in wheat, there will be a similar move in barley prices.
In terms of marketing, we often see good pricing opportunities for feed barley leading into harvest, and then again after harvest.
It is rare for the best pricing to be achieved during the November to December harvest period. In every year from 2017 to 2103, the forward market in the July to October period, has offered better pricing than off the header in export markets, and this tends to be mirrored in domestic markets as well.
Post harvest, most years’ prices do move above harvest levels in either the January to March period, or later, in the April to June period. This is more so in domestic, once the exportable surplus has been shipped out of Victoria and southern NSW. This is where holding feed barley on farm for the domestic market can deliver good returns.
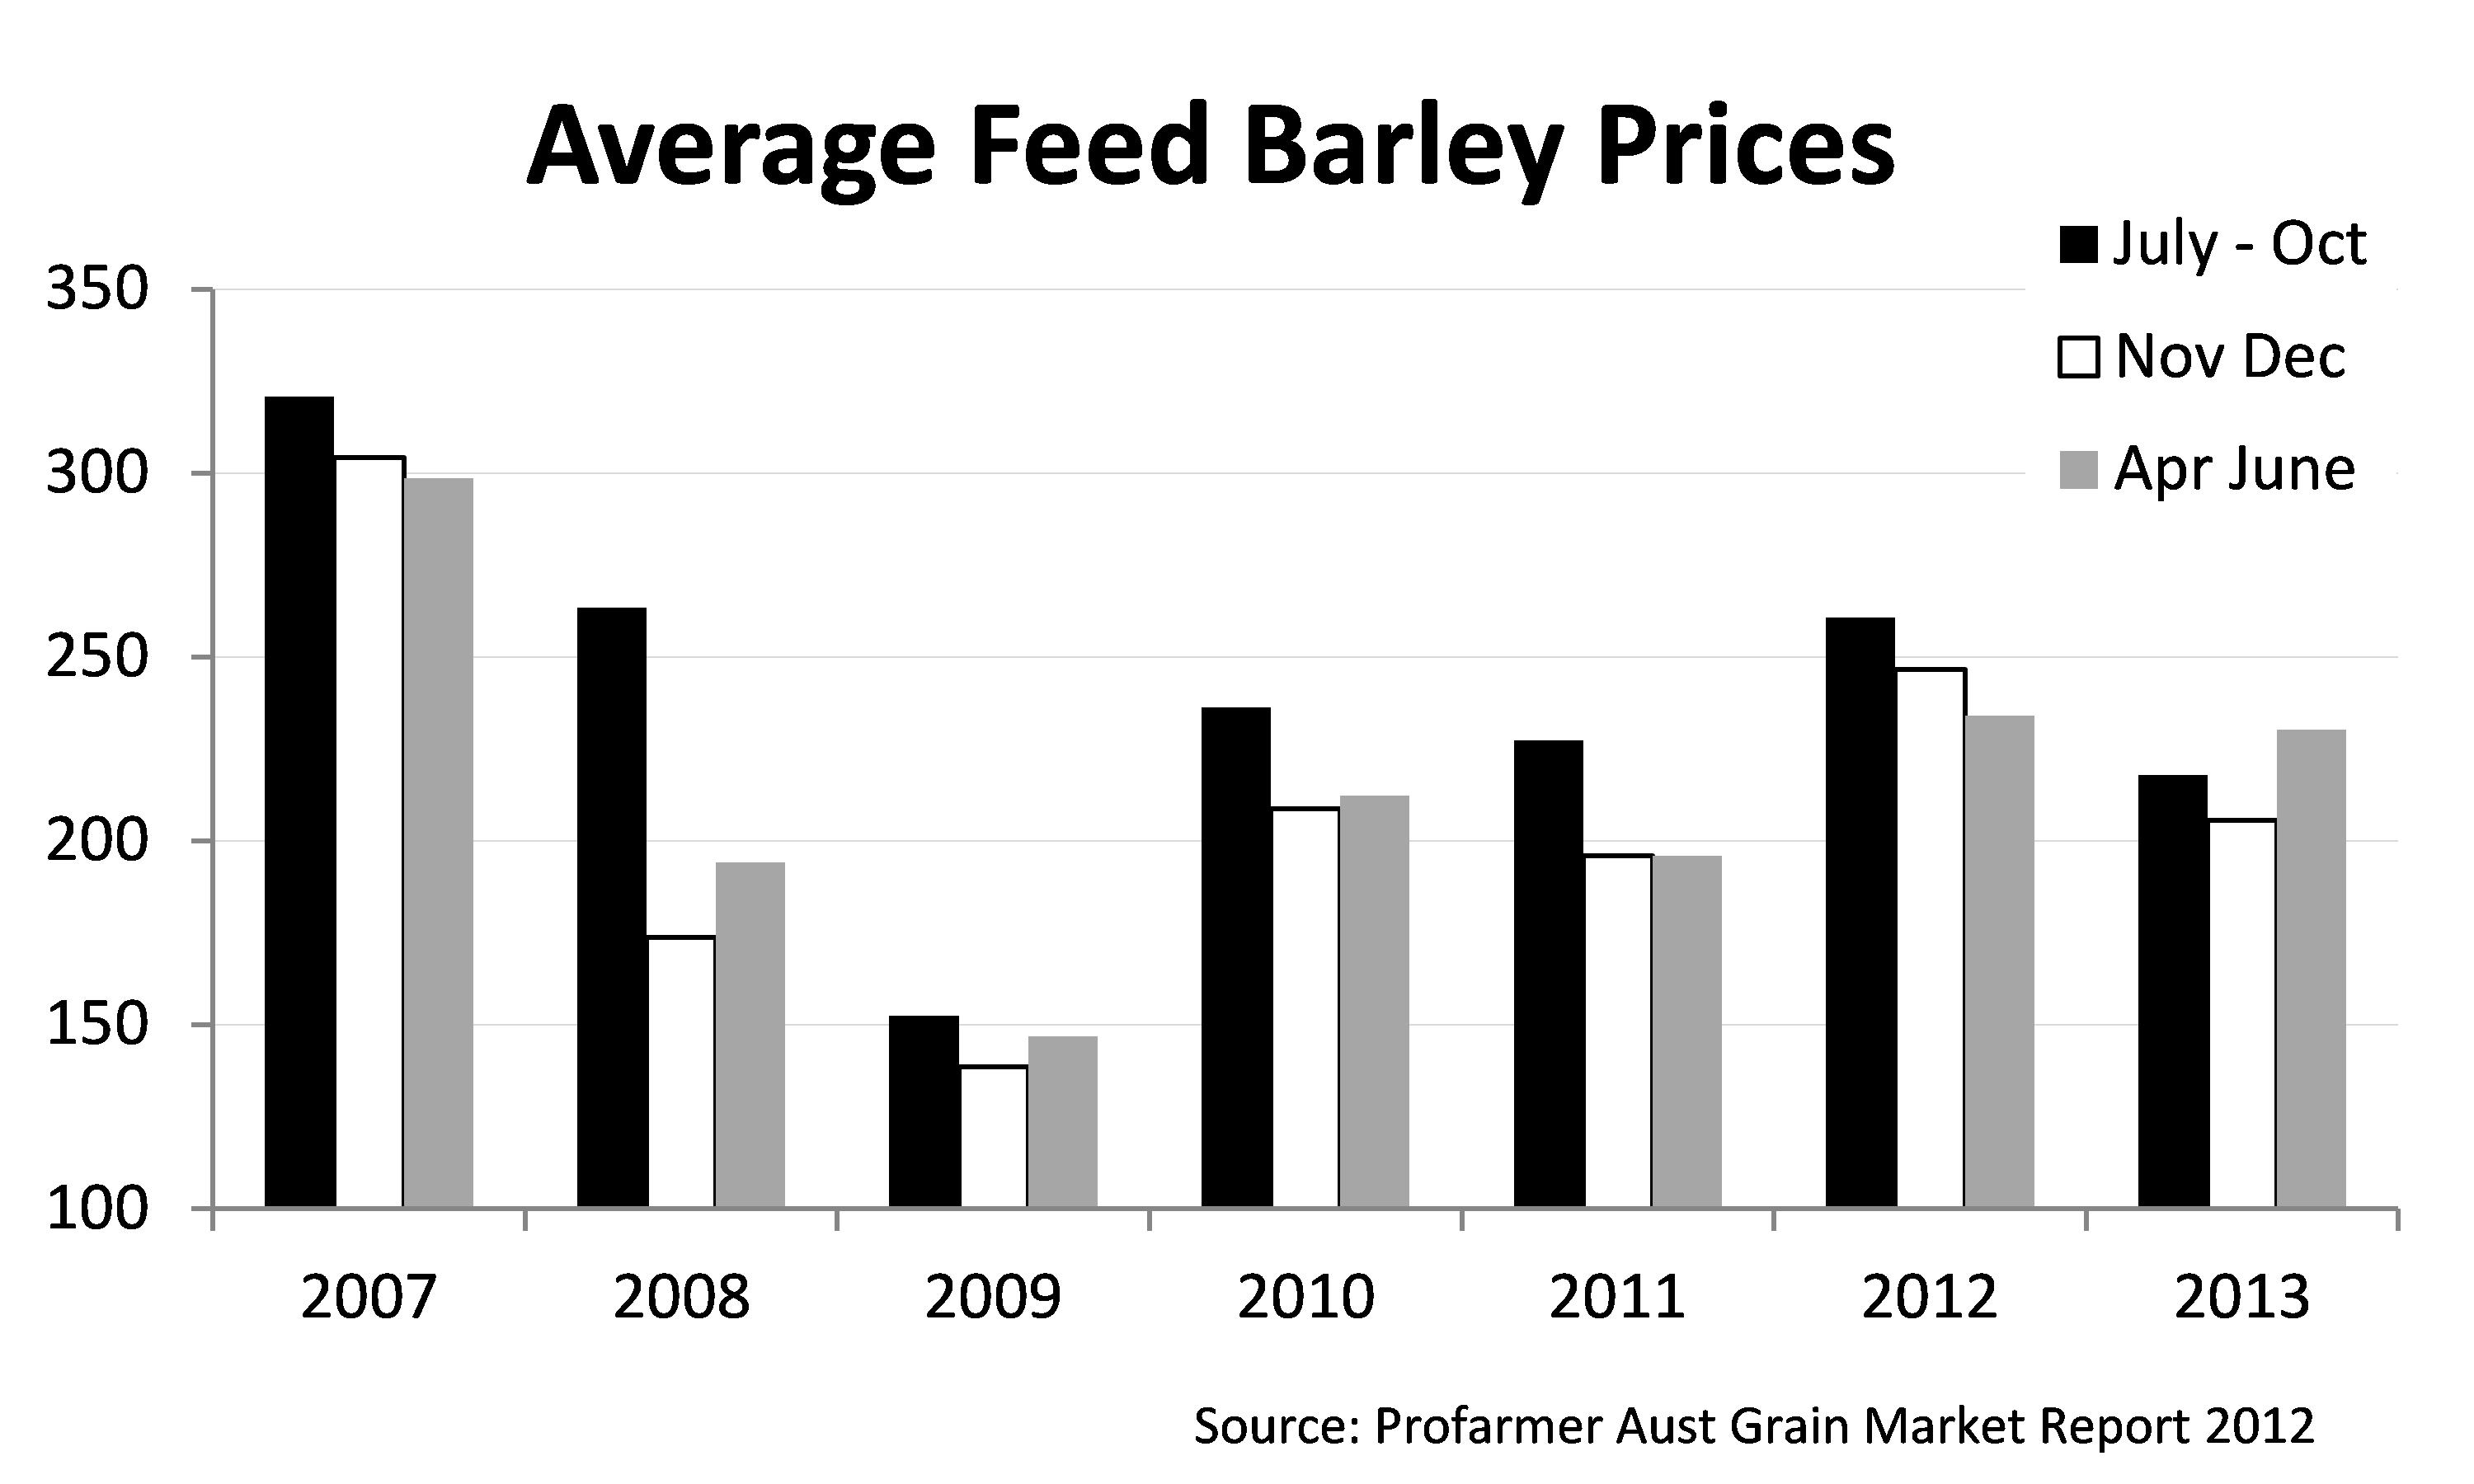
Figure 3. 2007 to 2013 average feed barley prices.
Malt barley is best sold in either the forward market, or off the header. Forward selling is difficult because of the quality problem. However, there are normally multigrade contracts that can allow pricing of the feed barley leg, with a premium for malting barley.
The malting premium tends to be strongest at harvest, when maltsters and exporters compete for the available supplies. It is rare for prices post harvest, to match harvest price levels, with malting barley eventually falling to feed barley prices.
Because of the falling premium for malt grade post harvest, it is very hard to increase returns enough to cover interest and storage costs to add value to malt barley from storing either on farm, or in warehousing.
Canola
The pattern for canola prices tends to be:
- Strong prices with risk premiums in international oilseed prices from June to August. This is the equivalent to Jan to April for wheat, and coincides with planting canola and soybeans in the US and Canada, and the high risk growing season period.
- Once harvest starts in September, prices tend to come under pressure. That pressure abates when the North American harvest is over, just in time for our harvest.
- During harvest and early post harvest, Australian exporters are accumulating tonnage for their shipping program, which tends to be executed in the first few months of the new year. After that exporter interest drifts off, and we hit the South American soybean harvest.
Against this price pattern, we can work on:
- Forward sales in the June to August period.
- Harvest sales off the header.
- Post harvest sales in January to March.
Because of its value and the nature of the product, it is a high cost to hold canola and it’s not well suited to on farm storage. Completing sales early post harvest is a good strategy year in year out. The main decisions are how much to forward sell in June to August (a function of seasonal risk and price), and what percentage to sell off the header versus holding for early post harvest sale.
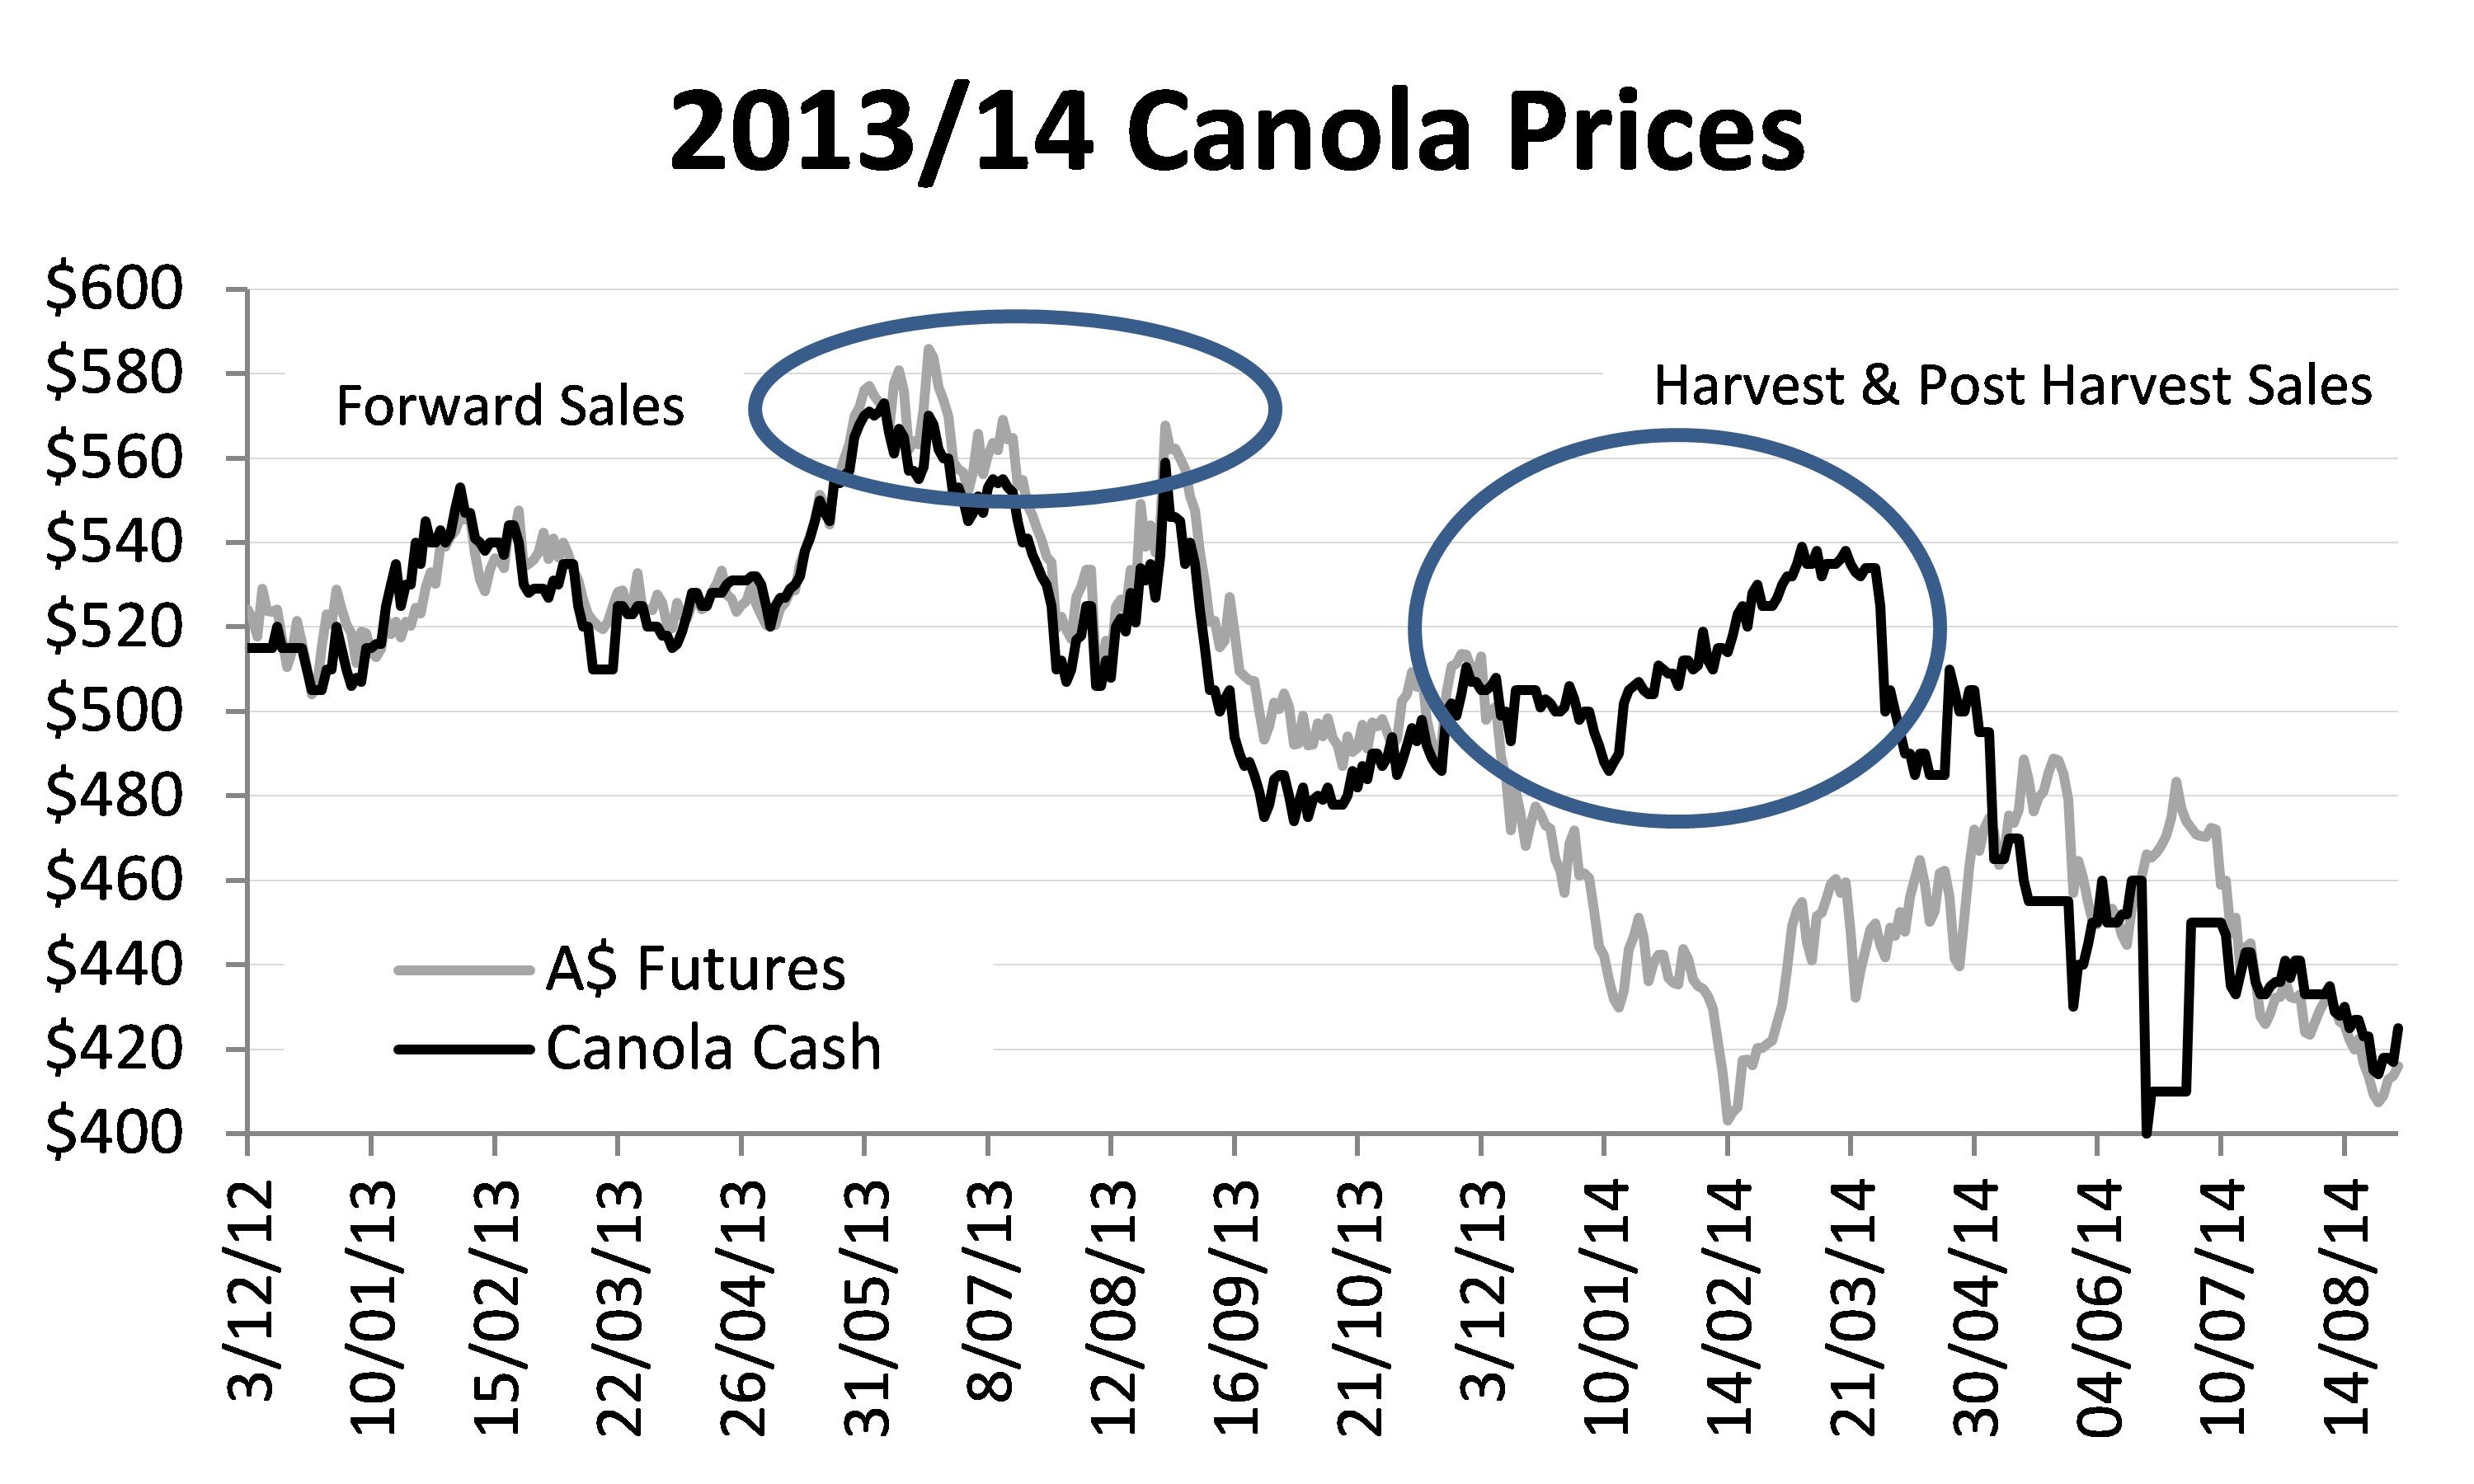
Figure 4. 2013/14 canola prices
The 2014/15 market
Wheat
The January 2014 USDA Report set the tone for wheat prices for the 2014/15 season. The report confirmed a large crop from the 2013/14 season, growing global wheat stocks, and a major shift in consumption by livestock feeders from wheat back to corn and feed barley.
Prices were supported during March, April and May by the tensions in Ukraine, which also saw importers lift their purchases in case supplies from the Black Sea were cut off, and from the ongoing drought in the US.
By mid year it became apparent that exports were still flowing freely from Russia and Ukraine and that trading sanctions would not impact on grain exports. As well, the US harvest got underway and yields improved as the harvest moved north.
By the July USDA Report, it was apparent that the world was set for a new record level of production, with a large crop coming in from the EU and Russia. The small year on year increase in global stocks was lifted to a 9.3 mill t increase, and prices came under pressure again. Production and stock estimates continued to be increased in the August and September USDA Reports as well, keeping downward pressure on US wheat futures.
Table 2. Global wheat supply and demand.
| Global Wheat Supply and Demand (mill t) | |||||
|---|---|---|---|---|---|
| 2013/14 | 2014/15 |
2014/15 |
Annual Change |
||
| Sept Est |
Aug Est |
Sept Est |
Mill t | % |
|
| Opening Stocks |
175.60 |
183.66 |
186.45 |
10.85 |
6.18% |
| Production | 714.05 |
716.09 |
719.95 |
5.90 |
0.83% |
| Consumption | 703.20 |
706.79 |
710.01 |
6.81 |
0.97% |
| Closing Stocks |
186.45 |
192.96 |
196.38 |
9.93 |
5.33% |
| S/U ratio |
26.51% |
27.30% |
27.66% |
||
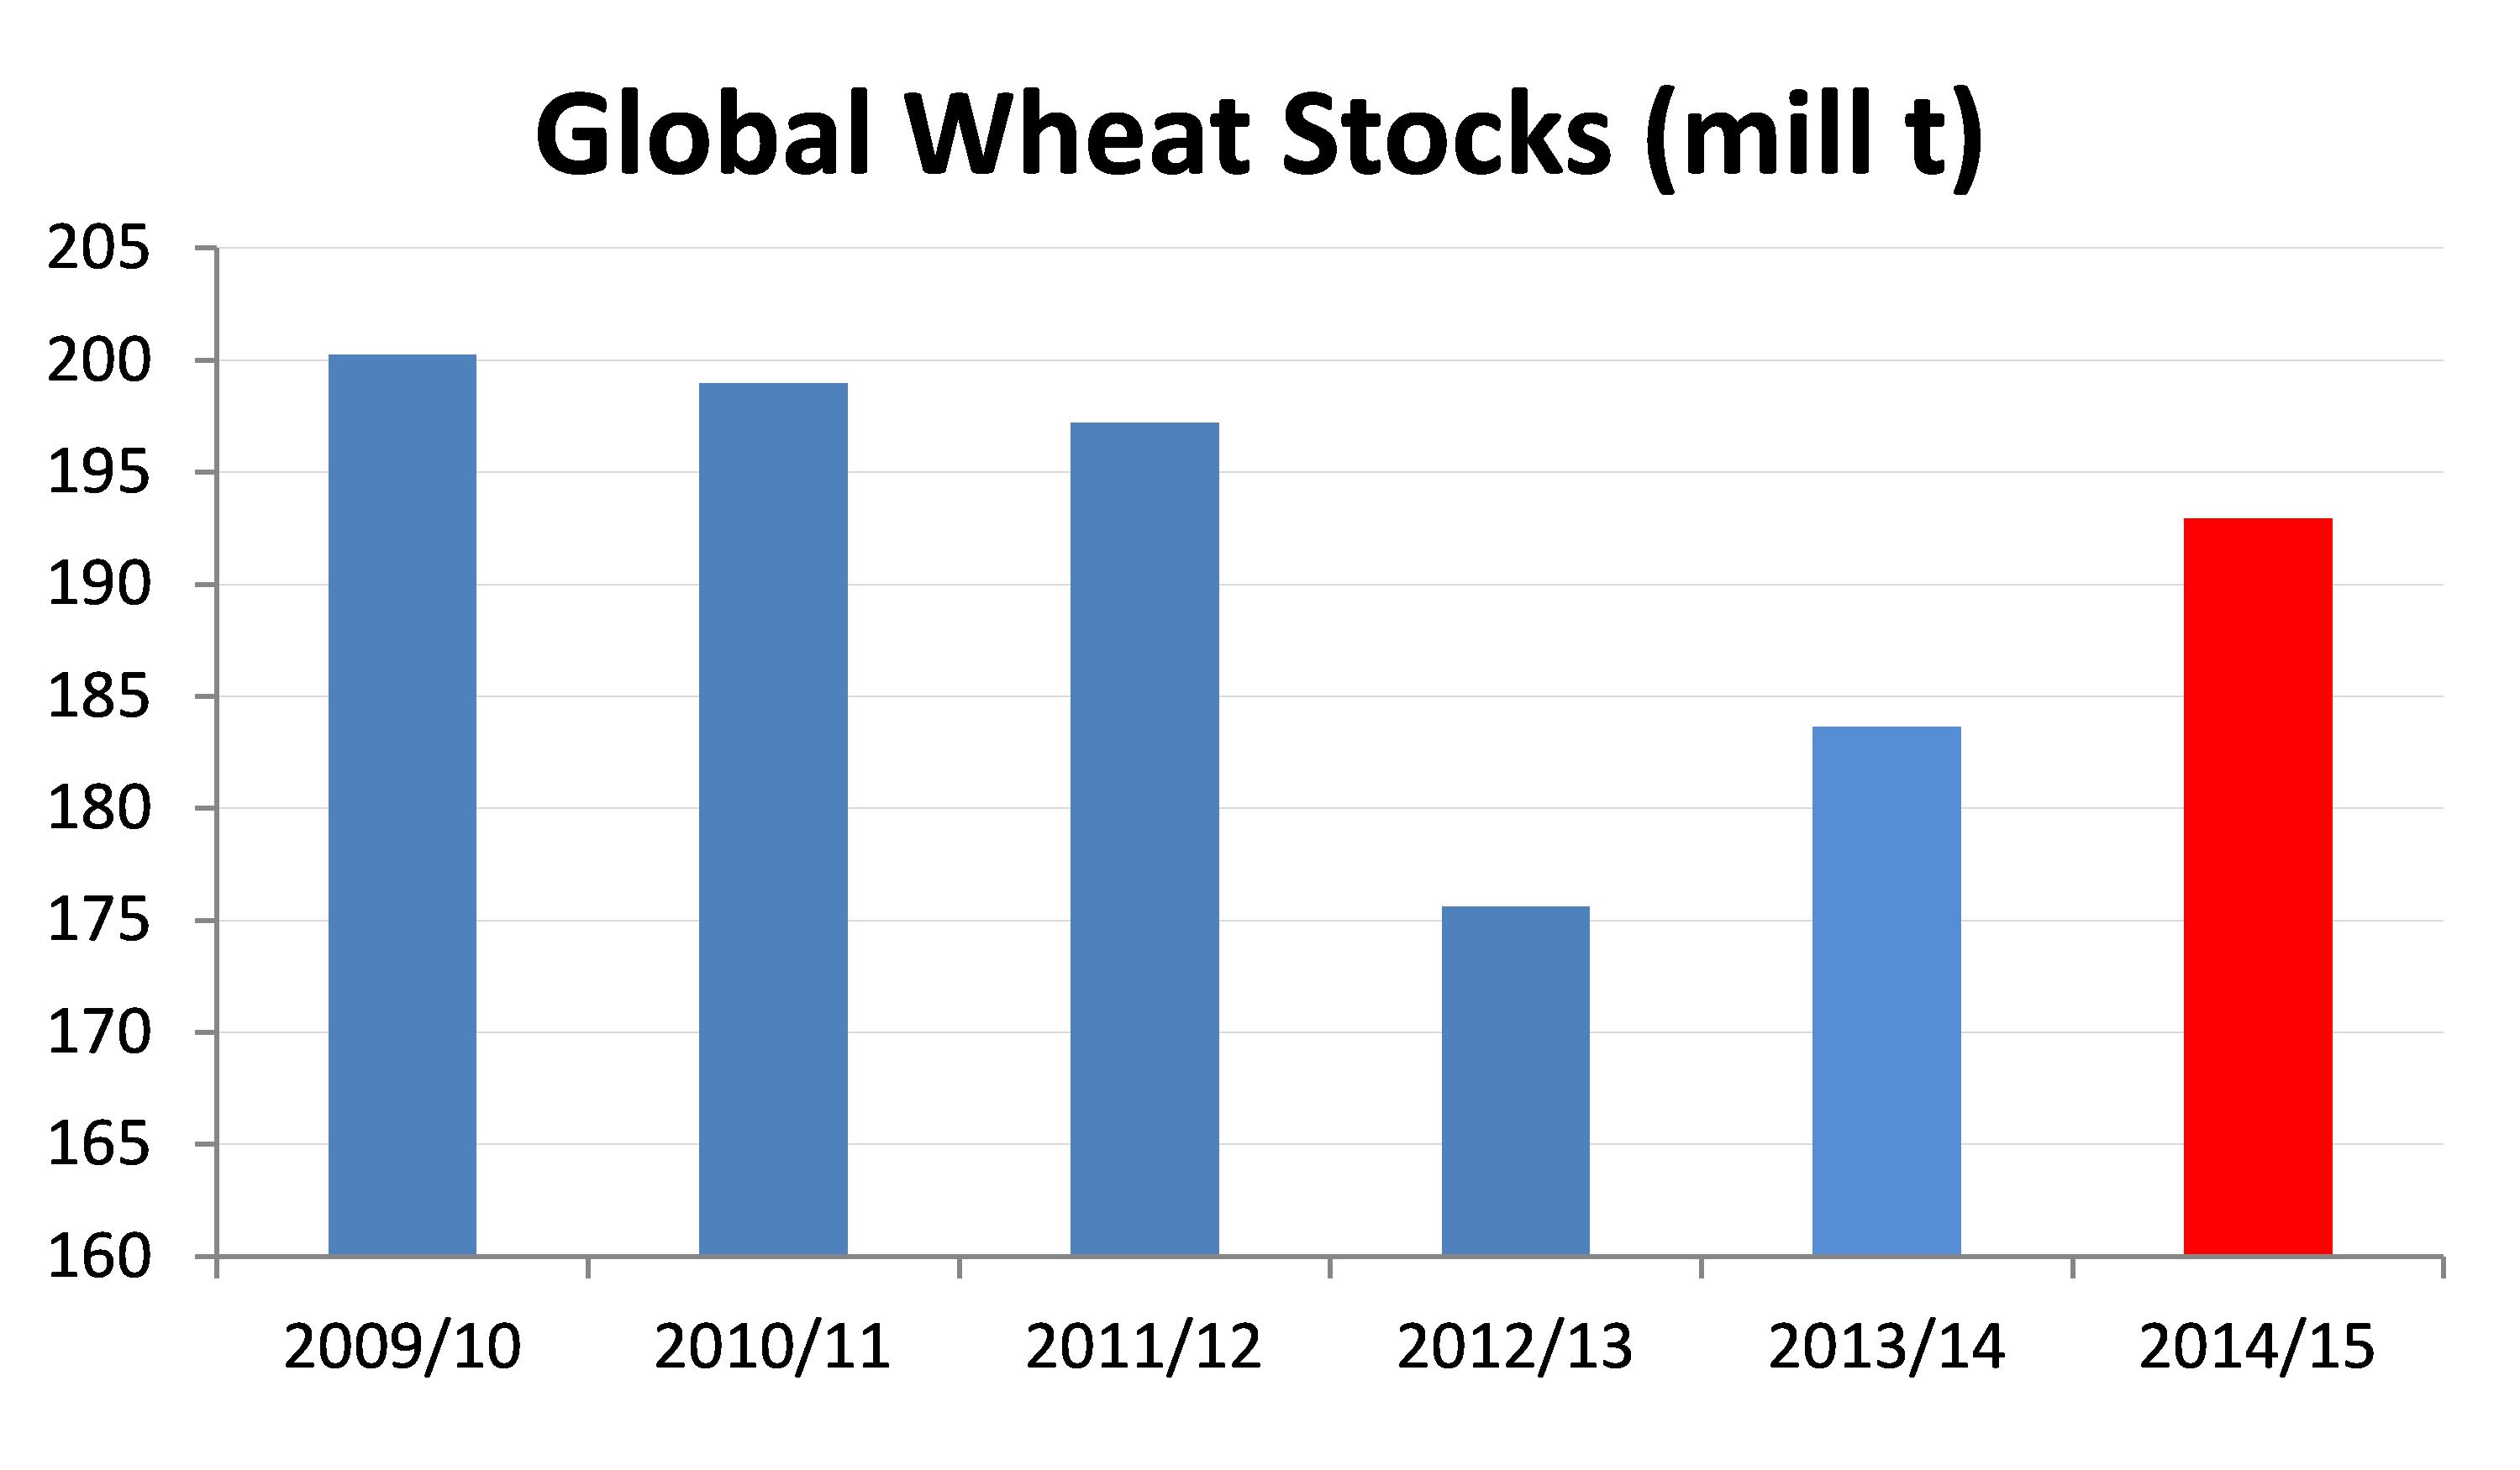
Figure 5. Global wheat stocks (mill t).
From here there remains a lot of uncertainty about where the prices will settle as our harvest commences:
- After an El Nino forecast all season, we have seen rainfall drop away during late winter and early spring in parts of Victoria and South Australia. Will we get enough October rain to hold yield potential across Australia?
- We have the uncertainty about tensions in the Black Sea and whether that will eventually disrupt the flow of grain to export markets. (The view is that it will impact more on the 2015/16 year rather than this year, because of input shortages to grow the 2015 crop).
- There has been a huge quality downgrade in the EU, the US and Canada as rain disrupts their spring wheat harvest.
- Australian wheat prices have held a very strong premium to US futures for some time. Will this hold into our harvest?
In early September, 2014/15 wheat prices were holding a small premium to harvest average prices from November and December 2013. By the end of September prices had slipped by $26 per tonne in NSW and Victoria, in line with US futures. At the end of September, Port Kembla APW prices were quoted at $262 per tonne, down $33 per tonne on the November/December 2013 harvest average
With a lift in global wheat supplies the expectation would be for a year on year fall in prices to be maintained. However, strong basis levels have protected Australian wheat growers from the full impact of the drop in US wheat futures. The weaker currency has also shielded us from the price declines being experienced by US farmers.
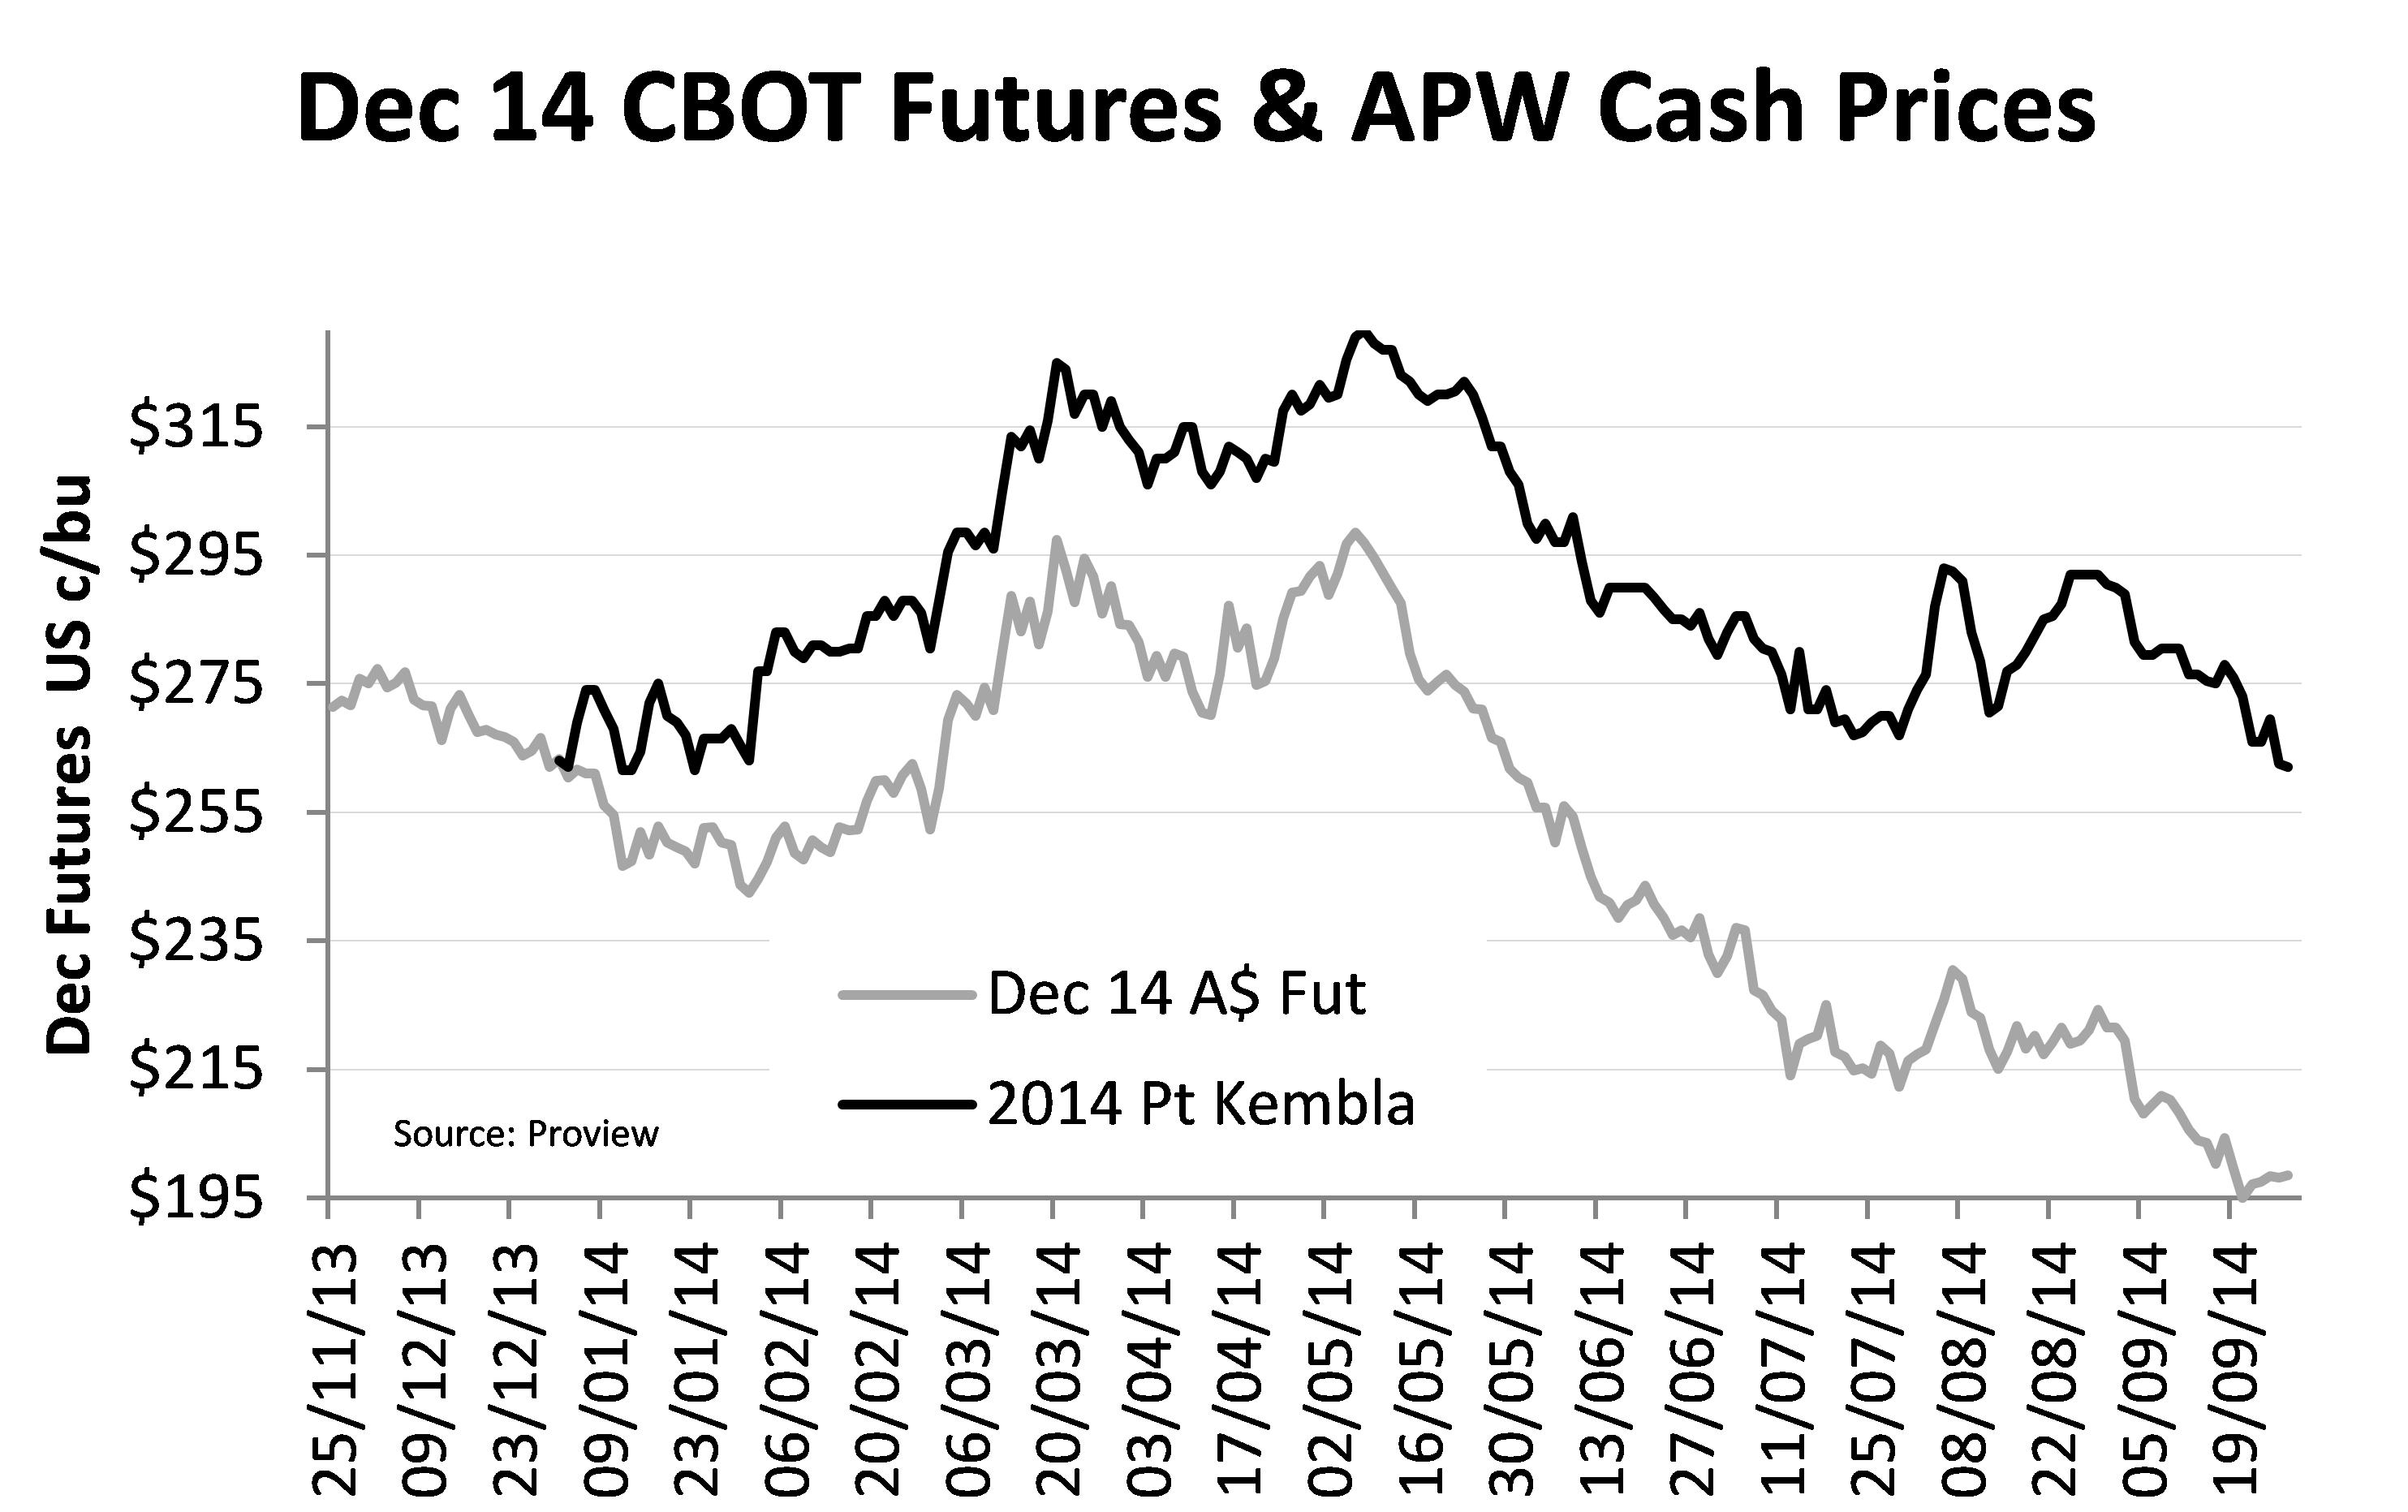
Figure 6. December 2014 CBOT futures and APW cash prices.
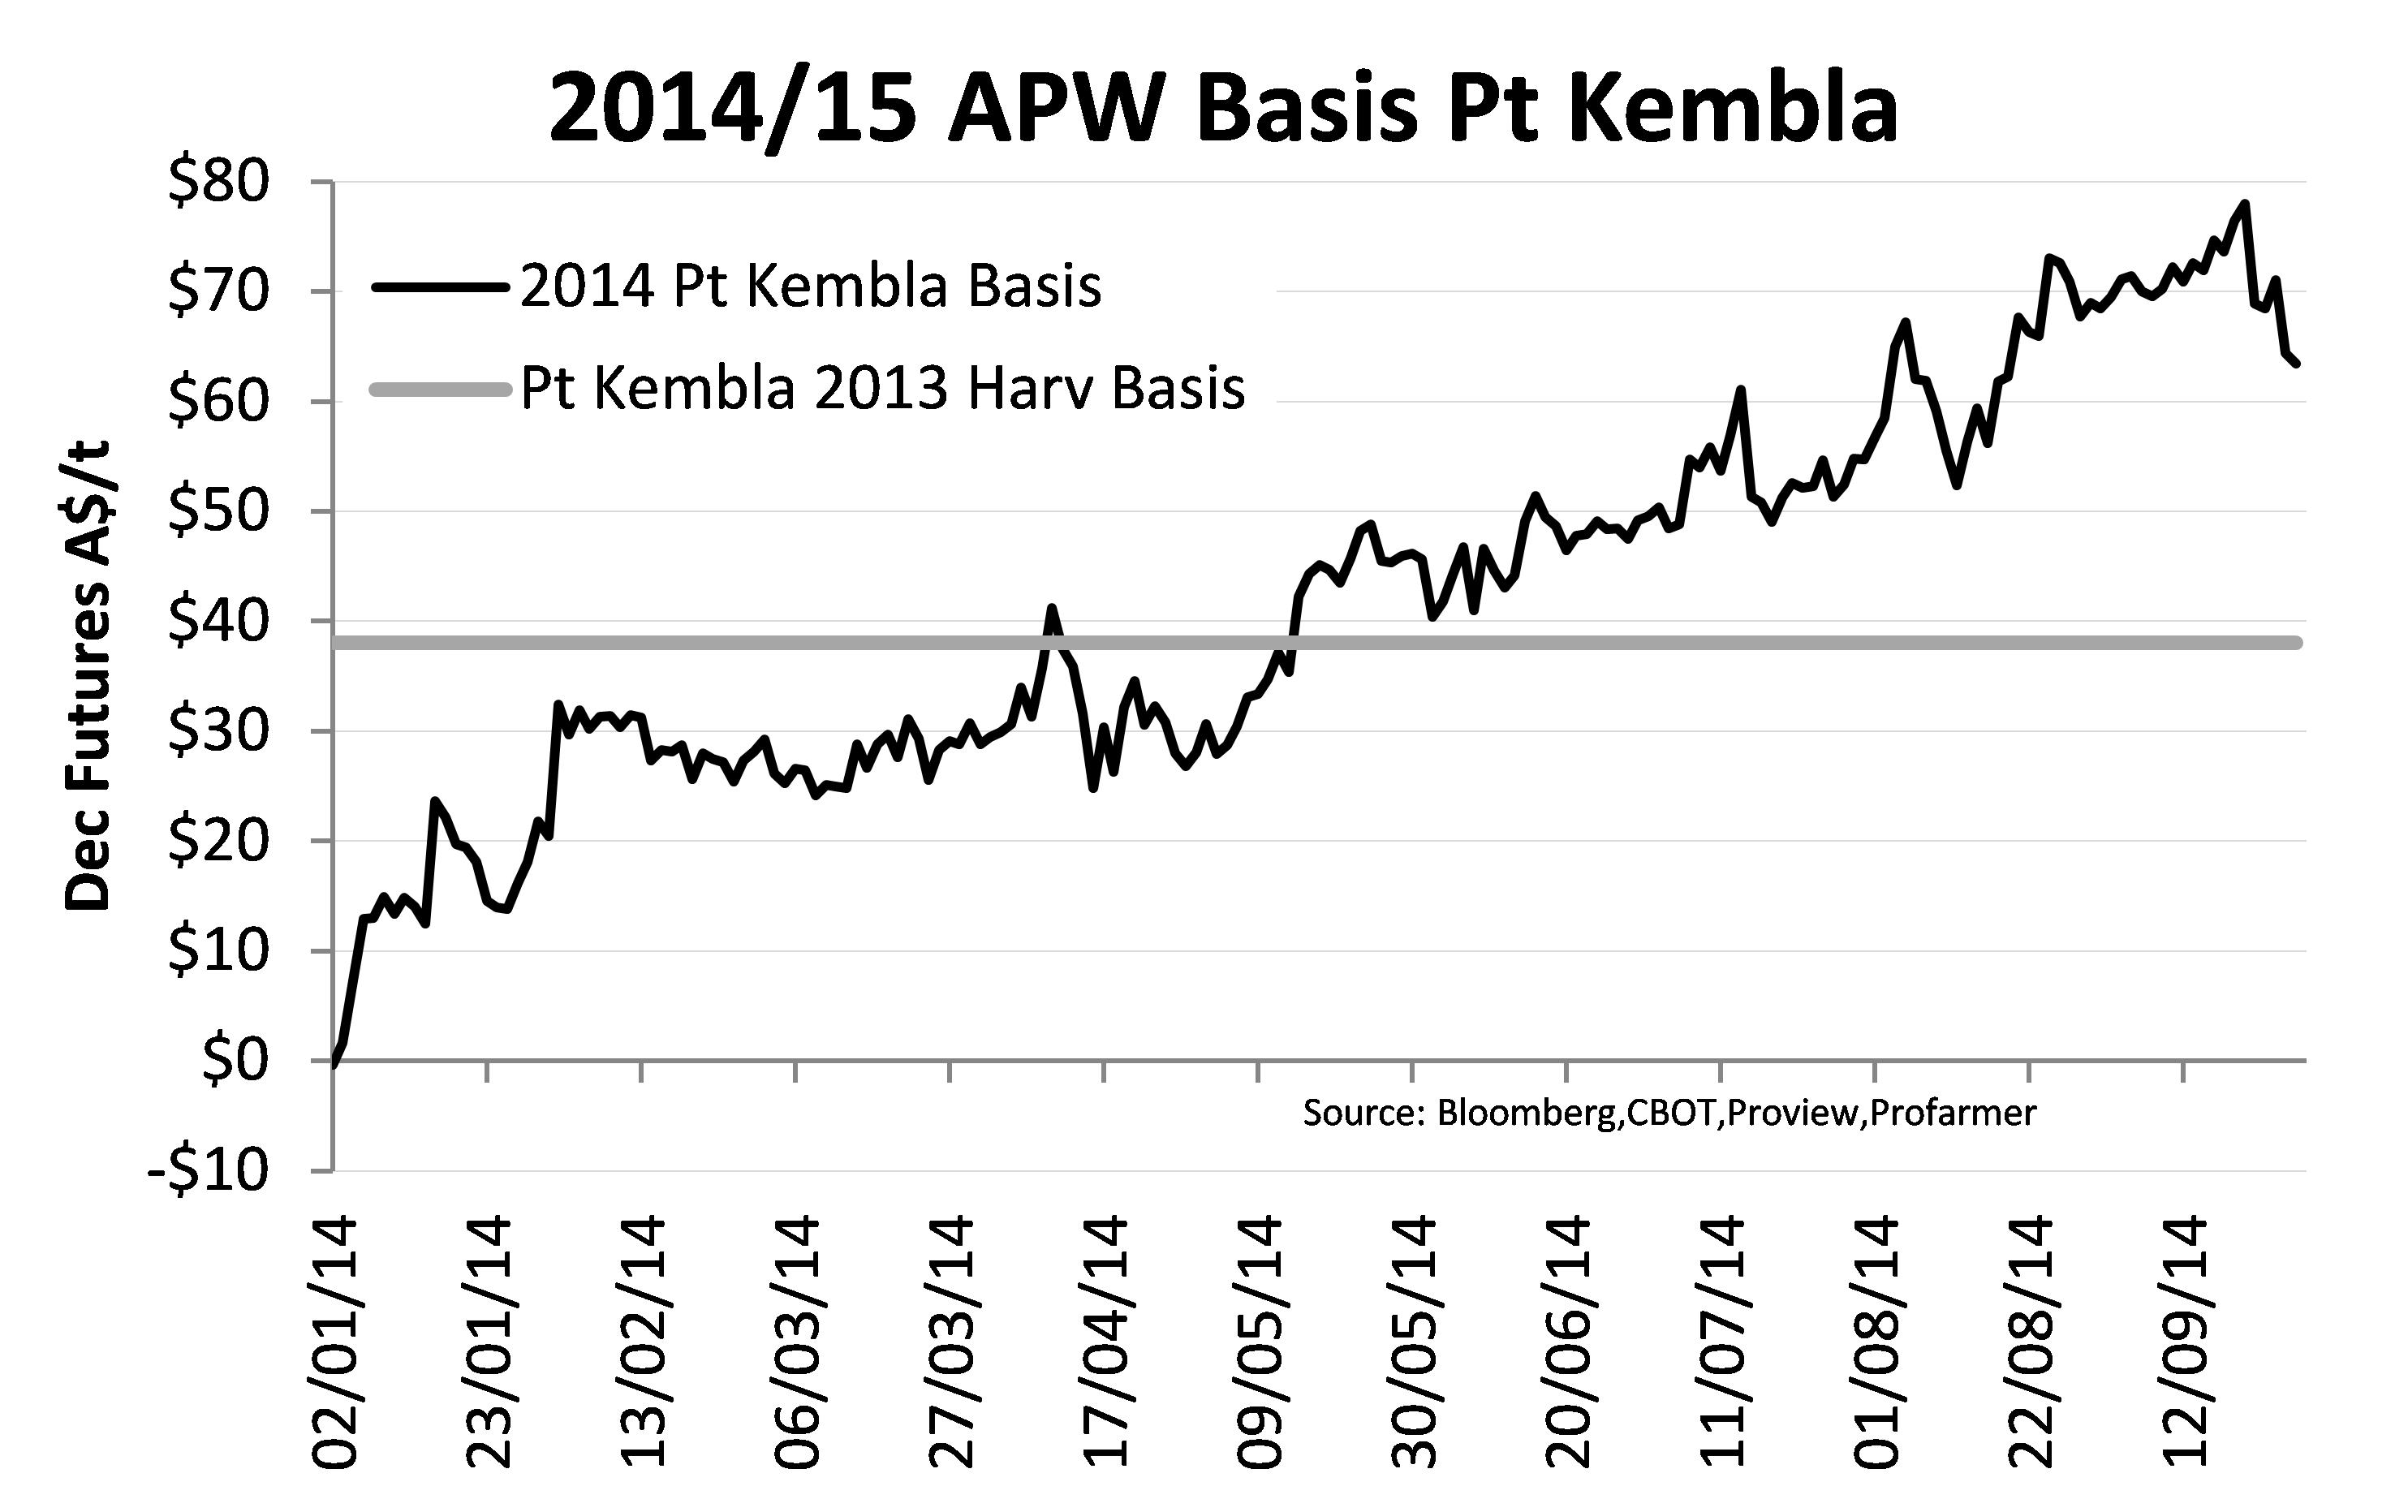
Figure 7. 2014/15 APW Basis Port Kembla.
As we move into harvest we would expect US futures to have stabilised. Even if the tensions in Ukraine ease, the A$65/t year on year drop in CBOT futures from harvest 2013 to 29 Sept 2014 looks to be big enough against the lift in world wheat supplies, given the large quality downgrades for milling types being seen I the US, Canada and the EU.
That leaves the Australian market exposed to a pull back in basis, even if basis levels remain stronger than normal.
Table 3. Port Kembla 2014 prices versus harvest 2013.
| Harv Av 2013 | 29-Sep | Change | % Change | ||
|---|---|---|---|---|---|
| Exchange rate | US c | 91.66 | 87.67 | -3.99 | -4.35% |
| CBOT Futures | US c/bu | 641.00 | 474.25 | -166.75 | -26.01% |
| CBOT Futures | A$/t | $256.78 | $198.53 | -$58.25 | -22.68% |
| APW Cash | A$/t | $295.45 | $262.00 | -$33.45 | -11.32% |
| Basis | A$/t | $38.67 | $63.47 | $25.80 |
When we move post harvest, we would expect concerns about the size of the 2015 global crop to surface. That should push US futures higher. Whether our prices also push higher post harvest may be determined as much by basis levels as by the underlying futures price levels.
To handle the upcoming harvest:
- Be ready for basis levels to fall away as we approach and begin our harvest and grower selling ramps up. This may mean that prices are lower than early September levels, and may mean that we get a brief selling opportunity early in the harvest period, as we get in most years.
- Be prepared to stand aside during harvest, particularly if basis levels fall. We could see considerable downside in the market under harvest pressure. However, look for opportunities, as a lack of grower selling may leave exporters bidding hard for stocks to meet shipping deadlines.
- Expect a rally in US futures post harvest, but that may not flow in full to our post harvest pricing. That will depend on how much basis also lifts in the spot harvest period. The stronger the basis levels are during harvest, the greater the chance that the spot harvest market may not rally as much as normal.
Barley
We would expect feed barley to move roughly in line with wheat prices (there has been a 91.5% correlation between APW and F1 prices for the 2014 season from April to the end of August). What also appears to be happening is that the spread between feed barley and wheat is narrower than normal. If that continues, it may favour selling feed barley over wheat in the early harvest period (ie October onwards). On average, export feed barley has traded around $65/t under APW wheat during the harvest period since 2007. 2014/15 prices are pitched around $30 per tonne under APW at the end of September.
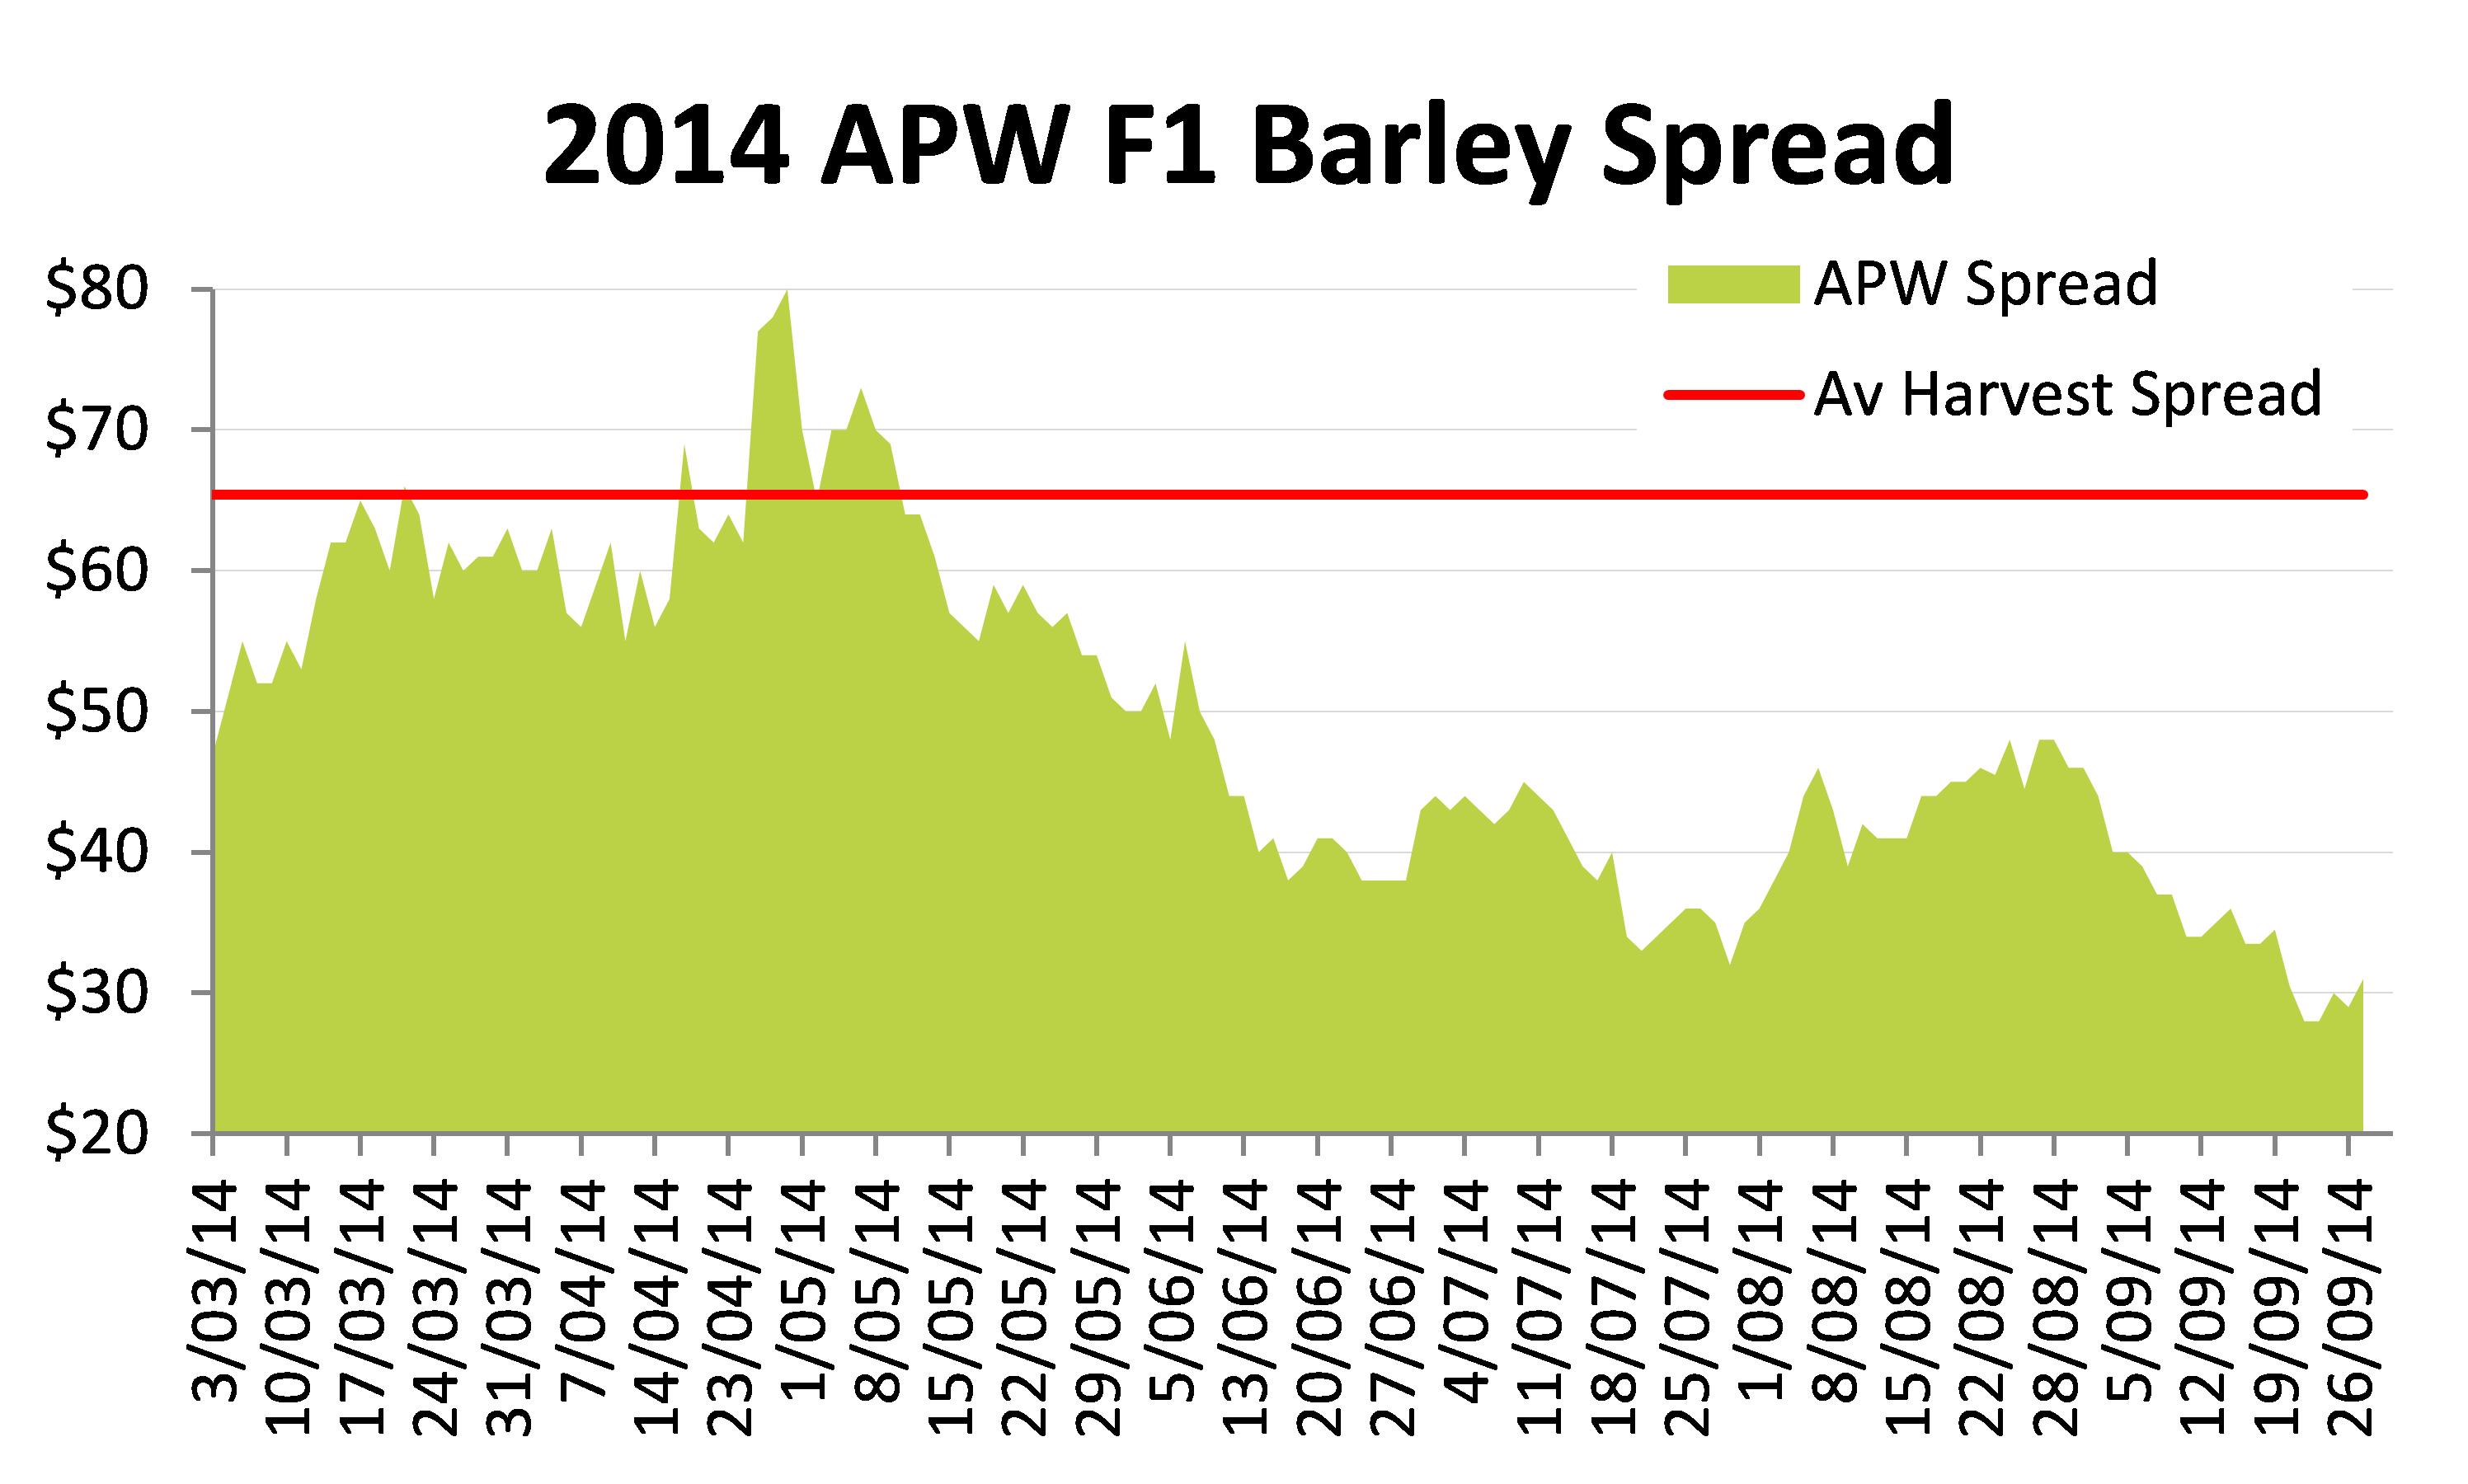
Figure 8. 2014 APW F1 barley spread.
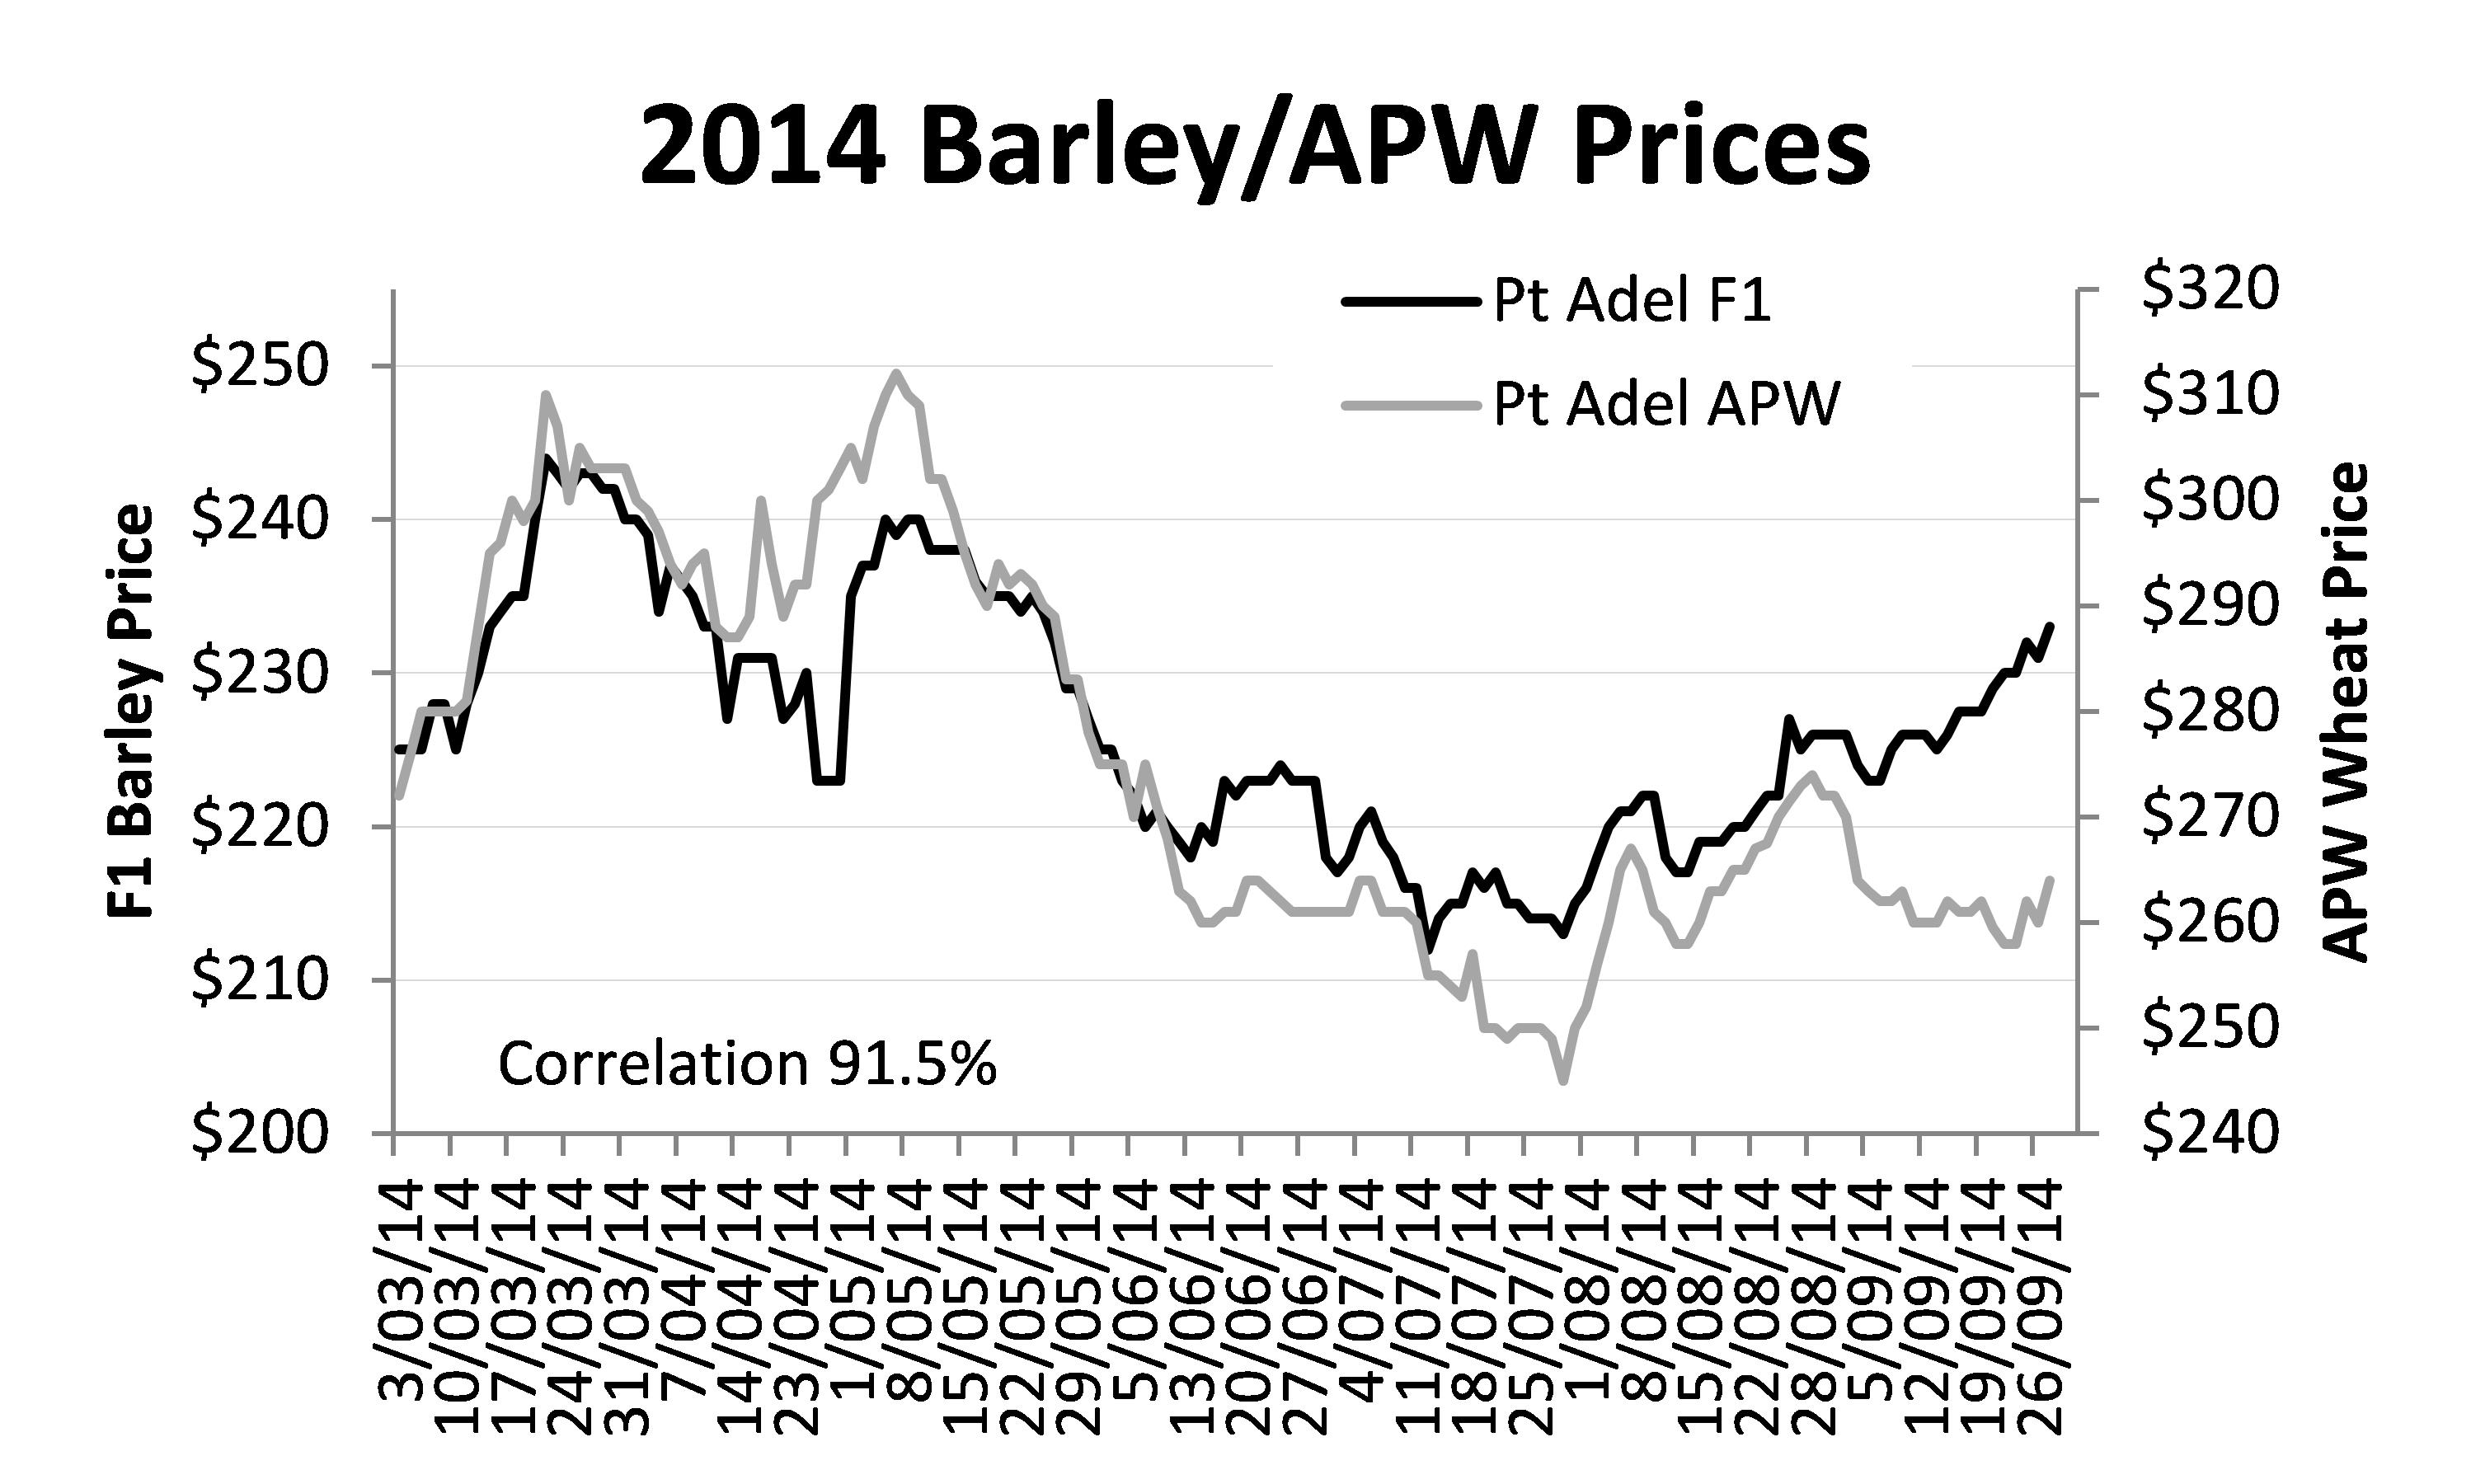
Figure 9. 2014 Barley/APW prices.
Barley prices stand a better chance of being higher than during the 2013 harvest than do wheat prices, unless the spread between wheat and barley opens up to more normal levels by harvest.
As usual, we would expect good selling for feed barley in the September – October period, and then again post harvest. Harvest selling opportunities may persist if feed barley looks well priced against wheat during the harvest period.
Canola
As we moved into the main harvest period for North American oilseeds at the start of September, there was some support for prices from wet weather in the US and Canada. While the US soybean crop is also set to be a record. The Canadian canola crop is also under pressure with exact losses from flooding and slow growth during the year unclear, particularly with wet weather delays to harvest during September. However, canola prices should bottom out during October as the US and Canadian oilseed harvests begin to wind up.
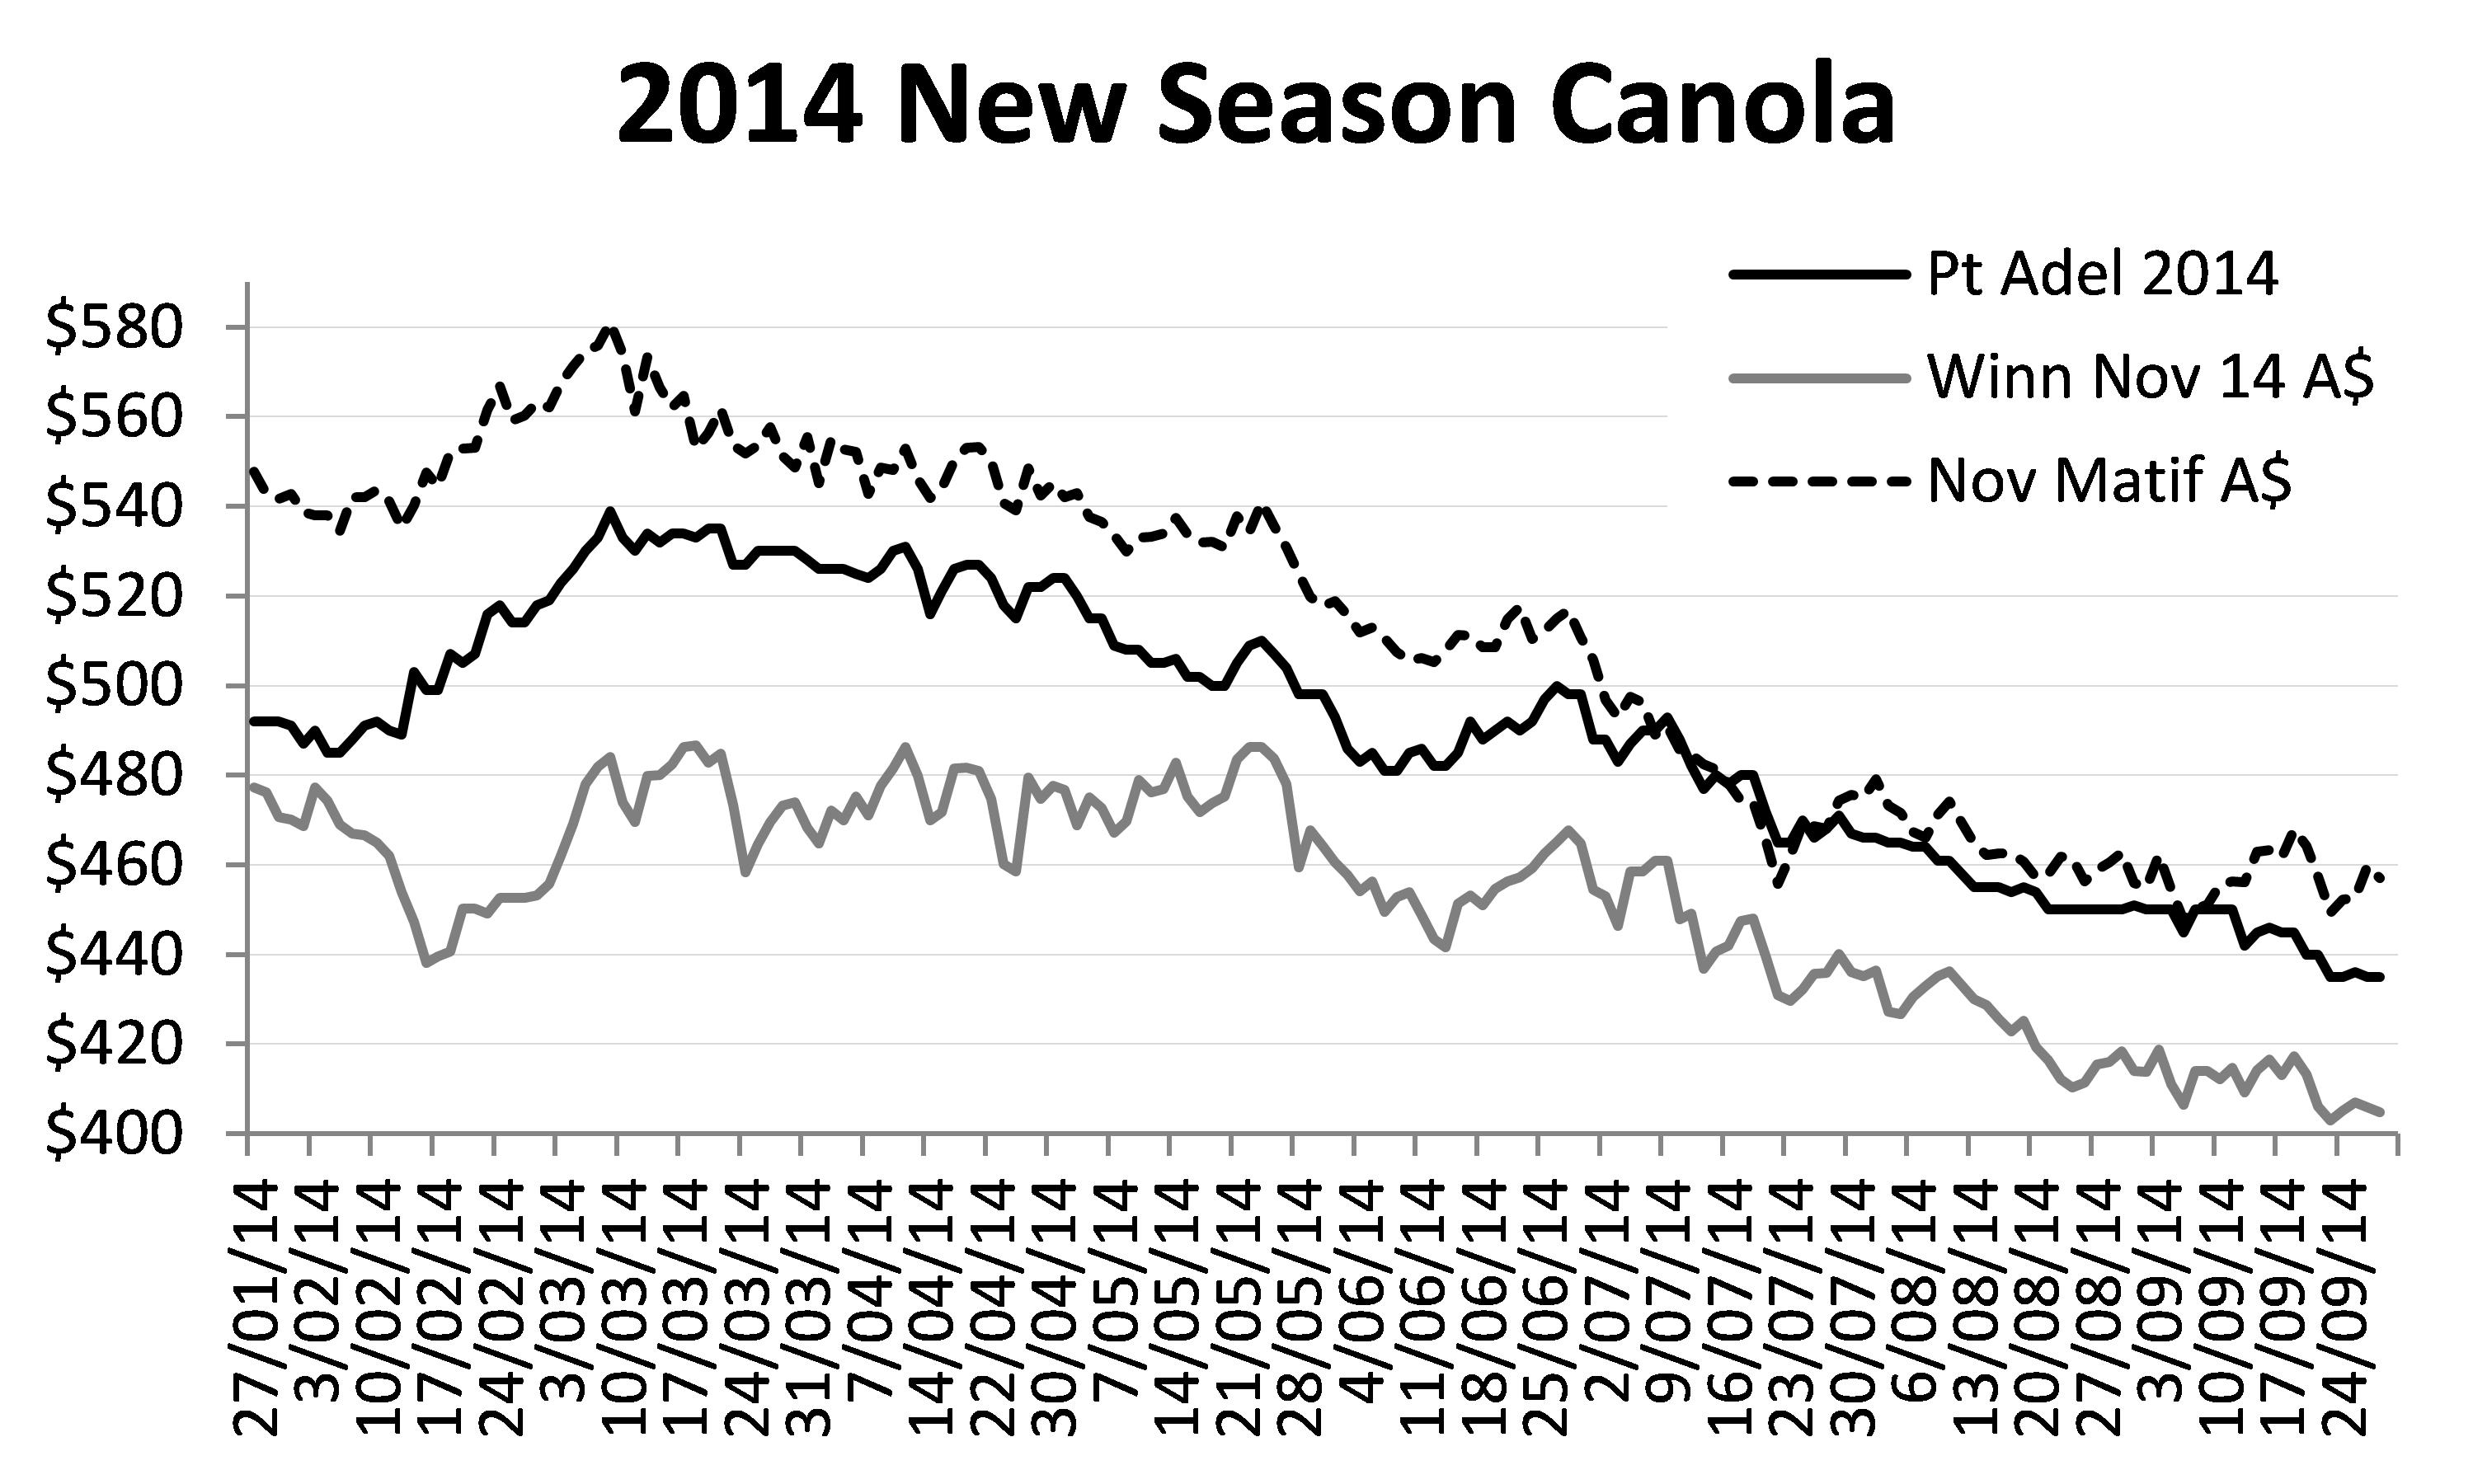
Figure 10. 2014 new season canola prices.
Longer term outlook for grain
Longer term, the outlook for prices is positive. There is enough good land available for grain production in South America, the Black Sea region and Russia, that output can expand as global demand grows over time. The catch is that corn, soybean and wheat prices have to be high enough to hold this extra land in production.
Global grain production is now much more sensitive to prices because of changes to the way subsidies are applied in the US and EU, and because additional land, particularly in South America, moves in and out of production, based on whether it is profitable to grow grain or not.
A lot of the discretionary grain acreage in the world is now in isolated places where transport costs to export terminals are high. Most countries also have similar on farm costs of production (i.e. we all use the same machinery, chemicals and fertilisers that are bought in the same global markets). The main differences are in labour costs; but broad scale agriculture does not use a lot of labour these days, so the impact is reduced.
If world prices are driven high enough by shortages, it becomes profitable to extend the acreage planted, and that is what happens. As production lifts, and prices fall, the costs of transport will see acres being pulled out of production and supplies pulled back closer to demand. The cycle then repeats itself.
There are three consequences to this pattern:
- Prices will cycle through highs and lows, depending on whether production is sufficient to meet demand or not.
- When prices are at their high point, grain production in Australia will be low. When prices are low, marginal regions in Australia will become unprofitable to farm, as they do elsewhere in the world.
- When we are at key decision times in the global production calendar, prices will reflect whether acres need to be dragged into production or pushed out. With the bulk of the grain produced in the northern hemisphere, this should perpetuate the annual cycle of higher grain prices in January to April (and October/November for winter wheat plantings).
We have currently come through a period of high wheat, corn and soybean prices. It has triggered a massive increase in output, with record crops expected for all three crops in 2014/15. That in turn is putting prices under pressure for our 2014 harvest as those crops hit the bins. Note that wheat production has not expanded at the same rate as corn or soybeans. In part this is because corn in particular has been taking acres from wheat.
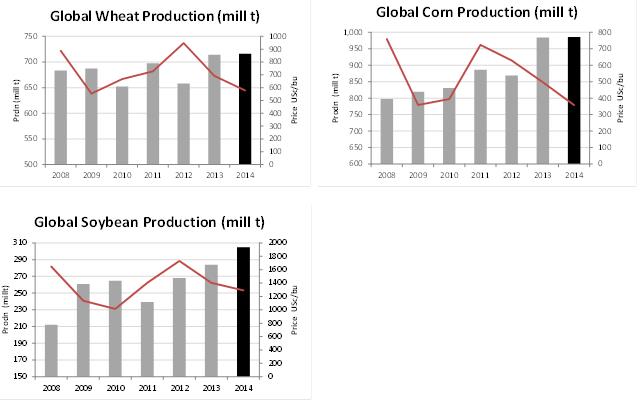
Figure 11 (a-c). Global production levels of wheat, corn and soybean from 2008 to 2014.
Contact details
Malcolm Bartholomaeus
Callum Downs, PO Box 54, Clare SA 5453
(08) 88422781; 0411 430 609
Was this page helpful?
YOUR FEEDBACK