Reducing risk of virus disease in chickpeas through management of plant density, row spacing and stubble
Author: Kevin Moore, Andrew Verrell and Mohammed Aftab | Date: 04 Mar 2014
2013 trials in northern NSW
Kevin Moore1, Andrew Verrell1 and Mohammed Aftab2
1Tamworth Agricultural Institute, NSWDPI, Tamworth NSW 2340, Australia.
2Grains Innovation Park, DEPI, Horsham VIC 3400, Australia.
GRDC code
DAN00143, DAN00171, DAN00176, DAV00134
Take home message
Reduce risk of viruses in 2014 chickpea crops by planting between rows of standing cereal stubble, sowing on time and targeting at least 25 plants/m2.
This paper should be read in conjunction with Sharman et al (2014) Viral diseases in chickpeas – impact and management. Our paper provides further detail on the effect of agronomic practices on the incidence of chickpea viruses in 2013 at two locations in north western NSW.
Introduction
Controlling virus disease in chickpeas is difficult. Chickpea plants that become infected with a virus invariably die. All current commercial desi and kabuli varieties grown in the GRDC Northern Region are susceptible to the main viruses in that region. GRDC funded field trials at the Liverpool Plains Field Station, Breeza in 2000, 2001, 2002, and 2003 showed no benefit of seed applied insecticides or regular foliar applied insecticides or a combination of both against chickpea viruses. The best and at this stage only, control strategies to reduce risk of viruses in chickpeas are agronomic. These include; retaining cereal stubble, sowing on time, establishing a uniform closed canopy, providing adequate nutrition and controlling weeds (Schwinghamer et al 2009, Verrell 2013, Murray et al 2014).
Effect of chickpea genotype on incidence of virus at Pine Ridge and Tamworth
Incidence of symptomatic plants of four desi varieties (Kyabra, PBA Boundary, PBA HatTrick and the advanced breeding line CICA0912) and one kabuli, GenesisTM090 was assessed on 11 October 2013 in field trials at Pine Ridge and at Tamworth (TAI – Tamworth Ag Institute). Although the incidences of virus throughout the trial sites and, at Pine Ridge in the surrounding commercial chickpea crop, were relatively low (<10%), variety had a significant effect on incidence of virus at both sites (Figure 1). PBA HatTrick had the lowest incidence at both sites followed by Genesis090. The ranking of Kyabra, PBA Boundary and CICA0912 varied with site (Figure 1).
In a similar trial conducted in 2012, there was no effect of variety (the same ones as in this trial) on incidence of symptomatic plants. Accordingly, there is insufficient data to recommend using chickpea variety as a tool for reducing risk of virus.
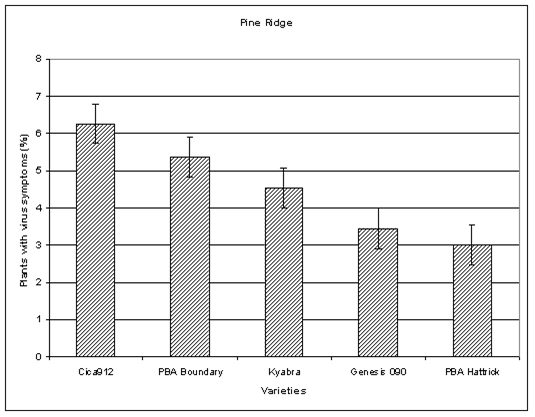
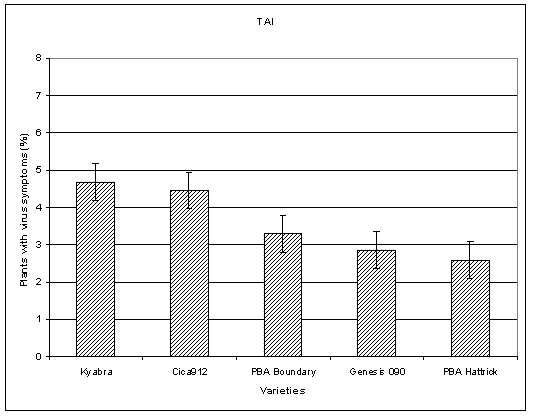
Figure 1. Incidence (%) of chickpea plants with virus symptoms for four desis and one kabuli at Pine Ridge (top) and Tamworth (bottom) on 11 October 2013
Plant density and incidence of plants with virus symptoms
In September/October 2012, viruses were common in chickpea crops throughout north central and northern NSW – almost every crop inspected had some level of virus (Moore et al, 2013, van Leur et al, 2013). Observations during that period suggested a link between plant density and incidence of virus; in addition, growers and agronomists reported a higher incidence of virus in chickpea crops with thin stands. In a 2012 trial designed specifically to examine the effect of plant population on chickpea viruses, Verrell (2013) found the highest incidence of symptomatic plants occurred at the lowest plant density (5 plants/m2). Incidence declined in a curvilinear fashion as plant densities increased. However, there was no significant difference in the incidence of plants with virus symptoms for 20, 30 and 45 plant/m2 densities.
Verrell’s 2012 trial was repeated in 2013 trials at two locations, one (Pine Ridge) in the virus prone region of the Liverpool Plains (van Leur et al 2003) and the other at the Tamworth Agricultural Institute (TAI), Tamworth. As occurred in the 2012 trial, incidence of symptomatic plants was greatest at the lowest sowing rate (5 plants/m2) at both 2013 sites and declined as plant densities increased. However, there was no significant difference in the proportion of plants with virus symptoms at 20, 30 and 45 plants/m2 densities.
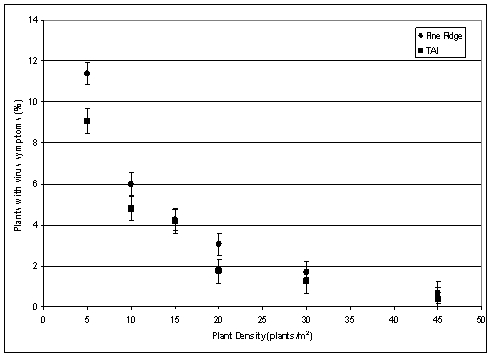
Figure 2. Effect of plant density on incidence of chickpea plants with virus symptoms at Pine Ridge and Tamworth, 2013.
Row spacing and incidence of plants with virus symptoms
Row spacing had a significant effect on incidence of plants with virus symptoms in a 2013 trial at Tamworth. On 11 October 2013, there were more than twice as many symptomatic plants/m2 in plots with 40cm rows compared to those with 80cm rows (Figure 4). Both row configurations were sown at 30 plants/m2 so plant density per unit area cannot account for the difference. Rather, plant density within each row appears to be responsible (12 plants/m row @ 40cm and 24 pl/m row @ 80cm).
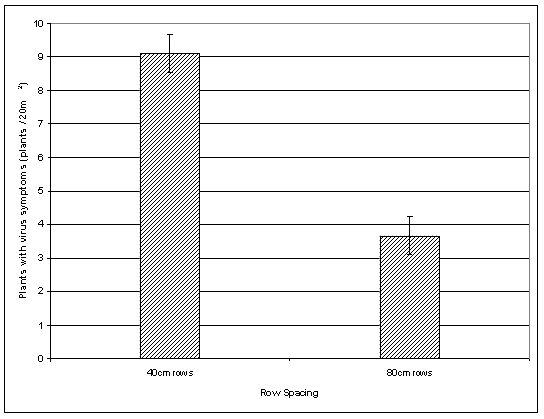
Figure 3. Effect of row spacing on incidence of chickpea plants with virus symptoms at Tamworth, 2013.
Stubble management and incidence of plants with virus symptoms
Planting into standing cereal stubble is known to help reduce risk of virus in lupin crops (Jones, 2001). Retaining standing winter or summer cereal is believed to be useful in reducing risk of virus in chickpea crops (Schwinghamer et al 2009) although van Leur et al (2013) found no relationship between stubble loading and incidence of virus in a quantitative survey of viruses in 2012 chickpea crops on the Liverpool Plains. However, we are not aware of any experimental data from trials designed specifically to examine the effect of stubble management on incidence of virus in chickpeas in the GRDC Northern region.
Two trials were conducted at Tamworth in 2013 to compare standing versus flat (slashed) wheat stubble on incidence of plants with virus symptoms. One trial was sown at 80cm row spacing; the other at 40cm spacing; both were sown with PBA HatTrick chickpea at 30 plants/m2. The 80cm trial was assessed on 11 October and the 40cm trial was assessed on 9 October and again on 16 October. In both trials, incidence of plants with virus symptoms was lower where the chickpeas had been sown into standing stubble (Figures 4 & 5). Individual plots in these trials were small, 2m x 10m for the 80cm trial and 4m x 10m in the 40cm trial. This raises the question: “If the vectors have no choice ie the entire paddock has standing stubble (or not), is stubble management still a useful tool for reducing virus risk?” Based on our own and other’s observations in commercial crops, we believe the answer is Yes; but further research is needed.
Virus species in Pine Ridge and Tamworth trials
Chickpea plants with symptoms of virus infection were sampled for virus testing by Tissue Blot Immuno Assay (TBIA). At each sampling time, 15 symptomatic plants were collected and tested for Alfalfa mosaic virus (AMV), Cucumber mosaic virus (CMV) and Beet western yellows virus (BWYV). At Pine Ridge, 15 symptomatic plants were also tested from the surrounding crop of Almaz chickpeas. In addition 15 asymptomatic (healthy, turgid, vigorous, green plants) were also tested from each trial and the Almaz crop. By far the most common virus was BWYV, accounting for 65 – 94% (mean 83%) of symptomatic plants; 12% of symptomatic plants were positive for AMV; CMV was not detected in any symptomatic plants; only one (out of 105) plant was co-infected with BWYV and AMV. None of the 45 asymptomatic plants tested positive to any of the three viruses.
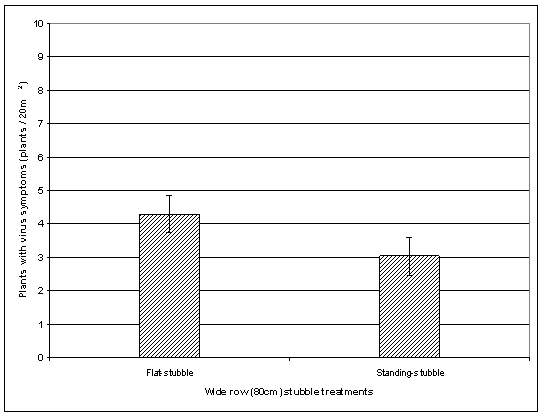
Figure 4. Effect of stubble management (flat vs standing) on incidence of chickpea plants with virus symptoms, Tamworth 2013.
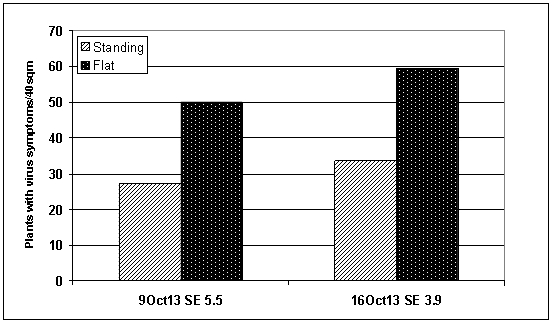
Figure 5. Effect of stubble management (flat vs standing) on incidence of chickpea plants with virus symptoms assessed on two dates, Tamworth 2013.
Conclusions
- Sow at the optimal seeding rate - irrespective of sowing date
- Plant on time
- Retain standing cereal stubble and sow between the stubble rows
References
Jones RAC (2001) Developing integrated disease management strategies against non-persistently aphid-borne viruses: a model program. Integr Pest Manag Rev 6:15–46
Moore K, Ryley M, Sharman M, van Leur J (2013). Proceedings 2013 GRDC Grains Research Update, Goondiwindi.
Sharman M, Moore K, van Leur J, Aftab M and Verrell A (2014). Viral diseases in chickpeas – impact and management. Proceedings 2014 GRDC Grains Research Update, Goondiwindi.
Schwinghamer M, Knights T, Moore K (2009). Virus control in chickpea--special considerations. Australian Pulse Bulletin PA 2009 #10
van Leur J, Aftab M, Manning W, Bowring A and Riley M (2013). A severe outbreak of chickpea viruses in northern New South Wales, Australia, during 2012. Australasian Plant Dis. Notes (2013) 8:49–53
van Leur JAG, Makkouk K, Freeman A, Schilg M (2003) Occurrence of viruses in faba bean on the Liverpool Plains, northern New South Wales. In: Martin B (ed) Update of research in progress at the Tamworth Agricultural Institute 2002. NSW Agriculture, Tamworth, pp 58–59
Verrell A (2013). Virus in chickpea in northern NSW 2012 – the effects of sowing date, plant density and nutrition on virus symptoms in chickpea. Proceedings 2013 GRDC Grains Research Update, Goondiwindi.
Acknowledgements
Thanks to Tom Bailey, ‘Gunnadilly', Pine Ridge for providing land and other resources for the Pine Ridge trial, and to Michael Nowland, Paul Nash and Gail Chiplin for technical support.
Contact details
Dr Kevin Moore & Dr Andrew Verrell
NSW Department Primary Industries, Tamworth
Kevin: 02 6763 1133; 0488 251 866; Andrew: 0429 422 150
Email:kevin.moore@dpi.nsw.gov.au, andrew.verrell@dpi.nsw.gov.au
® Registered trademark
![]() Varieties displaying this symbol beside them are protected under the Plant Breeders Rights Act 1994.
Varieties displaying this symbol beside them are protected under the Plant Breeders Rights Act 1994.
Was this page helpful?
YOUR FEEDBACK