The competitive position of Australian grains in SE Asian markets, 5 years after deregulation
Author: Dr. Soon-Bin Neoh, Soon Soon Group of Companies. | Date: 13 Feb 2014
Author
Dr. Soon-Bin Neoh (Soon Soon Group of Companies).
Take home messages
- Australian wheat has become more competitive in SE Asia after deregulation.
- Quality of Australian wheat in containerised shipments has deteriorated post deregulation.
- Black Sea wheat can be competitive in price and quality at certain times of the season.
- Demand for canola oil and meal is increasing in SE Asia. Australian canola can be competitive in price and quality but Black Sea canola can be attractively priced at certain times of the year.
- 25 per cent of the world consumption of soy foods is in SE Asia. Certain varieties of Australian soybeans can perform well in soy milk and tofu when compared with Canadian and US soybeans.
- With the World Health Organisations current programme of reducing non-communicable diseases (NCDs) by 25 per cent by 2025, lupins have a potential to be incorporated into Asian food products.
- Dehulled lupin meal can replace soybean meal in poultry and swine feed.
Abstract
Australia is in close proximity to SE Asia and has traditionally supplied much of the wheat requirements of the region. However, North America supplies most of the spring wheat used in bread making. Indian and Pakistani wheat, when competitively priced, can replace ASW/APW in biscuit and general purpose applications but SE Asian millers don’t like the quality.
Recently, increased production of wheat in the Black Sea region has resulted in Black Sea wheat becoming more competitively priced, especially when shipped in containers. Black Sea wheat is available in low and high protein varieties which can replace ASW/APW and AH/APH respectively. The quality of Black Sea wheat is acceptable but availability is seasonal and prices will increase after the initial harvest period.
The use of North American spring wheat is preferred in sponge and dough bread making which predominates in the region. To date, neither APH nor AH has been able to capture a significant share of this market. However, new varieties like EGA Kidman shows promise. Deregulation of the single desk increased the number of wheat sellers which helps to make Australian wheat more competitively priced. However, quality and supply chain problems have emerged especially for containerised shipments. There is a need for a centralised export quality inspection service to ensure Australian wheat quality is maintained for exports.
The consumption of canola oil is increasing in the region, and increasing poultry and pig production has resulted in a large quantity of soybean meal being imported. This gives an opportunity for the local crushing of canola in the region where canola meal can partially replace soybean meal. In general, Australian canola is good quality, but again there is competition from Black Sea canola.
The SE Asian region accounts for 25 per cent of the world’s soy food consumption. Annually, 3.5 million tonnes of food soybean is used to produce soy milk, tofu, tempe etc. The main suppliers are Canada and USA. Australia has the potential to supply the top end of this market. Our own evaluation shows that certain varieties of Australian soybeans can perform well in soy milk and tofu.
The region imports soybean meal as the main protein supplement for poultry and swine feeding. Australian researchers have shown that lupin is an excellent protein supplement for aquaculture and ruminant animals. Our own research shows that with proper processing, lupins can also replace soybean meal in poultry and swine feeding without growth performance penalties. The recent initiative by the World Health Organisation (WHO) on reducing Noncommunicable diseases (NCDs) by 25 per cent by 2025 should offer opportunities for the use of lupin as a nutraceutical supplement in Asian food products. Besides being able to lower postprandial blood sugar levels, lupin is also useful for the potential prevention of cardiovascular diseases. Lupin flour can be used in Asian food products such as noodles, bread, biscuits and sausages to increase fibre and protein contents.
Australian wheat will continue to be competitive into SE Asia but there is a need for better export quality control especially for containerised shipments. The formation of a centralised export inspection service and the setting up of a centralised product development centre will enhance the competitiveness of Australian wheat. Having a timely centralised annual crop report will also help. Besides wheat, Australian canola, lupins and soybeans also have tremendous potential in SE Asian food and animal feeds.
1. Competitive trade position of Australian wheat in SE Asia post deregulation
Australia is in close proximity to SE Asia and traditionally supplies most of the wheat requirements of SE Asia. However, deregulation of the single desk has changed the dynamics of the Australian wheat trade as many new smaller trading companies have emerged to compete with the Australian Wheat Board, Graincorp and CBH. Containerised shipments have also increased dramatically and the numbers of buyers of Australian wheat have also increased significantly. The benefit of a free market for wheat includes increased sales of Australian wheat to SE Asia and decreased sales to the Middle East due to logistics cost favouring SE Asia.
Figure 1. Australian wheat exports by region.
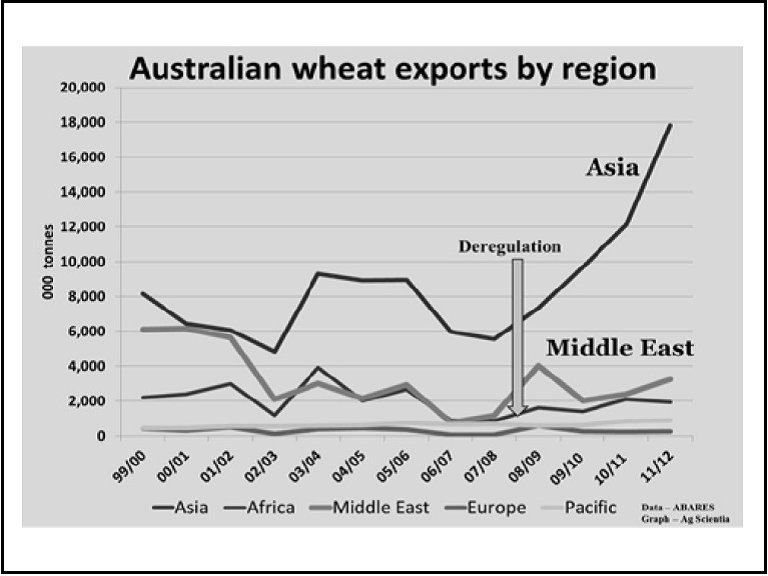
Figure 1 text description: The highest Australian wheat export was seen in Asia, with the lowest being the Pacific and Europe. The Asia export increased dramatically after the deregulation. The Middle East export, which in 99/00 had similar export tonnes to Asia, decreased overall.
Figure 2. Southeast Asia wheat imports.
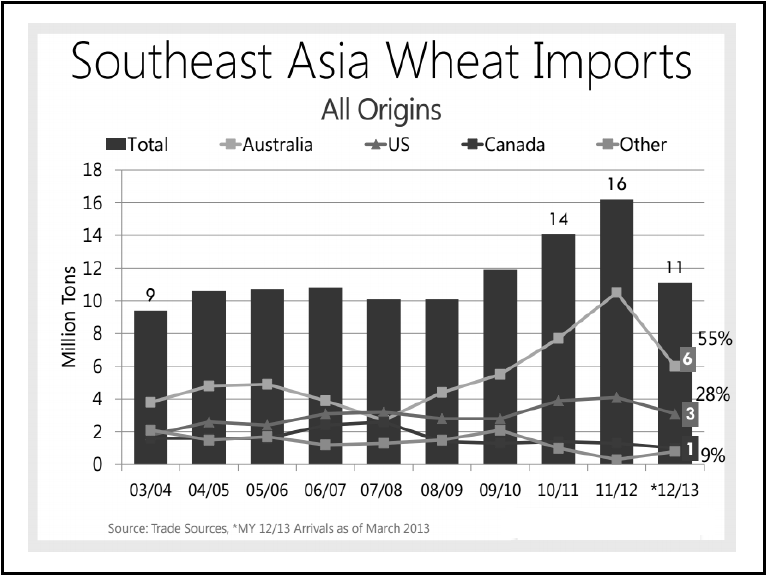
Figure 2 text description: The highest Wheat import in million tonnes to Southeast Asia was from Australia contributing to 55% of the wheat imports. The total import amount to Southeast Asia peaked in 11/12 where it reached 16 million tonnes. The lowest Wheat import in million tonnes to Southeast Asia was from Canada and Other countries.
Figure 3. Tonnages exported by year for bulk and non bulk.
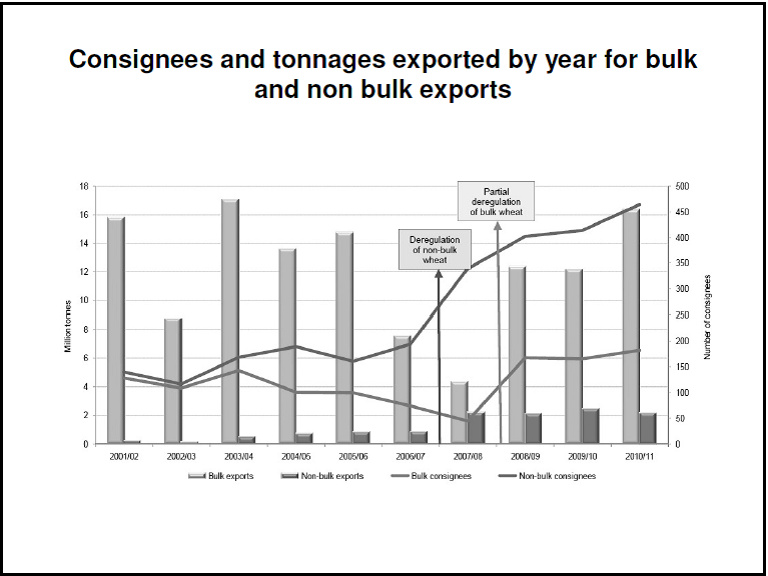
Figure 3 text description: In all instances, there was significantly more tonnages exported by year for the bulk exports compared to non-bulk exports. There was a large drop in the bulk exports after the deregulation of non-bulk wheat in 2007/08. At this stage, there was a small rise in the non-bulk exports. 2007/08 showed the less difference in tonnages exported by year for bulk and non-bulk exports. In all instances, there was higher consignees exports in non-bulk compared to bulk. Between 2001 and 2003, both bulk and non-bulk consignees exports were very similar, however non-bulk showed more significant rises in the amount of exports and non-bulk did not overall.
In recent years, increasing export availability from the Black Sea and Commonwealth of Independent State (CIS) countries has made wheat, especially in containers, competitive into SE Asia at certain times of the year.
Figure 4. Black Sea wheat exports.
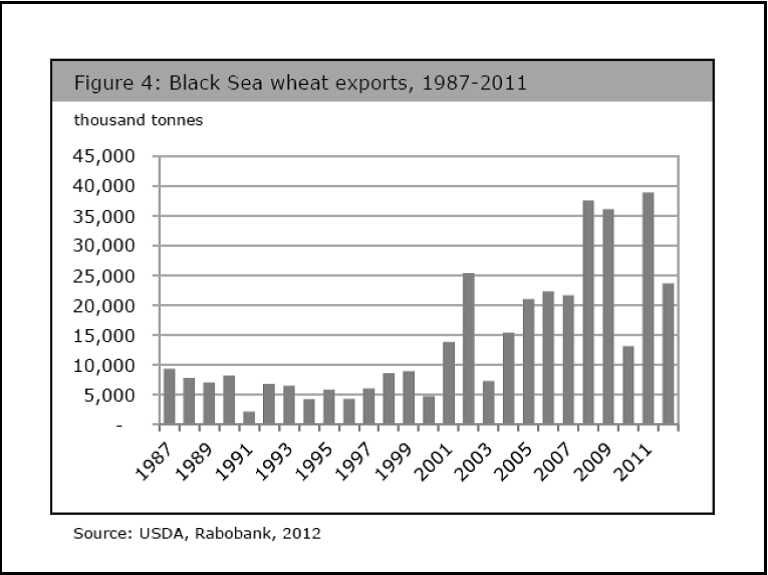
Figure 4 text description: The Black Sea wheat exports sees an overall rise from 1987 to 2011. The lowest year for exports was in 1991 where there was less than 2,500,000 tonnes exported. The highest amount of wheat exported was seen in 2011 when it was greater than 37,000,000 tonnes.
Figure 5. Net changes in world wheat trade for major exporters.
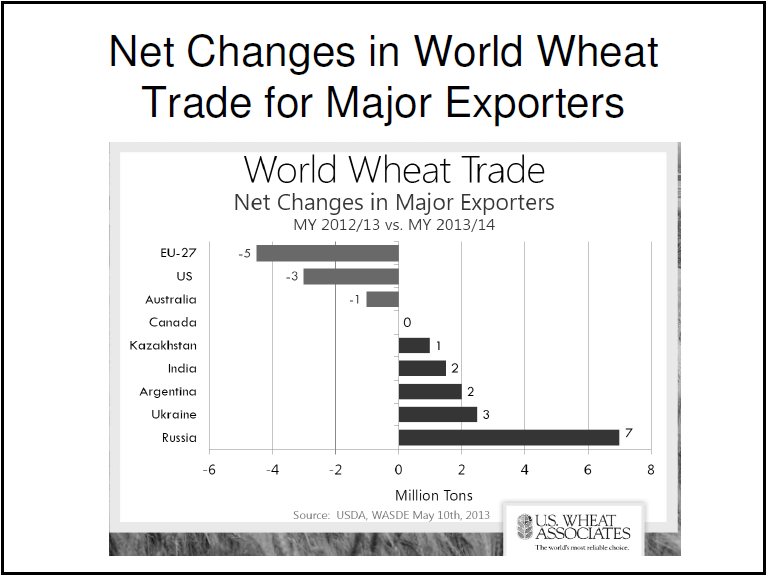
In general, freight spreads favour Australian wheat over North American wheat into SE Asia. HRW is not competitive versus ASW/APW, but soft wheat like WW/SWW/SRW is replacing Australian soft wheat which is getting difficult to find. Nevertheless, even in years when North American spring wheat trades are at a big premium over APH/AH, SE Asian millers are still forced to import spring wheat for use in bread making due to the predominance of the sponge and dough method for making bread.
Figure 6. Comparison of bulk vs container freight rates by region.
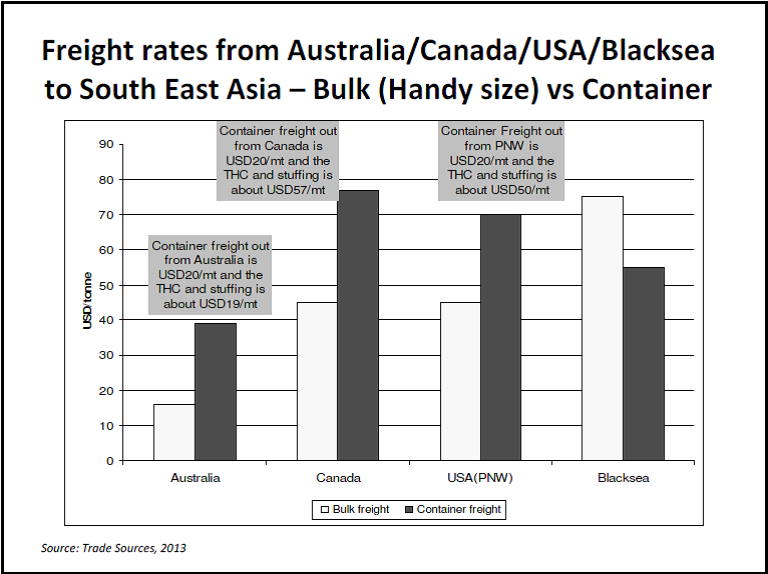
Figure 7. Comparison of high protein wheat prices into SE Asia – bulk vs container.
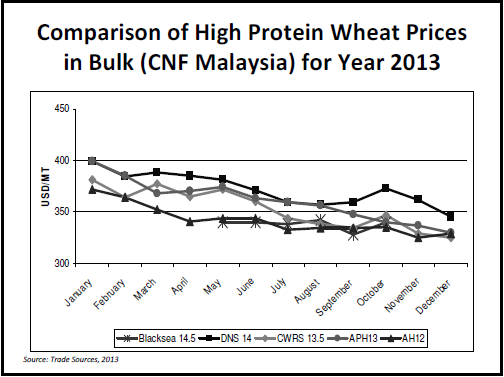

Figure 8. Comparison of medium protein wheat into SE Asia – bulk vs container.
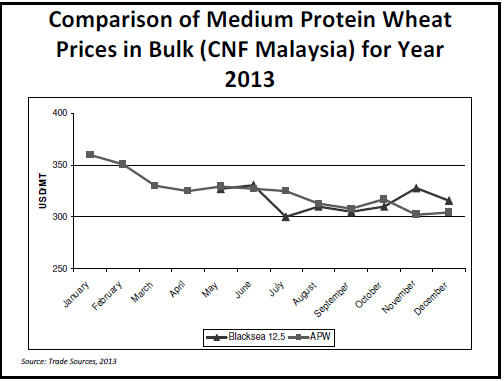
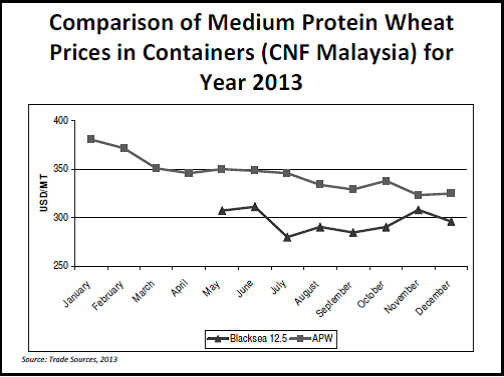
Figure 8 text description: Both container and bulk showed a decrease in prices in APW throughout the year. APW prices in Bulk were lower than APW prices in container with bulk randing from approximately 365USD/MT to approxiamtely 300USD/MT and container ranging from approximately 380USD/MT to approximately 325USD/MT. Blacksea 12.5 prices was higher in Bulk when compared to container prices with bulk ranging from approximately 330USD/MT to a low of approximately 300USD/MT and container prices ranging from approximately 310USD/MT to a low of approximately 275USD/MT. Both Bulk and Container Blacksea 12.5 prices saw their lowest prices in July.
From Figures 6 to 8, we can conclude that Black Sea wheat in containers can be discounting Australian wheat of an equivalent quality by more than USD50 per MT at certain times of the season.
Indian and Pakistani wheat are available sporadically and despite being competitively priced over Australian wheat, they are not preferred in SE Asia due to poor quality and high foreign matter contamination.
1.1 Summary
Australian wheat is generally competitively priced into SE Asia and usually performs well in Asian food products with the exception of sponge and dough bread making. However, the quality of Australian wheat particularly in containerised shipments has declined post deregulation of the single desk. The amount of admixture has increased and there are large variations in quality from shipment to shipment. The maintenance of varietal integrity is sometimes not practised, for example, AH varieties are being passed off as APH. This is partly due to the lack of a centralised export quality inspection system like the FGIS in the USA and the Grain Commission in Canada.
Production of Black Sea wheat is increasing and the quality seems to be improving. Once they have fulfilled the market requirements of the Middle East and North Africa, SE Asia will become their next export target.
2. Competitive quality advantages of Australian wheat in Asian food products
In Asia, wheat is mainly use for making noodles, bread, biscuits and streamed bread. These wheat based products are the staple food of many Asian countries and the consumption is growing rapidly with increasing disposable income in the region. Australian wheat is good quality white wheat and has many functional advantages in Asian foods, especially in noodle applications where it is important for the product to appear bright.
In recent years, Black Sea wheat has become more predominant and its quality has improved. The lower protein Black Sea wheat, with 11.5 to 12.5 per cent protein dry basis, performs well in biscuits and general purpose food applications. In bread making, Canadian and US spring wheat perform better than APH and AH wheat due to the predominance of the sponge and dough method of bread making in the region.
Asian food products have specific and unique wheat quality requirements for good end-product performance. We have studied the performance of different wheat types from different origins in Asian food products and our findings are as follows.
2.1 Flour quality requirements for noodles
- Bright yellow colour;
- Good gluten quality with high viscosity to produce firm and elastic noodle;
- Fast gluten development and good extensibility for easy sheeting and processing;
- Good colour stability for fresh noodle or wanton noodle; and
- High falling number with low enzyme activity for non-sticky noodles and longer shelf life (fresh noodles).
Figure 9. Performance of different medium protein wheat types in alkaline noodle.
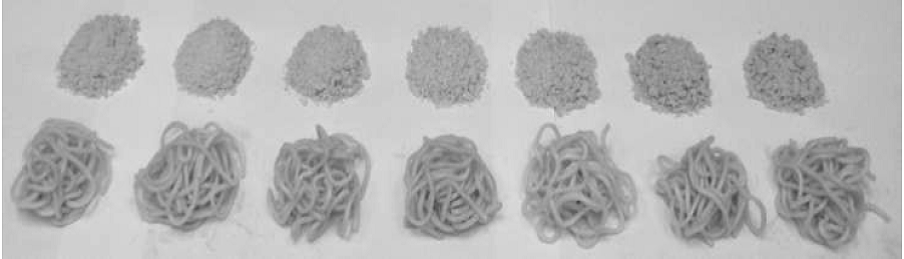
(L to R) ASW APW10.5 HRW CPSW CPSR Russian Ukraine
Summary of wheat performances in alkaline noodle.
- Water absorption: APW=HRW=CPSW>ASW=CPRS>Russian=Ukraine
- Brightness of colour: APW=CPSW> ASW>Russian > CPSR>HRW>Ukraine
- Texture/Strength: APW=HRW=CPSW>CPSR=Russian=Ukraine>ASW
Performance rating: APW =CPSW> HRW>CPSR=ASW>Ukraine = Russian wheat
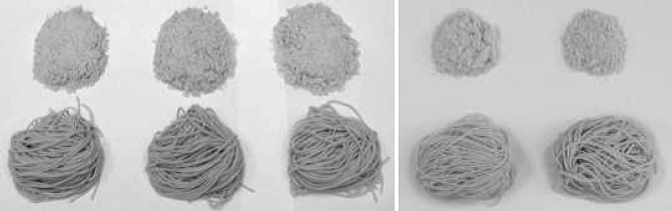
Figure 10. Colour stability of different wheat in wanton noodle.
Wanton noodle 0 day
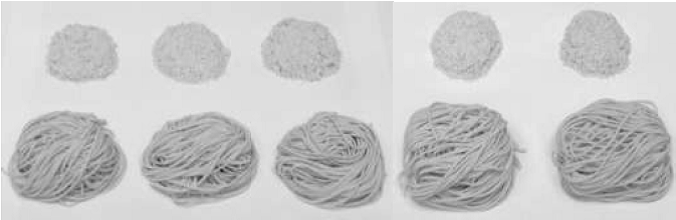
(left to right) DNS 14 CWRS13.5 APH13 CWHWS13.5 AH13
(left to right) DNS 14 CWRS13.5 APH13 CWHWS13.5 AH13
Color stability rating: CWHWS>AH>APH>CWRS>DNS
|
Wheat types |
Origins |
Quality rating |
|
|---|---|---|---|
|
Good |
Acceptable |
||
|
APH/AH |
Australia |
V |
|
|
APW |
Australia |
V |
|
|
ASW |
Australia |
|
V |
|
Indian Wheat |
India |
|
V |
|
Pakistan wheat |
Pakistan |
|
V |
|
Russian wheat |
Russia |
|
V |
|
Ukraine wheat |
Ukraine |
|
V |
|
HRW |
USA |
|
V |
|
CWHWS/ CPSW |
Canadian |
V |
|
2.2 Flour quality requirements for breads
- High water absorption for better processing and high yield;
- Good gluten quality for better oven spring;
- Short mixing time with good mixing tolerance;
- Good gas retention to give good volume; and
- Soft eating quality for longer shelf life.
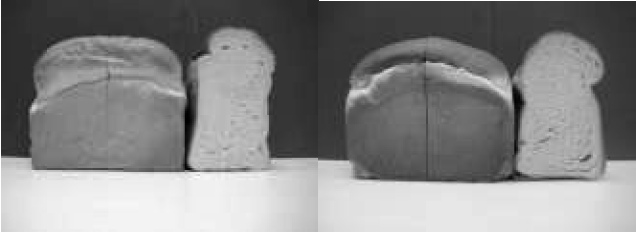
Figure 11. Performance of different wheat types in white bread.
(left to right) 25% 37% 27% 27% 32% Oven spring
(left to right) Russian14(DB) DNS14 AH12 KAZ13.5(DB) CWRS13.5
Figure 12. Crumb structure. 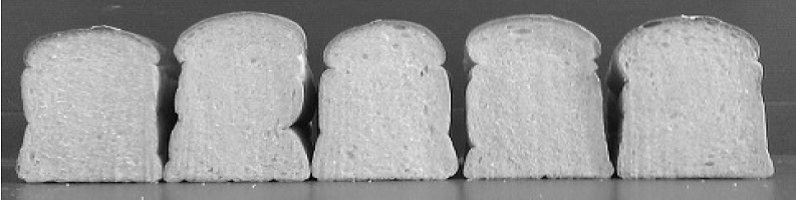 (left to right)
Russian14(DB) DNS14 AH12 KAZ13.5(DB) CWRS13.5
Summary of wheat performances in bread.
- Water absorption: CWRS > DNS > KAZ > AH12 = Russian
- Oven spring: DNS > CWRS > AH12=KAZ > Russian
- Crumbs structure: DNS> CWRS=KAZ>AH12>Russian
Performance rating: DNS > CWRS> KAZ=AH12> Russian wheat
|
Wheat types |
Origins |
Quality rating |
|
|---|---|---|---|
|
Good |
Acceptable |
||
|
APH13 |
Australia |
|
V |
|
AH12-13 |
Australia |
|
V |
|
CWRS13.5-14.5 |
Canadian |
V |
|
|
CWHWS 13-14 |
Canadian |
|
V |
|
DNS14-15 |
USA |
V |
|
|
HRW13 |
USA |
|
V |
| High protein Black Sea wheat 14.5 -15% (db) |
Kazkhastan | V | |
| Lithuanian | V | ||
| Russian | V |
||
| Ukraine | V |
||
2.3 Flour quality requirements for biscuits
- Extensible dough characteristic for better sheeting process;
- Strong gluten quality for good fermentation tolerance (cracker production);
- Fast hydration rate and short mixing time; and
- Produce light, flaky and crispy biscuits.
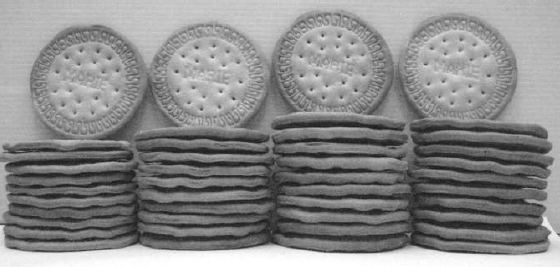
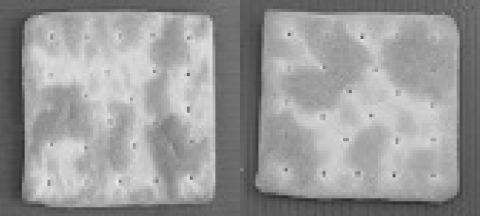
Figure 13. Performance of different wheat types in cream cracker.
(left to right) APH13 CWRS13.5 CWHWS 13 DNS14
Summary of wheat performances in cream cracker.
- CWRS13.5 and DNS14 showed better puffiness than APH13 and CWHWS; and
- CWHWS and CWRS13.5 provide better eating quality; the biscuit is more flaky and crispy.
Performance rating: CWRS13.5 > CWHWS = APH > DNS
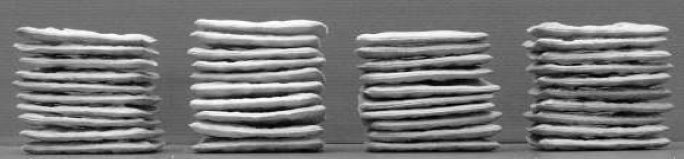
Figure 14. Performance of different wheat types in marie biscuit.
120% 125% 140% 133% Leavening effect
APW ASW UKRAINE 11.5(DB) RUSSIAN11.5 (DB)
Summary of wheat performances in marie biscuit.
- Ukraine and Russian wheat can give a better puffiness, crispy and loose texture marie biscuits than ASW and APW wheat.
Quality rating: Ukraine > Russian> ASW> APW
|
Wheat types |
Origins |
Quality rating |
|
|---|---|---|---|
|
Good |
Acceptable |
||
|
APW |
Australia |
|
V |
|
CPSR |
Canadian |
|
V |
|
ASW |
Australia |
V |
|
|
Indian wheat |
India |
|
V |
|
Russian wheat |
Russian |
V |
|
|
Ukraine wheat |
Ukraine |
V |
|
2.4 Flour quality requirements for steamed bread
- Bright and white color;
- Good symmetry form/shape;
- Good water absorption for easy processing; and
- Soft and springy eating quality.
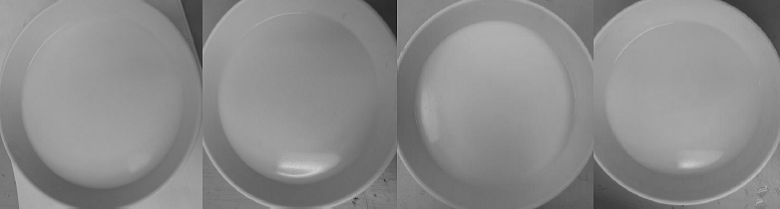
Figure 15. Performance of different wheat types in steamed bread.
APW Indian wheat Ukraine12.5 (DB) Russian12.5 (DB)
Summary of wheat performances in steamed bread.
- APW showed a brighter/whiter color and good shape;
- Russian and Ukraine wheat gave good volume, but the color is not as good as APW; and
- Indian wheat is not suitable to use in steamed bread.
Performance rating: APW > Russian=Ukraine> Indian wheat
|
Wheat types |
Origins |
Quality rating |
|
|---|---|---|---|
|
Good |
Acceptable |
||
|
APW |
Australia |
V |
|
|
Indian wheat |
India |
|
No |
|
Ukraine wheat |
Ukraine |
|
V |
|
Russian wheat |
Russia |
|
V |
3. Comparison of new prime hard varieties (EGA Kidman and Gascoigne blend) developed for sponge and dough bread making against DNS14 and CWRS13.5
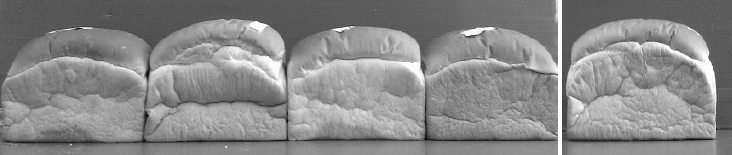
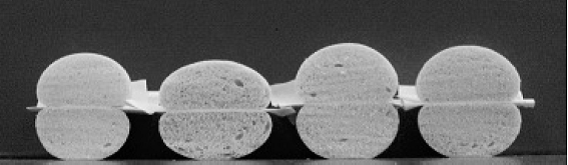
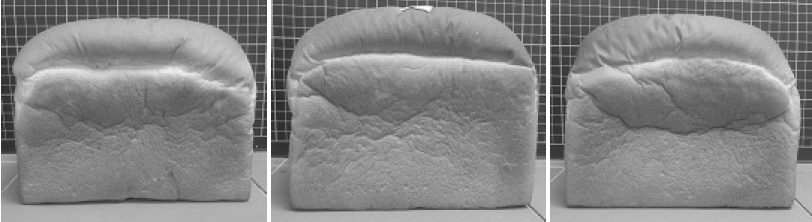
3.1 Open top white bread using sponge and dough method
Sponge surface.
Figure16. Sponge characteristic after 4 hours fermentation.
Smooth surface Smooth surface Rough surface with gas bubbles
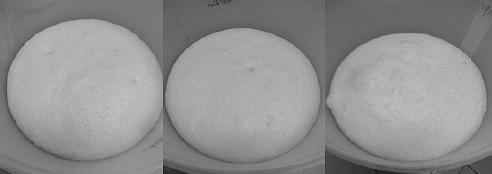
100% DNS14 100% CWRS13.5 100% APH13
Figure 17. Oven spring.
25% 20% 22%
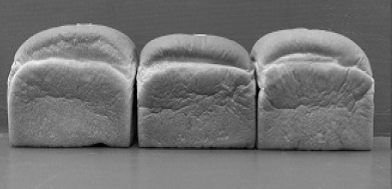
100% DNS 100% CWRS 100% APH
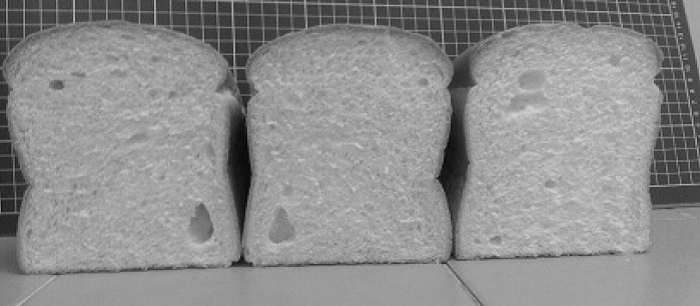
Figure 18. Crumb structure.
Fine Slightly fine Bright and fine
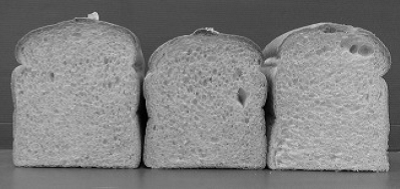
100% DNS 100% CWRS 100% APH
Findings.
- 100% DNS gave the best quality bread because of good sponge tolerance, oven spring and crumb structure;
- 100% APH13 showed poor sponge tolerance, however the oven spring and crumb structure are good and acceptable; and
- 100% CWRS gave good sponge tolerance but the bread performance is the poorest among all wheat.
3.2 Combination of APH with North American spring wheat
Figure 19. Oven spring.
20% 20% 20% Oven spring
50% DNS 50% CWRS 50% DNS 50% APH 50% CWRS 50% APH13
Figure 20. Crumb structure.
50% DNS 50% CWRS 50% DNS 50% APH 50% CWRS 50% APH13
Findings
All samples showed insignificant difference for oven spring and crumb structure. From the results, we found APH (Kidman & Gascoigne blend) is able to perform reasonably well in sponge and dough bread making. However its sponge tolerence is weaker when compared to North American spring wheats. Nevertheless, these new APH varieties can be used in conjunction with North American spring wheat for bread making with good results .
3.3 Summary
The stronger North American spring wheats perform better than Australian APH and AH wheat in bread products. There is potential for lower protein Black Sea wheat to replace ASW/APW and high protein Black Sea wheat to replace APH/AH wheat in many Asian food products .
The search for a white wheat that will perform well in both noodles and bread making rages on both sides of the Pacific Ocean. The lastest prime hard varieties of EGA Kidman and Gascoigne seem to offer promise. The CWHWS from North American gives a reasonable performance in bread, noodles and biscuits applications and therefore has the potential to be a universal white wheat.
4. Competitive position of Australian canola to SE Asia
Canola is now a major crop in Australia. In general, the quality of Australian canola is as good as, or better than, Canadian or Black Sea canola. The oil content is usually higher and the glucosinolate content is lower.
Favourable freight spreads makes Australian canola competitive into SE Asia, but due to the fact that there are only a few crushers crushing canola in SE Asia most of the canola is exported to Europe and the Indian subcontinent. However, the increasing demand for canola oil in SE Asia, and the fact that canola meal is beginning to gain acceptance as an alternative protein source to soybean meal in poultry, will encourage crushers in the region to start crushing canola.
Recently, large canola crops in the Black Sea region resulted in cheap canola exports, but only for a short period of time after their harvest. We find Black Sea canola usually has a lower oil content and higher glucosinolate levels.
Although canola oil is viewed as a premium cooking oil in the region, canola meal is not perceived as an equal alternative to soybean meal in poultry despite the higher levels of methionine. This is due to the lower protein levels and higher fibre content of canola meal when compared with dehulled soybean meal which is the gold standard for protein supplementation of poultry feed . The processing of canola meal causes more damage to the protein and energy contents when compared to soybean meal processing. Furthermore, dehulling of canola meal is not commercially viable. However, improvements in canola processing, developed by our company, have produced a canola meal that performs better than other canola meals and is similar to the soybean meal control diet in scientifically controlled feeding trials with broilers. Cold pressed canola meal was also tested to have higher energy and amino acid availability than regular canola meal.
Figure 21. World consumption for soybean meal.
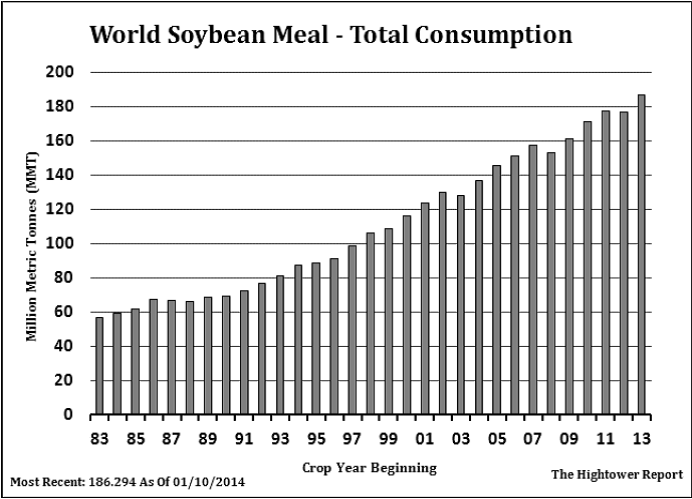
Figure 21 text description: From the year 1983, the total world soybean meal consumption has steadily increased. In '83, the total consumption was approximately 57 million metric tonnes and has increased to approximately 188 million metric tonnes in the year 2013.
A broiler trial was conducted at Bangkok Animal Research Centre in Thailand comparing the growth performance of broiler chicks fed with solvent extracted canola meal from various origins using a corn soy diet as control.
A total of three hundred and twelve newly hatched male broiler chicks of commercial strain (Ross 308) were randomly allocated to four treatments with six replications using 13 chicks in a pen as an experimental unit. Feeds were prepared for two phases of feeding. Starter feeds were offered from day one until day 16, whereas grower feeds were fed from day 17 until day 34. Solvent extracted canola meal was included at 5 per cent in the starter diet and 10 per cent in the grower diet. Feed and water were offered ad libitum through out the whole experiment. Body weight gain (BWG), feed conversion rate (FCR), feed Intake, livability rate and fecal score were recorded and measured in this trial. Table 5 demonstrates overall growth performance results for the 34 days of feeding.
|
Treatments |
Initial BW (g) |
Final BW (g) |
BWG (g) |
Feed intake (g) |
FCR1 |
Livability (%) |
Fecal scoring2 (at 34 d) |
|---|---|---|---|---|---|---|---|
|
Control |
43 |
2664 |
2622 |
3597 |
1.372 b |
98.7 |
2.75 |
|
Soon Soon |
43 |
2616 |
2574 |
3534 |
1.373 b |
100 |
2.25 |
|
Australia |
43 |
2599 |
2556 |
3572 |
1.397 a |
100 |
2.33 |
|
Dubai |
43 |
2608 |
2566 |
3573 |
1.393 a |
98.7 |
2.25 |
|
P-Value |
|
0.1393 |
0.1383 |
0.5432 |
0.0135 |
0.6098 |
0.2377 |
|
Pooled SEM |
|
19.894 |
19.849 |
30.367 |
0.006 |
0.936 |
0.191 |
|
C.V., % |
|
1.86 |
1.89 |
2.08 |
1.06 |
2.31 |
19.52 |
1 Feed conversion rate corrected for mortality and culls.
2 Fecal scoring was measured by scoring 1-5; where 1 = hard dry pellet, 2 = firm formed stool (not too dry), 3 = soft moist stool that retains shape, 4 = soft unformed stool that assumes shape of container (it has more moisture), 5 = watery liquid that can be poured.
The above results show that broilers fed with the diet containing Soon Soon canola meal performed significantly (p<0.05) better in feed conversion than those fed with diets containing Australian or Dubai canola meals and the results were similar to the control diet. There were no significant difference in BWG, feed intake, livability and fecal score among all the diets. The results indicate that Soon Soon canola meal has more nutrient availability probably as a result of better processing when compared to Australian and Dubai canola meals.
5. Potential of Australian soybeans in Asian food markets
The SE Asian region accounts for 25 per cent of the world's soy food consumption. Annually 3.5 million tonnes of food soybeans are used to produce tempe, tofu, soy milk etc. The main suppliers are Canada and USA. Australia has the potential to supply the top end of this market. Our own evaluation has shows that certain varieties of Australian soybeans can perform well in soy milk and tofu.
|
Product Category |
GM beans |
Non GM beans |
Total |
|---|---|---|---|
|
Tempe |
1,840,000 |
- |
1,840,000 |
|
Tofu |
700,000 |
40,000 |
740,000 |
|
Soy milk |
500,000 |
80,000 |
580,000 |
|
Other soy products( soysauce) |
200,000 |
- |
200,000 |
|
Bakery, processed meat, TSP |
- |
10,000 |
10,000 |
|
TOTAL |
3,240,000 |
130,000 |
3,370,000 |
Source: USDA and government data.
We evaluated the performance of Australian soybean against Canadian and US soybean in soy milk and tofu. Our conclusion is that Australian soybean can perform well in both products.
| |
Australian non GM |
Canadian GM |
Canadian IP non GM |
USA GMO |
|---|---|---|---|---|
|
Moisture, % |
10.8 |
12.9 |
11.7 |
11.5 |
|
Protein (dry basis),% |
40.5 |
41.1 |
42.1 |
40.3 |
|
Oil, % |
19.1 |
19.1 |
20.0 |
19.9 |
|
Water uptake factor |
2.16 |
2.10 |
2.12 |
2.1 |
|
Soy milk yield, g |
2890 |
2820 |
2892 |
2780 |
|
Tofu yield, g |
868.9 |
874.2 |
870.5 |
844.8 |
Figure 22. Soybeans from different origins.
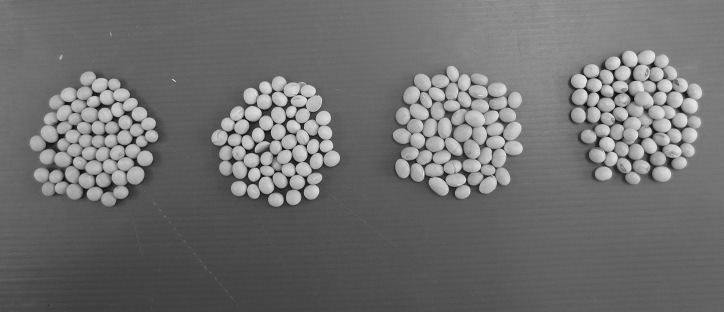
(left to right) Australian Non GM Canadian GM Canadian IP non GM US GM
Figure 23. Soy milk produced from different type of soybeans.
(left to right) Australian Non GM Canadian GM Canadian IP non GM US GM
5.1. Findings
Soy milk made from Australian non-GM soybean was more yellowish than the soybean milk from Canadian and USA soybeans. The taste is considered better than the US GM soybean milk but is not as good as Canadian identity preserved (IP) non-GM soybean milk.
Figure 24. Tofu produces from different types of soybean.
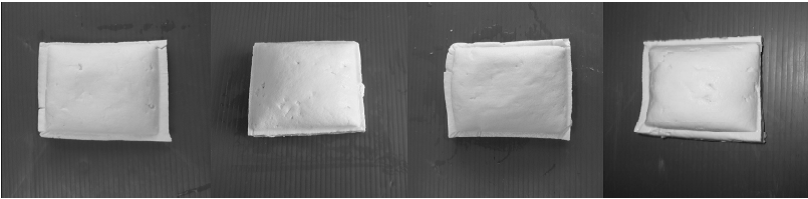
Australian Non GM Canadian GM Canadian IP non GM US GM
- Tofu made from all the soybeans were soft and smooth and were similar in quality;
- Tofu made from Canadian GM soybean has the highest yield (874g), followed by Canadian IP non-GM (870.5g), Australian non-GM and US GM soybean (844.8g); and
- Overall, Canadian soybean perform the best in soy milk and tofu, followed by Australian soybean and lastly US soybean.
Overall traits of a good quality food soybean:
- High protein;
- Size – large seed and uniform size;
- Hilum – clear and yellow cotyledon;
- Seed coat – thin and yellow;
- Soluble sugars – high soluble sugars for natural sweet taste; and
- Protein quality 11s:7s ratio.
6. Opportunities for the use of lupins in Asian foods and animal feeds
Recent initiatives by the WHO to reduce NCDs such as cardiovascular diseases, cancer, diabetes and chronic respiration disease by 25 per cent by 2025 has opened new opportunities to use lupin in Asian processed foods such as noodles, sausages, bread, biscuits etc.
Lupin flour has been proven in numerous researches to reduce post prandrial blood sugar levels when incorporated in bread. There are also evidences that it helps in the prevention of cardiovascular diseases. Our own research shows that lupin can be successfully incorporated into Asian food products with little change in taste and functionality.
6.1. World Health Organisation global noncommunicable diseases action plan 2013-2020 targets
Voluntary global targets.
1) A 25 per cent relative reduction in the overall mortality from cardiovascular diseases, cancer, diabetes, or chronic respiratory diseases;
2) At least 10 per cent relative reduction in the harmful use of alcohol, as appropriate, within the national context;
3) A 10 per cent relative reduction in prevalence of insufficient physical activity;
4) A 30 per cent relative reduction in mean population intake of salt/sodium;
5) A 30 per cent relative reduction in prevalence of current tobacco use in persons aged 15+ years;
6) A 25 per cent relative reduction in the prevalence of raised blood pressure or contain the prevalence of raised blood pressure, according to national circumstances;
7) Halt the rise in diabetes and obesity;
8) At least 50 per cent of eligible people receive drug therapy and counselling, including glycaemic control, to prevent heart attacks and strokes;
9) An 80 per cent availability of the affordable basic technologies and essential medicines, including generics, required to treat major noncommunicable diseases in both public and private facilities.
6.2. Use of Lupin flour and fibre in instant noodles
| |
Laboratory Instant noodle samples |
Commercial samples |
|||
|---|---|---|---|---|---|
|
Control |
Sample with 6.8% Lupin flour |
Sample with 6.7% lupin flour and 1.7% Lupin fibre |
Control |
Sample with 6.8% lupin flour |
|
|
Moisture, % |
3.8 |
4.2 |
4.1 |
2.5 |
2.4 |
|
Protein (dry basis), % |
10.3 |
12.5 |
12.1 |
11.1 |
12.7 |
|
Dietary Fibre (dry basis) , % |
4.3 |
7.1 |
8.8 |
3.6 |
6.4 |
|
Oil (dry basis), % |
18.5 |
17.8 |
17.9 |
13.6 |
15.5 |
Findings.
Instant noodles incorporating lupin flour and lupin fibre showed increased protein and dietary fibre content. The noodle appearance is more yellow when compare to control.
Figure 25. Laboratory test instant noodles sample.
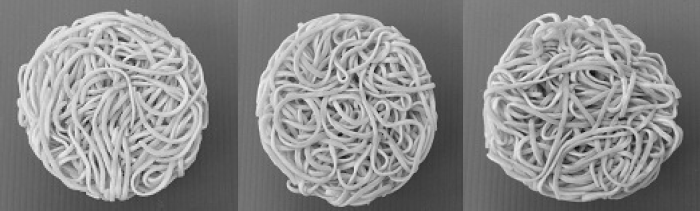
(left to right) Control 6.8% Lupin flour Incorporating 6.7% lupin flour and 1.6% Lupin fibre
Figure 26. Commercial instant noodles using lupin flour.
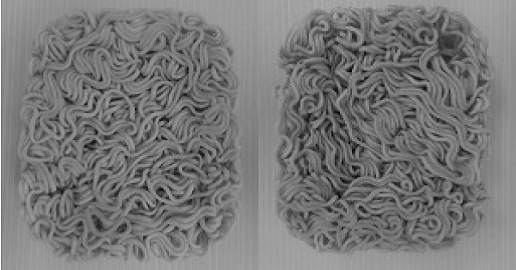
Control Incorporating 6.8% lupin flour
6.3. Use of lupin flour and lupin fibre in cracker
| |
Control |
Sample with 5.8% lupin flour and 1.5% lupin fibre |
|---|---|---|
|
Moisture, % |
2.8 |
3.1 |
|
Protein (dry basis), % |
12.3 |
12.7 |
|
Dietary fibre (dry basis), % |
3.1 |
7.0 |
Control (left) Incorporating 5.8% Lupin flour and 1.5% Lupin fibre (right)
Findings.
Cracker incorporating lupin flour and lupin fibre showed increased protein and dietary fibre content without significant changes in taste profile.
6.4. Use of lupin flour and lupin fibre in bread
| |
Control |
Sample with 7% Lupin flour |
|---|---|---|
|
Protein content, as is (%) |
11.2 |
16.7 |
|
Dietary fibre, as is (%) |
1.73 |
4.45 |
Control (left) Incorporating 7% lupin flour (right)
The benefits of adding Lupin flour in bread.
- Dietary fibre increased by 157 per cent;
- Protein increased by 49 per cent; and
- The bread can label as 'good source of fibre' because it contains 4.5 per cent of dietary fibre.
6.5. Summary
Sweetingham et al. has shown lupin can replace soybean in soy foods such as soy milk, tofu, tempe, miso etc. Our own research shows that lupin flour can increase the protein and dietary fibre content of instant noodle, cracker and bread. Supplementation of lupin flour and fibre can be recommended for producing healthier Asian food products.
In recent years, almost all soybeans grown in the USA and Argentine are genetically modified (GMO). There is much consumer resistance to GMO foods. Lupins are non-GMO and therefore it can be a cost effective non-GMO replacer for soybean.
6.6. Use of lupin in animal feedings
Lupin can be used as a protein source for animal feeding. Research done in Australia has shown that dehulled lupin meal can be a better protein source than soybean meal in aquaculture. Our own research shows that when properly processed, dehulled lupin meal can also be as good as or better than soybean meal in poultry and pig feeding.
Broiler trial.
Recently, we developed a new high fat product from lupin seed using a special processing method. This product is dehulled and co-processed with soy-lecithin to pre-emulsify its oil for enhancing its availability to animals, especially young animals like piglets and broiler chicks. This product has a total ether extract of around 16 per cent and protein content of 36 per cent. Its estimated nutrient matrixes are demonstrated in Table 11. This product can be used as protein and energy sources in animal feedings.
A broiler trial was conducted to investigate the effects of incorporating 5 to 15 per cent of this dehulled pre-emulsified full fat lupin meal in broiler diets using soybean meal as control. The trial was carried out at Bangkok Animal Research Centre in Thailand for a period of 34 days. A total of 384 day old male Arbor Acres Plus broiler chicks were used in this study. Chicks were assigned to four treatments with six replicates per treatment. The chicks were allocated equally over 24 pens at 16 chicks per pen. Four treatments diets were prepared with 0 per cent, 5 per cent, 10 per cent and 15 per cent of canola meal in both starter and grower diets. Starter diets were fed from day zero to day 16 and grower diets were fed from day 17 to day 34. At the end 34 days, body weight gain (BWG), feed intake (FI), feed conversion ratio (FCR), livability and fecal scores were calculated. The overall growth performances for 34 days of feedings are shown in Table 12.
|
Item |
FF Lupin meal |
|---|---|
|
Crude Protein, g/kg |
360 |
|
ME Poultry, MJ/kg |
13.6 |
|
Crude Fat, g/kg |
160 |
|
Crude Fibre, g/kg |
38 |
|
Digestible Lysine, g/kg |
16.12 |
|
Digestible Methionine, g/kg |
2.51 |
|
Digestible M+C, g/kg |
8.16 |
|
Digestible Tryptophan, g/kg |
2.29 |
|
Digestible Threonine, g/kg |
12.54 |
|
Digestible Arginine, g/kg |
38.39 |
|
Digestible Isoleucine, g/kg |
16.06 |
|
Digestible Valine, g/kg |
14.63 |
|
Treatment diets |
Initial BW (g) |
Final BW (g) |
BWG (g) |
FI (g) |
FCR1 |
Livability (%) |
Fecal score* |
|---|---|---|---|---|---|---|---|
|
Control |
44 |
2605 |
2561 |
3895 ab |
1.521 |
97.9 |
2.17 |
|
5% FF Lupin meal |
44 |
2578 |
2534 |
3845 b |
1.518 |
96.9 |
2.17 |
|
10% FF Lupin meal |
44 |
2657 |
2613 |
3976 a |
1.522 |
95.9 |
2.33 |
|
15% FF Lupin meal |
44 |
2593 |
2548 |
3832 b |
1.504 |
100.0 |
2.17 |
|
P-value |
|
0.2024 |
0.202 |
0.0221 |
0.3351 |
0.2113 |
- |
|
Pooled SEM |
|
26.24 |
26.266 |
31.513 |
0.008 |
1.36 |
- |
|
C.V.% |
|
2.46 |
2.51 |
1.99 |
1.24 |
3.41 |
- |
a,b Means within column with no common superscript differ significantly (P<0.05).
1 Feed conversion ratio corrected for mortality and culls.
*Fecal score: 1= Hard, 2= Soft, 3= Watery.
The results showed that there are no significant differences (p > 0.2) in BWG, FCR and livability for broilers fed the lupin meal diets at 5 per cent, 10 per cent and 15 per cent inclusion rates when compared to the control diet using soybean meal. Broilers fed with the 10 per cent lupin meal diet had the highest feed intake, which is significant higher than the 5 per cent and 15 per cent lupin meal diets, but there was no significant difference when compared to the control diet.
Numerically, the birds fed 10 per cent lupin meal had the highest body weight gain among all the diets. All treatment diets shown good livability (≥ 95%) and normal fecel scores. This demonstrated that dehulled pre-emulsified full fat lupin meal can be used at inclusion rate of up to 15 per cent in the broiler diets without any negative growth effects. High levels of lupin meal in the broiler diet are often restricted to avoid problems associated with excess moisture in the excreta (Robert J. van Barneveld, 1999). Most commercial broiler farms and feed mills in Australia use less than 10 per cent inclusion level in poultry diets. However, when using this dehulled pre-emulsified full fat lupin meal at 15 per cent in the diet there was no abnormal fecel conditions when compare to the control diet.
Pig trial.
Lupins can be used at higher level in pig diets without affecting feed intake and growth performances. Edwards and van Bernaveld (1998) reported a maximum recommended inclusion rate of L. angusfolius in pig diets to be 100 to 150 g/kg for weaner (up to 20 kg liveweight), 200 to 250 g/kg for grower (20 to 50 kg liveweight), and 300 to 350 g/kg for finisher (up to 100 kg liveweight).
The limitations of lupin meal are due to comparative deficiency of lysine, methionine and cysteine, Table 13 (Peterson 2000). When properly processed to maximise nutrient availability, lupin meal can be used to partially replace soybean meal in pig feeding. An experiment was carried out in a commercial pig farm in Malaysia to investigate the performance of grower pigs when fed a diet replacing 75 per cent of soybean meal with lupin meal. The experiment was conducted for a period 56 days. A total of 60 cross-bred grower pigs (Landrace x Large White x Duroc) were used in this study. They were penned in 20 pens with 3 pigs in each pen. The pigs were reared according to the normal farm practices.
|
Amino acids |
L. angufolius |
Soybean meal |
|---|---|---|
|
Lysine |
4.66 |
5.66 |
|
Methionine |
0.72 |
1.28 |
|
Tryptophan |
1.00 |
1.35 |
|
Arginine |
11.62 |
5.42 |
|
Threonine |
3.54 |
3.56 |
Table 14 shows the growth performances of grower pigs fed with soybean meal and lupin meal diets. The pigs fed the lupin meal diet had a lower (P<0.05) feed intake and better (P<0.05) feed conversion than those fed with the soybean meal diet. These results show that the pigs are able to utilise the feed more efficiently in the lupin meal diet compared to the soybean meal diet.
|
Treatments |
Soybean meal diet
|
Lupin meal diet |
|---|---|---|
|
Growth performance |
||
|
Initial body weight (kg) |
21.93±0.73a |
22.21±0.63a |
|
Average feed intake (kg/day/pig) |
1.59±0.06a |
1.36±0.05b |
|
Total live weight gain, g/day/pig |
571.43±16.18a |
563.90±17.15a |
|
Final body weight (kg) |
53.93±1.71a |
53.42±1.47a |
|
Feed conversion ratio |
2.79±0.10a |
2.41±0.09b |
Note. Results are presented as mean ± standard deviation. Values with different superscripts within rows differ significantly from each other at 95 per cent.
7. Conclusion and recommendations
Australian wheat is price competitive into SE Asia and usually performs well in Asian food products with the exception of sponge and dough bread making where North American spring wheat predominates. New varieties of APH such as Kidman and Gascoigne performed well in sponge and dough bread making but not better than North American spring wheat.
Increased production of Black Sea wheat is increasing its price competitiveness in SE Asia, where the lower protein varieties can replace APW/ASW and the higher protein varieties can replace AH in many Asian food products. With increasing export surpluses, Black Sea wheat has the potential to be a major competitor for Australian wheat in SE Asia.
Post deregulation has increased the sales of Australian wheat to SE Asia at the expense of the Middle East due to freight spreads favouring SE Asia. Container shipments have reached about 2 million tonnes per annum and the numbers of customers of Australian wheat have also increased significantly. However, the quality of Australian wheat, particularly in containerised shipments, has deteriorated with higher levels of admixture, large variations in quality from shipment to shipment and many shippers do not respect varietal integrity. Much of these problems are due to the lack of proper export quality inspection for containerised shipments.
In order to maintain the reputation of Australian wheat and its competitiveness, we recommend that a centralised export quality inspection service like the FGIS in USA and the Grain commission in Canada be set-up to inspect all Australian grain exports.
Another problem after deregulation is the lack of a centralised annual crop report. Buyers do not really know the quality of wheat in various regions of Australia. Therefore the reestablishment of an annual centralised crop report will help to promote Australian wheat. Finally it would be useful if there is a centralised research facility for customers to test Australian grains and oilseeds in their products and also allow Australian scientist to develop new varieties of wheat, soybeans and other grains to suit export customer requirements.
Other Australian grains and oilseeds such as lupin, soybeans and canola are potentially competitive in SE Asia. One quarter of the world’s soy food is produced in SE Asia. Our research has shown that certain Australian soybean varieties can perform well for soymilk and tofu. The recent announcement by the WHO of a programme to reduce NCDs by 25 per cent can encourage the use of lupins and soybeans in Asian food products as nutracetical supplements potentially capable of reducing the incidences of diabetes and cardiovascular diseases as well as increasing fibre and protein in foods.
Dehulled Lupins can also be use effectively as a protein supplement to replace imported soybean meal in poultry and swine feeding. With increasing canola oil and meal use in the region, Asian oilseed crushers are starting to crush canola. Australian canola is competitive but recent large Black Sea canola crop has resulted in low export prices from the region to SE Asia.
References
Edwards and van Bernaveld (1998). Lupin for livestock and fish. In Lupin as crop plants, Biology , Production and Utilization , pp385-411.
Petterson, D.S. and Mackintosh, J.B. (1994). The chemical composition and nutritive value of Australian grain legumes. Grains Research and Development Corporation, Canberra.
Peterson. D.S (2000). Asian-Aus Journal of Animal Science. Vol 13, No 6 : 861-882
Zdnuczyk, Z., Juskiewicz, J., Frejnagel, S., Flis, M. and Godycka, I. (1994). Chemical composition of the cotyledons and nutritional value of whole and hulled seeds of yellow lupin. Journal of Animal and Feed Sciences 3: 141-148.
Sweetingham, M.W., Lupin reflections and future possibilities. Proceeding 12th International Lupin Conference 2008
Contact details
Dr. Soon-Bin Neoh Soon Soon Group of Companies 2448, Lorong Perusahaan 2, Prai Industrial Estate, 13600 Prai, Penang, Malaysia 6-04-3828288 neohsb@soonsoongroup.com
Was this page helpful?
YOUR FEEDBACK