Barley nutrition and agronomy - do we need sulphur and nitrogen?
Author: Kenton Porker and Rob Wheeler | Date: 15 Aug 2013
Keywords: cereals, nitrogen, sulphur, nutrition, barley
Take home messages:
- Cereal requirement for S is much less than for canola.
- Nitrogen (N) responses are more common than sulphur (S) responses in Mallee cereals; therefore fertiliser expenditure should reflect this
- A balanced approach to nutrition for both S and N is required in the Mallee.
- Soil sampling at depth is critical for nutrient budgeting as S may be deficient in the top 10cm but adequate at depth.
- S requirements should be locally assessed on a paddock to paddock basis; consider fertiliser history, cropping rotation, product removal and soil test data.
- S deficient crops may be recovered by in-crop applications of sulfate of ammonia.
- S levels may be maintained by using S enriched fertiliser sources (i.e. gypsum).
Introduction: Why the interest in Sulphur?
Nitrogen (N) and phosphorus (P) are considered the two most limiting nutrients for cereal crop production in the Mallee. However, sulphur (S) supply is increasingly being questioned. Currently, more canola is being grown than in the past, and a shift to high analysis P fertiliser products containing less background S (i.e. DAP or MAP, ~1-2% S, as opposed to the previously used Single Super, ~11% S) has led to suggestions that S deficiency is becoming more widespread. As part of a GRDC funded Barley Agronomy project, a series of field trials were conducted throughout the Mallee in 2012 to assess barley growth and yield responses to S on sandy soils, with respect to rate, timing, and form of S.
Importance of Nitrogen and Sulphur
Both N and S help the formation of proteins within the plant. However, the relative crop demand for these nutrients differs. The average total N demand for cereal and canola crops is quite similar, but canola requires approximately twice the amount of S than cereals, making S particularly important for canola (Table 1). Cereals typically have a grain N:S ratio of 15:1 while canola has a grain N:S of 7:1. In cereals, lower S levels lead to lower protein, reduced flour quality, and can cause significant yield losses in deficient conditions. To date there is little information to support widespread yield responses to S in cereals in the Mallee, but there have been well documented cases of S yield responses in canola.
Table 1. Approximate Nitrogen and Sulphur requirements for cereal, pulse and canola crops. (nutrient kg/ha).
|
Crop |
Nitrogen |
Phosphorus |
Sulphur |
|
Wheat |
23 |
3 |
1.5 |
|
Barley |
20 |
3 |
1.4 |
|
Canola |
40 |
6.5 |
5 |
|
Peas |
37 |
4 |
2 |
N and S fertiliser decisions
The fundamentals of fertiliser management for both N and S are similar. N and S demand can be estimated through a budget approach. A deep soil test (10-60cm) can be used to estimate the soil N and S content at seeding. The critical factor in all budgeting equations is to first determine a target yield and protein, as crop yield potential is the driver of N and S requirement. Crop N demand can then be estimated using tools such as an N calculator, Yield Prophet® and relevant calculations that factor in soil, seasonal, and soil N mineralisation. The current recommendation for soil S testing is the KCL40 method which is taken in the top 0- 10cm. However, it is not uncommon for S to be located deeper in the profile. Plants take up S in the sulfate form, which is water soluble and mobile in the soil (like N) and readily leached. Sandy soils are generally lower in nutrients (N & S) and more prone to leaching from large rainfall events; hence the need for deep soil testing.
Sulphur responses in 2012
The 2012 trials in the Mallee demonstrated a general lack of S fertiliser response at most sites. Three out of four trials showed no response to S, despite the KCL40 (0-10cm) soil tests suggesting S levels were below the critical values (4-6 mg/kg) for cereal production (Peverill et al. 1999) at all sites (Table 2). Deep soil tests revealed sufficient S in the lower soil profile. This indicates that S is more accessible later in the season when roots explore the lower profile, and may explain the lack of S response at these sites.
Table 2. Top soil (0-10cm) and deep soil (10-60cm) S & N test results from 2012 Mallee trial sites, taken pre-sowing from each replicate (3 cores bulked x 3 reps).
|
Site |
pH Level (CaCl2) |
Depth |
Sulphur (KCL40) mg/kg |
Available Sulphur (kg/ha) |
Available N kg/ha (NO3, NH4) |
|
Lameroo |
7.8 |
0-10 |
2.9 |
3.48 |
|
|
8.1 |
10-60 |
2.2 |
13.2 |
38.7 |
|
|
Murrayville |
7.3 |
0-10 |
1.9 |
2.28 |
|
|
8.4 |
10-60 |
2.3 |
13.8 |
42 |
|
|
Paruna |
6.5 |
0-10 |
3.6 |
4.32 |
|
|
8.1 |
10-60 |
1.4 |
8.4 |
35.6 |
|
|
Karoonda |
7.3 |
0-10 |
1.8 |
2.16 |
|
|
8.3 |
10-60 |
17 |
102 |
36.6 |
Determining S requirement
These results are also supported by literature in suggesting that a 0 -10cm KCl-40 is not always an adequate measure of crop S supply, and that a total balanced approach similar to deep soil N testing maybe more informative. S testing can be done in conjunction with nitrate tests at a small additional cost.
S deficiency may not be as wide spread in the Mallee as first thought but rather limited to certain paddocks as demonstrated by the Lameroo site (Table 3). Concerned growers should conduct deep soil testing, tissue testing, or apply a test strip to more accurately diagnose potential S deficiency. S deficiency can be diagnosed in the field by general yellowing in the younger leaves, whereas the mobility of N within the plant means N deficiency is observed in the older leaves.
Table 3. Fertiliser effects on early vigour (NDVI GS30) and grain yield in Hindmarsh barley at Lameroo, Paruna, and Murrayville (2012). NS = not statistically significant
|
Treatment (kg/ha nutrient) |
Growth @ GS30 (NDVI) %Nil |
Grain Yield (t/ha) |
||||
|
Lameroo |
Paruna |
Murrayville |
Lameroo |
Paruna |
Murray-ville |
|
|
Nil |
100 |
100 |
100 |
2.13 c |
1.63 |
1.21 |
|
Gypsum (20kg S) |
103 |
105 |
96 |
2.14 c |
1.65 |
1.21 |
|
Urea (17.5kgN) |
123 |
125 |
116 |
2.70 b |
1.58 |
1.19 |
|
SoA (17.5kg N & 20kg S) |
123 |
123 |
112 |
2.96 a |
1.69 |
1.14 |
|
Urea (17.5kgN) & Gyp (20kgS) |
122 |
119 |
114 |
2.68 b |
1.54 |
1.08 |
|
LSD (5%) |
10.1 |
9.8 |
12.2 |
0.24 |
NS |
NS |
Nitrogen responses in 2012
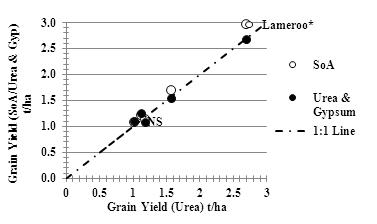
Overall, N was the key nutrient driving early growth responses at all sites (Table 3) in 2012, and therefore the N balance was more important than S. Similar yields were achieved from applying N as Urea alone, as SoA, or as a Urea and gypsum combination (Figure 1) at all sites, except at Lameroo where an additional response to combined N and S was found. The responses to N still depended on the deep soil N levels and seasonal site conditions.
Timing and form of N and S
The trial at Karoonda included additional treatments examining the effect of application timing of N and S. Timing or form of N or S did not significantly change the yield response to fertilisation (Table 4). This is consistent with many experiments in SA that have not found any consistent difference in the response to different forms of N fertiliser when applied at the same rate of N and timing. All yield responses to fertilisation could be explained by an N response, and not an S response. A similar response to N was achieved across all three application timings. This response is not uncommon in Mallee farming systems, as DAP/MAP will supply a proportion of the N requirement, and the ongoing crop demand for N can be assessed throughout the growing season to better match seasonal conditions (soil moisture) with N supply. N applied at seeding or early in the vegetative stage has been found to be generally more effective than delaying N application to stem elongation in lower yielding environments (<2.5t/ha). N applied later in the growing season will tend to influence grain protein rather than yield. Trial work suggests that 5-6 kg of nitrogen per tonne of grain per hectare will increase grain protein levels by one percent.
Table 4. Grain yield (t/ha), yield response (compared to Nil Fertilised Control), and grain quality data of Hindmarsh barley from Karoonda nutrition trial (2012). NS = not statistically significant (P>0.05).
|
Fertiliser Treatment |
Grain Yield (t/ha) |
Yield Response (t/ha) |
Protein (%db) |
|
Nil N Fertilised Control |
0.80 |
0.00 |
11.8 |
|
Nil N + Gypsum (20kg s) |
0.78 |
-0.02 |
11.1 |
|
Urea @Sow (17.5kg N) |
1.12 |
0.32 |
11.4 |
|
Urea +Gyp @Sow (17.5kg N & 20kg S) |
1.24 |
0.44 |
11.7 |
|
SoA @ Sow (17.5kg N & 20kg S) |
1.20 |
0.40 |
12.3 |
|
SoA @ 3 Leaf (17.5kg N & 20kg S) |
1.15 |
0.35 |
11.1 |
|
SoA @ GS22 (17.5kg N & 20kg S) |
1.38 |
0.58 |
12.2 |
|
LSD (5%) |
0.26 |
1.7 |
|
Conclusions
While not underestimating the importance of S, N was the main nutrient driving growth in these series of 2012 trials. N responses were more common than S responses in Mallee cereals; fertiliser expenditure may be better targeted towards correcting N deficiencies before S. Development of S deficiencies will depend on fertiliser history, crop rotation, and product removal and should be considered on a paddock-by-paddock basis within a long-term nutrition program. It is worth noting that S deficiency can be recovered by in-crop application of sulfate of ammonia, or avoided by a longer term strategy using alternate sources of S (Table 5.).
Table 5. Sulphur content of commonly used fertilisers
|
Fertiliser Form |
% Sulphur |
|
Superphosphate |
11 |
|
Sulfate of ammonia |
24 |
|
Agricultural gypsum |
16 to 18 |
|
Triple superphosphate (TSP) |
1.5 |
|
Di-ammonium phosphate (DAP) |
1.0 |
Given nutrition responses are largely driven by seasonal and site conditions, trials are being replicated in 2013. Nonetheless, the results highlight the importance of a balanced approach to nutrition and the need for soil sampling at depth in the Mallee for both S and N.
Contact details
Kenton Porker
SARDI, Waite Road, Urrbrae SA 5064
(08) 83039337 0403 617 501
http://www.sardi.sa.gov.au/crops/new_variety_agronomyWas this page helpful?
YOUR FEEDBACK