Break benefits on Mallee soils - the long and the short
Author: Rick Llewellyn, Therese McBeath, Bill Davoren, Vadakattu Gupta, Michael Moodie and Ben Jones | Date: 23 Jul 2013
Rick Llewellyn1, Therese McBeath, Bill Davoren, Vadakattu Gupta, Michael Moodie and Ben Jones,
1CSIRO, Waite Campus, Adelaide
GRDC project code: CSA00025
Keywords: break crops, rotation, crop sequence, nutrition, nitrogen, disease, pasture
Take home messages
- Break options including a low-cost volunteer medic-based pasture have led to wheat yield gains of over 0.7 t/ha on some soils and in some cases significant effects in the 3rd year after the break.
- Across a range of soil types, seasons and break types, breaks have led to a typical cumulative benefit of almost 1 t/ha of wheat.
- This relatively consistent level of benefit is likely to be the result of a changing range of physical, chemical and biological drivers that differ across soils, season and break types.
- Canola was shown to greatly reduce Rhizoctonia risk compared to other options.
- Pasture was shown to provide the highest N mineralization potential in the 2nd wheat crop.
- Although break yield effects were generally similar across the soil types, there are considerable differences in gross margin benefits due to the differences in break crop yields and the wheat yields that could have been achieved when the break option was grown.
- The ability to reduce the opportunity cost of growing break crops and taking advantage of potential for 2nd and 3rd year break effects are important for maximising the value from break options.
Background
Wheat is a relatively low risk crop but relying on continuous cropping can increase the vulnerability to weeds, disease and declining nutrition and lead to increased costs. The inclusion of break crops can address these issues, but in a low rainfall environment this often involves growing a crop that is riskier than cereal. Over the past 4 years several field trials in the Mallee have been looking closely at both the performance of break crops and their impact on the performance of subsequent wheat crops (e.g. Peoples et al 2013; Moodie et al 2013; Monks et al 2013). In this paper we focus on results from a range of soil types at Karoonda SA, where the impact of a range of break crops and a low-cost medic-based pasture have been evaluated over 3 subsequent wheat crops. The study highlights the importance of evaluating the benefits of break crops (or pasture) over several years, and recognises that there are often different drivers of the break effect (e.g. disease, nutrition, stored soil water) across different soil types and seasons.
Evaluating break crops
Trials were established at Karoonda SA (337mm average annual rainfall) over different soils ranging from heavy swale to deep sand dune. Single-year break crops were grown in 2010 and 2011 comprising legume (peas & lupins), canola, rye (grain & grain+ ‘graze’) and volunteer pasture on a paddock that had a cereal history of at least 4 years. Wheat was grown following break crops with 16 kg N/ha applied as Urea and 9 kg N/ha as DAP, all at seeding, in addition to P and S and micronutrients. Yields are shown in Table 1.
Table 1. Grain yields (t/ha) of the different crop types on each soil type in 2009-2012. Within a season, soil by crop type combinations appended by a different letter produced significantly different grain yield (p<0.05). n.b. Mid slope was split into Mid top and Mid-bottom in 2010.
|
|
Dune |
Mid-top |
Mid-top |
Swale |
|---|---|---|---|---|
|
|
2009 Grain yield (t/ha) |
|||
|
Rye |
1.78a |
1.86a 1.06cd 0.69de 1.94a |
0.81de |
|
|
Rye (cut) |
0.90de |
0.53e |
||
|
Peas |
0.59e |
0.69de |
||
|
Wheat |
1.77ab |
1.40bc |
||
|
LSD 0.38 |
|
|
||
|
|
2010 Grain yield (t/ha) |
|||
|
Canola |
1.87i |
1.14j |
1.35j |
2.04hi |
|
Rye |
3.10de |
2.88ef |
3.43cd |
3.36cde |
|
Rye (cut) |
2.39gh |
1.92hi |
2.39gh |
2.32ghi |
|
Lupins |
3.80bc |
4.00b |
3.27de |
2.55fg |
|
Wheat |
2.99def |
2.24ghi |
4.03b |
5.17a |
|
LSD 0.48 |
|
|
||
|
|
2011 Grain yield (t/ha) |
|||
|
Wheat |
3.60 |
2.17 |
3.47 |
3.75 |
|
|
2012 Grain yield (t/ha) |
|||
|
Wheat |
2.09 |
1.30 |
2.56 |
3.43 |
In 2010, the best break effect was following peas (+0.93 t/ha) and pasture (+0.83 t/ha) when averaged across all soils. In 2011 the first-year break effects followed a similar pattern (Figure 1). It is worth noting that in general, soil type was not found to be a statistically significant influence on the break effects.
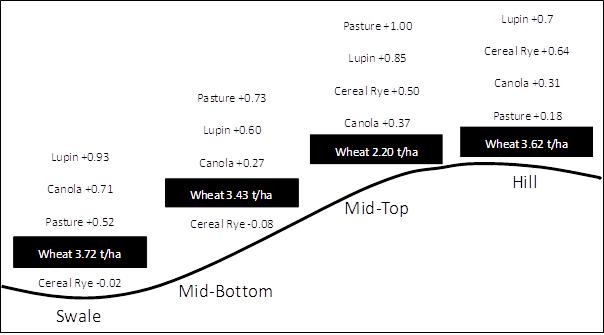
Figure 1. Yield gain in the 2011 wheat crops that followed various break crops grown in 2010 at Karoonda. Continuous wheat yields 2011 are shown in the black boxes. (LSD (p<0.05): Swale = 0.42 t/ha; Mid-Bottom = 0.41 t/ha; Mid-Top = 0.49 t/ha; Hill 0.53 t/ha).
Both peas and pasture caused a significant second year effect on wheat production in 2011. In 2012 there were some significant second year break effects with lupins, pasture and canola all leading to significant wheat yield gains compared to continuous wheat. Pasture grown in 2009 led to a statistically significant 3rd year break effect (in 2012).
The results show a consistent break effect (Figure 2) when following the approach of Angus et al. (2008).The size of the first, second and third year effects across all breaks (except cut rye) and all soils are shown in Figure 2. This shows that the benefits of breaks are relatively consistent in terms of the gains in wheat yield, irrespective of wheat crop yield, soil type or the range of break options. The cumulative effect of the breaks over 3 years are shown in Figure 3. It can be observed that a big yield boost in Year 1 after a break can sometimes come with reduced benefits in Year 2. The results so far show that the breaks have led to a total benefit of almost 1 t/ha of wheat over 3 years across the range of soils and break types.
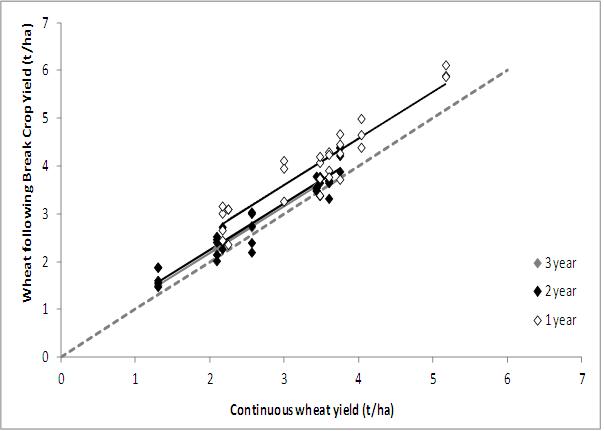
Figure 2. Wheat yield 1 year, 2 years and 3 years after break, showing benefit of breaks compared to continuous wheat (dotted 1:1 line). Data includes all break crops, soil types and years.
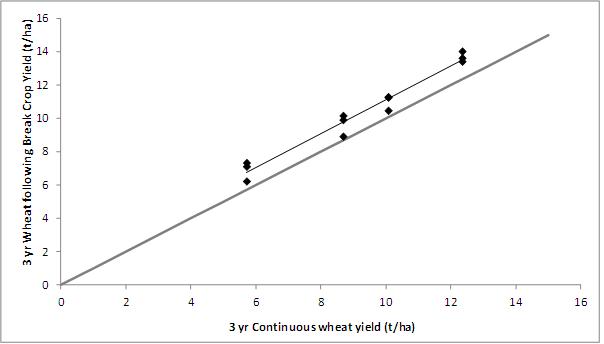
Figure 3. Cumulative yield of wheat over 3 years after breaks showing benefit of breaks compared to continuous wheat (1:1 line).
The drivers for the break effects vary across soils, break types and seasons. They included increased soil available N, higher available soil water levels at sowing following breaks and disease differences.
An example of potential disease risk reduction is shown in Figure 4. Cereal crops have promoted the build-up of Rhizoctonia inoculum, whereas canola reduced inoculum levels. Rizoctonia inoculum was lowest after the canola crop and highest after the wheat crop across all soils (Figure 4).
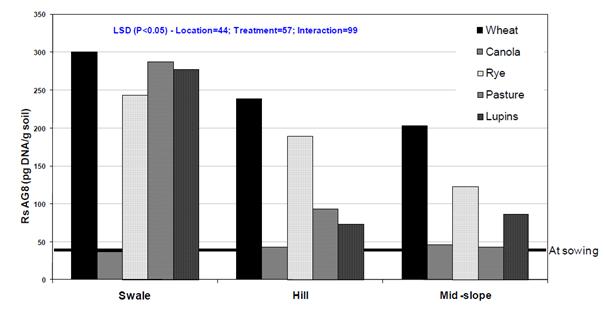
Figure 4. Rhizoctonia solani AG8 inoculum levels measured in 2011 following different crops grown in 2010 (Gupta et al. 2011 in collaboration with GRDC project CSP00150 – Managing Rhizoctonia disease risk in cereals).
The strong performance of the volunteer pasture, which had a medic base but wasn’t maintained grass free, is partly explained by the estimated N mineralisation potential shown in Figure 5. Soil that was under pasture in 2010 had significantly more potential to supply N to the 2012 crop than where break crops were grown in 2010.
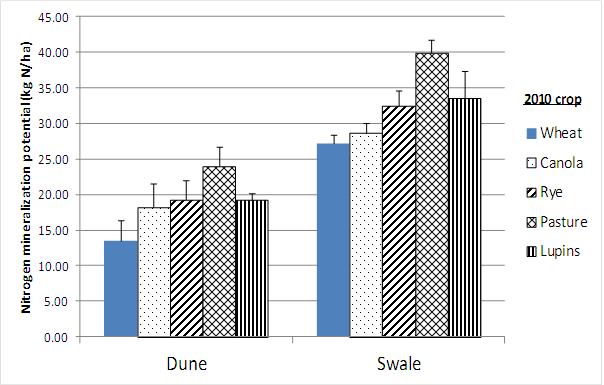
Figure 5. Effect of 2010 break crops on N mineralisation potential (estimate for decile 5 season) measured at time of sowing in 2012.
Finally, four year cumulative gross margins have been calculated for each soil type x crop sequence combination where breaks were grown in 2009 (Table 2). While the effects of break crops on wheat yield were generally similar across the soil types, there were considerable differences in relative gross margins due to the differences in the yields of the break crops and the wheat yields that could have been achieved when the break option was grown in 2009.
Table 2. Gains in cumulative gross margin from break crops compared with continuous wheat across different soil types.
|
|
Rotation |
|
|
Swale |
Mid-Bottom |
Mid-Top |
Hill |
|---|---|---|---|---|---|---|---|
|
2009 |
2010 |
2011 |
2012 |
$/ha |
$/ha |
$/ha |
$/ha |
|
peas |
wheat |
wheat |
wheat |
+283 |
+113 |
+52 |
+80 |
|
rye grain |
wheat |
wheat |
wheat |
+75 |
+62 |
+119 |
+112 |
|
rye grazed |
wheat |
wheat |
wheat |
+301 |
-133 |
+60 |
-217 |
|
pasture |
wheat |
wheat |
wheat |
+250 |
+74 |
+233 |
+191 |
N.b. Costs are calculated using the Rural Solutions Farm Gross Margin Guide, grain prices are 5 year average, pasture biomass valued at $35/t/ha. Gains (or losses) are presented relative to the cumulative gross margin for the 4 years of continuous wheat (swale $2989/ha, mid-bottom $2488/ha, mid-top $1267/ha and dune $2038/ha.
Where breaks were grown in the relatively poor yielding year of 2009, profitability over the 4-year sequence was generally higher than continuous wheat (Table 2). This was particularly the case on the swale, where wheat performed poorly in 2009. Breaks grown on the swale in 2010 were expected to be less profitable over the sequence as wheat would have been a highly profitable option compared to most breaks in that year.
Given the possibility of benefits in the third year following the breaks, the trial is continuing in 2013 in order to evaluate the longer-term profitability of break options grown in 2010.
Acknowledgements
Thanks to the Loller family for their generous support in hosting the trial and to Jeff Braun for advising on trial agronomy and evaluation. Funding for this work was from GRDC Water Use Efficiency (Projects CSA00025) and associated CSIRO Sustainable Agriculture and Mallee Sustainable Farming projects. Input from the Karoonda Mallee Sustainable Farming advisory group, Damian Mowat, Anthony Whitbread, Marcus Hicks and Stasia Kroker is gratefully acknowledged. Additional details can be found at www.msfp.org.au/research.php?page=compendiums
Contact details
Rick Llewellyn
08 8303 8502
rick.llewellyn@csiro.au
GRDC Project Code: CSA00025,
Was this page helpful?
YOUR FEEDBACK