Will low protein become the new norm?
Author: Rohan Brill (NSW DPI), Matthew Gardner (NSW DPI), Rick Graham (NSW DPI) and Neil Fettell (UNE) | Date: 25 Feb 2013
Take home messages
- Soil tests from throughout the region in 2012 indicate that soil mineral N contents were low in comparison to years prior to 2010, which may help explain why grain proteins were generally low in 2012.
- Mineral N contents were low primarily due to high rates of N removal (in grain) in the previous seasons. Denitrification may also have contributed to lower mineral N levels; however this is hard to clearly define.
- There has been a reduction in the number of paddocks tested for N in recent seasons and this may be contributing to poor nitrogen decisions.
- There were exceptions to the “11% protein rule of thumb” in 2012 where maximum grain yields were achieved at grain protein concentrations between 9-10%.
- N fertiliser recovery in grain was moderate at best in 2012 VSAP trials.
- Longreach Spitfire has been observed to have a grain protein concentration advantage over other varieties at a given yield level; however, the effect of variety choice on grain protein concentration is small compared with the effects of agronomic management.
- Based on a range of trials and varieties that had plus or minus crown rot treatments the impact of crown rot on grain protein concentrations was negligible.
- To ensure N does not become a major factor limiting yield, N supply needs to be enhanced using a combination of legume crops/pastures and tactical fertiliser N applications.
Introduction
The Northern grains region has traditionally produced wheat of a relatively high grain protein concentration; however, in recent seasons, those associated with the wheat supply chain from producers to end users have observed a reduction in grain protein concentration. Receivals of low protein wheat grades (less than 11.5 % protein) were greater than high protein grades for GrainCorp’s Dubbo Zone for the harvest of 2012/13, with low protein grades representing 60 % of total receivals (Table 1). The Dubbo Zone spans from Nyngan and Tottenham in the west, Coonamble in the north and to Birriwa (SE of Dunedoo) in the east.
Table 1. Wheat receival grades as a percentage of total wheat receivals (705000 tonnes) for GrainCorp’s Dubbo Zone for the harvest 2012/13
Grain Protein minimum | Proportion of wheat receivals | |
|---|---|---|
APH2 | 13 % | 10 % |
H2/AUH2 | 11.5 % | 30 % |
APW | 10.5 % | 23 % |
ASW/AGP1 | No limit | 37 % |
The N supply for crops in moderate to low rainfall areas comes mainly from decomposing organic matter and this is controlled by the amount of organic matter, the quality of the organic matter (carbon to nitrogen ratio, particle size, age), soil type and suitable temperature and moisture conditions for mineralisation. Fertiliser N usually accounts for a small proportion of total N supply but can still be crucial for achieving desired yield and protein targets.
Soil mineral N reserves
The low protein levels observed in 2011 were largely the result of low soil nitrogen supply. This observation is supported by the results from pre-sowing soil testing (Figure 1), where 64% of samples tested in north-central NSW had less than 60 kg of mineral nitrogen to a depth of 60 cm and only 10% had more 100 kg. While these numbers may not be truly indicative of all cropping paddocks (e.g. those thought to be high are less likely to be tested) they do show that many were low in mineral nitrogen. The dry winter and spring conditions in much of the region are likely to have inhibited in-crop mineralisation, further restricting soil nitrogen supply.
")
Figure 1: Frequency distribution of soil mineral nitrogen test values for 520 sites in north-central NSW in 2012. Sampling depths varied so values have been adjusted to estimate a 0-60 cm soil layer. (Data courtesy of Jim Laycock, Incitec Pivot Ltd)
Since 2010 there has been a distinct shift in the distribution of soil mineral N contents in the eastern states. Compared to 2005 the percentage of samples testing less than 30 kg N/ha has doubled while those exceeding 120 kg N/ha has dropped from more than 20% to less than 5%. Similarly the proportion of soil mineral contents between 60 and 120 kg N/ha has reduced from 40% to less than 20%. Apart from the soil mineral N results, Table 2 also indicates a significant drop in sample number, which may suggest that soil testing practices have declined. The decline in soil mineral N along the eastern wheat belt might partly result from changing sample numbers and locations; however it is still likely that there has been a major drop in soil nitrogen supply. This shift in soil mineral N observed from the IPL soil testing has coincided with a general decline in grain protein, particularly in northern NSW.
Table 2: Distribution (%) of soil mineral nitrogen contents (0-60, 10-60, or 0-100 cm depth) across Qld, NSW and Vic, 2005 to 2012. Data courtesy of Jim Laycock, Incitec Pivot Ltd.
Mineral N | Crop year | ||||
|---|---|---|---|---|---|
(kg N/ha) | 2005 | 2008 | 2010 | 2011 | 2012 |
<30 | 21 | 19 | 13 | 38 | 42 |
30-60 | 17 | 20 | 26 | 33 | 39 |
60-120 | 40 | 31 | 40 | 24 | 16 |
>120 | 22 | 30 | 21 | 5 | 3 |
Sample no. | 5506 | 3669 | 2001 | 2146 | 2316 |
Rotation effects on mineral N
There may be a range of factors that have contributed to the lower soil mineral N including high 2010/11 grain yields, low residual nitrogen contribution from pulse crops, denitrification, depletion of deep N or organic reserves and insufficient fertiliser inputs. The 2010/11 seasons received above average rainfall throughout the entire region that created ideal conditions for high yielding winter and summer crops. It was not uncommon for winter cereals to be yielding in excess of 5-6 t/ha west of the Newell highway under dryland conditions. If these crops were achieving 11% protein then they were removing more than 110 kg N/ha in grain. These seasons also represented large yielding years for sorghum that would have removed similar quantities of N/ha as winter cereal crops. Pulse crops were also high yielding with chickpea yields exceeding 3-3.5 t/ha. In 2010 pulse crops had large crop biomass which would have contributed to soil N through N2 fixation, however pulse area was less than 20 % of the total crop area. Pulse area decreased in 2011, then with a dry start to the season followed by a wet finish many pulse crops had a high harvest index, effectively removing (as grain) the majority of N they fixed. Schwenke et al. (1998) report on a survey conducted in Northern NSW in the 1990’s, finding that the net residual nitrogen benefit of chickpeas was on average close to 0 kg/ha, while for faba beans the net benefit was on average 42 kg/ha.
In a trial at Trangie Agricultural Research Centre over two seasons (2011 and 2012) the grain yield and grain protein concentration of EGA Gregory![]() wheat following chickpeas was similar to wheat following canola that was fertilised with 46 kg/ha N. The application of 46 kg/ha N in June 2012 to the wheat significantly increased the 2012 wheat yield by 400 kg/ha and 1.4 % protein regardless of previous crop (Figure 2).
wheat following chickpeas was similar to wheat following canola that was fertilised with 46 kg/ha N. The application of 46 kg/ha N in June 2012 to the wheat significantly increased the 2012 wheat yield by 400 kg/ha and 1.4 % protein regardless of previous crop (Figure 2).
 sown over two different 2011 crops (chickpea and canola) at Trangie in 2012. l.s.d. (p = 0.05): Grain yield = 0.11 t/ha, grain protein = 0.19 %")
Figure 2: Grain yield of wheat with two nitrogen rates (0 and 46 kg/ha) sown over two different 2011 crops (chickpea and canola) at Trangie in 2012. l.s.d. (p = 0.05): Grain yield = 0.11 t/ha, grain protein = 0.19 %
In land adjacent to the above mentioned trials, three varieties of wheat were sown over a 2011 chickpea time of sowing trial and over a 2011 faba bean time of sowing trial. The average yield of the three wheat varieties was 400 kg/ha more where sown over the 2011 faba bean trial than where sown over the 2011 chickpea trial. There was also a 1.2 % grain protein advantage where the previous crop was faba beans compared to chickpeas.
The effect of crop sequence was clearly demonstrated in a trial at Condobolin in 2012 (Table 3). Mineral nitrogen values at sowing varied from 60 kg/ha after successive cereal crops up to 120 kg/ha after lucerne, and as well as higher yields this was reflected in a protein increase from 8.4% up to 13.4%. The pea brown manure treatment (sprayed out in September) gave high yield and protein and is of interest to some growers particularly where annual grass weeds are also a problem.
Table 3: Crop sequence effects on soil mineral nitrogen at sowing and subsequent barley grain yield, protein and grain nitrogen recovery at Condobolin, 2012.
Crop sequence | Soil mineral N | Grain yield | Grain protein | Grain N content | ||
|---|---|---|---|---|---|---|
2009 | 2010 | 2011 | (kgN/ha, 0-60) | (t/ha) | (%) | (kgN/ha) |
Pea | Wheat | Barley | 56 | 2.67 | 8.4 | 36.1 |
Wheat | Barley | Barley | 64 | 3.25 | 8.9 | 46.3 |
Lucerne/Fallow | Wheat | Barley | 76 | 2.77 | 9.1 | 40.4 |
Wheat | Pea | Wheat | 77 | 3.46 | 10.7 | 59.1 |
Lucerne/Fallow | Wheat | Pea | 82 | 3.41 | 10.7 | 58.2 |
Barley | Pea | Barley | 83 | 3.24 | 10.3 | 53.7 |
Pea | Wheat | Lupin (poor) | 101 | 3.07 | 11.8 | 58.2 |
Lucerne | Lucerne/Fallow | Wheat | 117 | 3.27 | 11.8 | 61.8 |
Wheat | Barley | Pea brown manure | 121 | 3.21 | 12.8 | 65.4 |
Lucerne | Lucerne | Lucerne/Fallow | 126 | 3.23 | 13.4 | 69.0 |
F pr. | <.001 | 0.004 | <.001 | <.001 | ||
LSD | 35 | 0.39 | 1.5 | 11.4 | ||
Effect of denitrification on mineral N reserves
During 2010 and the 2011/12 winter fallow period a number of paddocks throughout the northern grains region were inundated with water, essentially creating ideal conditions for N loss via denitrification with these soils being warm and anaerobic. Biological denitrification is where plant available nitrate N is converted to a gaseous form and enters the atmosphere as either nitrous oxide (N2O) or dinitrogen (N2). Once in the gaseous form the N is lost from the system and cannot be recovered by plants. Reports of N losses from denitrification range anywhere from 5 - 250 kg N/ha in heavy clay cropping soils depending on environmental conditions and nitrate available in the soil profile. Measurements on classical crop production systems (non irrigated) show maximum N losses in the temperate climate of about 20–30 kg N/ha during the growth period of annual crops (Weier et al. 1996). Some local data produced by nitrous oxide emission study at Tamworth indicated that the denitrification process was rapid occurring within a 48-72 period of the onset of anaerobic conditions (Schwenke et al. 2012). In this study key denitrification events were identified immediately following planting of wheat in July 2010 and sorghum in October in 2010. Shortly following planting of the wheat and sorghum 68 and 60 mm of rainfall was received on the individual sites, which initiated high emissions of N2O immediately. It should be noted that the soil was already moist prior to rainfall events and rainfall did not cause inundation. Based on the N2O emissions it was estimated that denitrification losses from applied N (80 and 40 kg N/ha for the wheat and sorghum, respectively) were between 9 and 14 kg N/ha for both situations. These losses are in the order of a 12 -25% loss of applied N. Undoubtedly there will be large variation in the quantity of N lost to denitrification between regions and paddocks in the 2012 season, however, this does highlight the need to soil test in paddocks that were suspected of having denitrification losses in 2012 to give an indication what is available for the 2013 winter crop.
Removal of N in grain
The inherently fertile nature of soils throughout the northern grains region has provided a basis of good crop yields and protein achievement with minimal fertiliser inputs. A 20-30 year history of minor fertiliser inputs has mined the natural resource base in the soil including the organic N content. This organic N provides the basis for mineralisation in addition to the crop residues that are cycled near the soil surface. Over the years there has been little response to fertiliser application (especially in western regions) as the organic N supply has been sufficient to meet crop demands. However, with their continual depletion their has been a reduced ability of soil N reserves to fill the gap between moisture yield potential and N yield potential. Therefore, the last few seasons of low grain protein may be an indication that soil N supplies will need to be boosted by a combination of legume crops or pastures combined with applications of N fertiliser to meet yield and protein targets.
Above are some plausible reasons that may have contributed to the current trend of declining soil mineral N contents over the past 3 years. They also provide a reason to get a soil test of paddocks that have performed poorly or were at risk of losses from denitrification in the past couple of seasons. This is not a recommendation to test every paddock but rather a number of representative paddocks so that a re-evaluation of soil mineral contents can be made. Once a starting N point is established in paddocks where it was previously unknown, simple budgeting tools can be used to estimate N additions and losses. Targeting yield or protein without a starting N value, or a ballpark figure at least, ensures that there is a large possibility of either undersupplying or oversupplying N to the crop, both of which can reduce the return on cropping investments.
Crown rot and grain protein
There has been some speculation throughout the region that crown rot was responsible for low grain protein and poor N use efficiency. In Table 4 there are a collection of trials from throughout the Northern grains region that included bread wheats and durum varieties (Bellata and Weemalah) or a combination of barley, durum and bread wheat varieties. A plus or minus crown rot treatment for each variety was implemented where the plus treatment had durum seed colonised by five different isolates of Fusarium pseudograminearum sown with the plot seed. The plot seed and inoculated seed were thoroughly mixed prior to sowing to ensure even infection across the plots. The plus or minus crown rot treatments had no significant impact on grain protein when averaged across all varieties within each trial despite the plus crown rot treatment reducing grain yield at Weemelah and Coonamble in 2009 and 2011. At the Coonamble 2011 site crown rot infection reduced grain yield by 0.7 t/ha without changing protein content, therefore, in this scenario crown rot has limited the quantity of N removed/ha. Yield loss from crown rot is related to moisture stress post anthesis. Under conditions of moisture stress, the crown rot fungus restricts water movement from the roots through the stems, producing whiteheads that contain either no grain or lightweight, shrivelled grain. This restriction of water movement within the plant also restricts the movement of N within the plant, which may limit the potential to accumulate protein in the grain even when adequate N is present in the plant.
Table 4: Average grain yield (t/ha) and grain protein concentration (%) of five trials including wheat, durum and barley varieties that had a plus or minus crown rot treatment applied.
Site | Year | Varieties | Protein (%) | Yield (t/ha) | ||
|---|---|---|---|---|---|---|
Plus CR | Minus CR | Plus CR | Minus CR | |||
Bellata | 2012 | 18 | 10.9 | 10.8 | 3.8 | 3.9 |
Weemalah | 2012 | 18 | 9.7 | 9.5 | 3.0 | 3.2 |
Coonamble | 2011 | 18 | 14.2 | 14.2 | 2.6 | 3.3 |
Mungindi | 2011 | 18 | 10.8 | 10.7 | 3.8 | 3.9 |
Coonamble | 2009 | 16 | 12.9 | 13.0 | 3.0 | 3.3 |
Optimising N supply
Optimising N supply is difficult in western regions given the highly variable seasons. Excessive application of N may increase water use by enhancing early vegetative growth leading to greater water stress during flowering and grain fill, resulting in poor grain set or shrivelled grain. This was the case in a VSAP trial at Coonamble in 2012, where increasing the rate of N applied at sowing from nil to 100 kg/ha significantly increased the average dry matter production of eight wheat varieties at anthesis (GS65) by greater than 1.5 t/ha. For dry matter measured at maturity (GS99), there was a significant increase for the 25 kg/ha N rate compared with the nil rate, with no further increase in dry matter from increased N applications above 25 kg N/ha. At the highest N application rate, there was only a small dry matter gain in the period from anthesis to maturity. The excessive N application had led to the water supply to the crop being exhausted by anthesis, so the wheat plants were forced to rely on stored assimilate for grain fill. In the case of this trial at Coonamble, stored resources were not enough to meet the yield potential of the crop, resulting in a yield reduction compared with where lower N rates were applied. Averaged across the eight varieties, the 100kg/ha N rate led to a significant yield reduction of 250 kg/ha compared with the nil N rate (Figure 2).
 and maturity (GS99) and grain yield (t/ha) of eight wheat varieties, sown with 0, 25, 50 and 100 kg/ha N. l.s.d. (p = 0.05): DM GS65 = 0.44 t/ha, DM GS 99 = 0.42 t/ha, Grain yield = 0.11 t/ha")
Figure 3: Average dry matter at anthesis (GS65) and maturity (GS99) and grain yield (t/ha) of eight wheat varieties, sown with 0, 25, 50 and 100 kg/ha N. l.s.d. (p = 0.05): DM GS65 = 0.44 t/ha, DM GS 99 = 0.42 t/ha, Grain yield = 0.11 t/ha
11 % protein ‘rule of thumb’
With the application of N, yield will generally increase to a maximum level, whereas protein may continue to increase beyond this level with further N application. This was shown in a trial at Parkes in 2011, where wheat yield responses to N application diminished where N was applied at 30 kg/ha increments. Yield was maximised at 90 kg N/ha. Protein increased linearly for each 30 kg/ha increment up to 120 kg/ha N. In this trial, yield appeared to be maximised at a grain protein concentration of 11.2 % (Figure 4). The figure of 11 % protein has generally been considered a ‘rule of thumb’ for where the yield of wheat is maximised.
 and protein concentration (%) from 10 wheat varieties with 0, 30, 60, 90 and 120 kg/ha applied nitrogen in a trial at Parkes in 2011.")
Figure 4: Grain yield (t/ha) and protein concentration (%) from 10 wheat varieties with 0, 30, 60, 90 and 120 kg/ha applied nitrogen in a trial at Parkes in 2011.
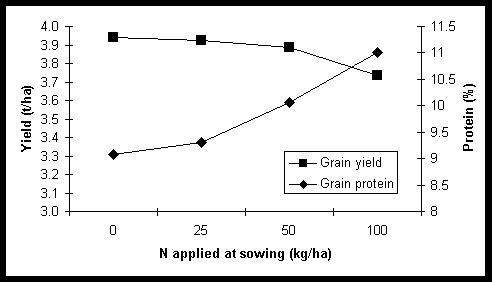
Going against the 11 % protein ‘rule of thumb’, there were situations in 2012 where yield was maximised at a lower grain protein level. At Coonamble, grain yield of eight wheat varieties was maximised at a grain protein concentration of 9 % (Figure 5a), with 100 kg/ha N required to raise grain protein by 2 % but also reduce yield by 250 kg/ha. At Moree, grain yield of four wheat varieties was maximised at a grain protein concentration of 9.7 % (Figure 5b) and it took a further 80 kg N/ha to shift protein from 9.7 to 11.7%. The reasons for this defiance of the 11 % protein ‘rule of thumb’ are not clearly understood and require further investigation.
a)
b)
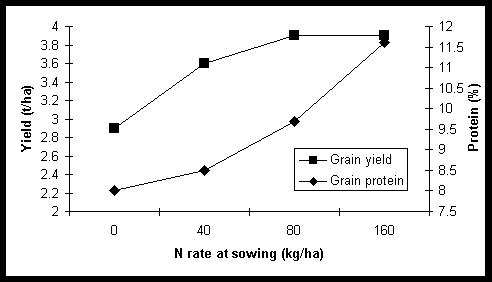
Figure 5: a) Grain yield (t/ha) and protein concentration (%) of eight wheat varieties with 0, 25, 50 and 100 kg N /ha in a trial at Coonamble in 2012. l.s.d. (p = 0.05): Grain yield = 0.11 t/ha, Grain protein = 0.43 %; b) Grain yield (t/ha) and protein concentration (%) of four wheat varieties with 0, 40, 80 and 160 kg/ha N in a trial at Moree in 2012. L.s.d. (p = 0.05): Grain yield = 0.28 t/ha, Grain protein = 0.32 %
Apparent recovery of N fertiliser
Apparent fertiliser N recovery provides a measure of the yield and protein benefit as a result of N application. Recovery is determined by calculating the additional N removed in grain above the nil N rate, divided by the quantity of N applied and is expressed here as a %. This calculation does not represent total nitrogen use efficiency, which relates to soil N supply and mineralisation as well as N fertiliser applications.
There were six VSAP Nitrogen trials planted across the northern grains region in 2012. As the rate of applied nitrogen increased, the efficiency of applied N decreased. The efficiency of applied N ranged from moderate (with the exception of Coonamble) at the low N applications to low (with the exception of Trangie and Moree) at the high N applications (Table 5). Lack of in-crop rain may have reduced the uptake of applied nitrogen; however seasons that start with a good profile of moisture then follow with low in-crop rain are common in the northern region.
Table 5: Apparent nitrogen use efficiency of wheat varieties in trials in the northern region in 2012
Apparent N efficiency (%) | |||||
|---|---|---|---|---|---|
| Deep N (kg/ha) | N rate | 25 | 50 | 100 |
Trangie | 50 (0-90 cm) | 42.5 | 38.3 | 34.2 | |
Coonamble | 53 (0-90 cm) | 4.8 | 9.0 | 3.5 | |
N rate | 40 | 80 | |||
Gilgandra | 44 (0-60 cm) | 36.3 | 8.6 | ||
Wongarbon | 14 (0-60 cm) | 26.2 | 7.6 | ||
N rate | 40 | 80 | 160 | ||
Moree | 51 (0-120 cm) | 31.9 | 31.5 | 23.8 | |
Spring Ridge | 85 (0-120 cm) | 36.1 | 17.5 | 6.5 | |
In each of the trials the middle N rates were split into two application timings; seedbed + stem elongation or seedbed + anthesis or both. On average, total N recovery was less with the later applications of N than where all N was applied at sowing. The only exception was at Spring Ridge, where splitting the 80 kg/ha N rate into 40 kg/ha at sowing followed by 40 kg/ha at stem elongation resulted in higher yield for EGA Gregory![]() and Suntop
and Suntop![]() (and hence greater N uptake) compared to where 80 kg/ha of N was applied at sowing. Across all trials in 2012 there was no significant increase in grain protein concentration from delaying some nitrogen to either stem elongation or anthesis. The lack of protein response to an anthesis application of N is most likely due to the lack of rainfall after that application to facilitate uptake, combined with the inherently inefficient nature of increasing grain protein from late fertiliser applications. The 2012 season highlights the difficultly of relying on in crop N application in the northern grains region where in crop rain is highly variable.
(and hence greater N uptake) compared to where 80 kg/ha of N was applied at sowing. Across all trials in 2012 there was no significant increase in grain protein concentration from delaying some nitrogen to either stem elongation or anthesis. The lack of protein response to an anthesis application of N is most likely due to the lack of rainfall after that application to facilitate uptake, combined with the inherently inefficient nature of increasing grain protein from late fertiliser applications. The 2012 season highlights the difficultly of relying on in crop N application in the northern grains region where in crop rain is highly variable.
Economics of N application
Based on the six northern VSAP nitrogen trials mentioned previously, the return on investment (ROI) of nitrogen application in 2012 was at best moderate. The ROI is calculated as the profit as a result of N application relative to the cost of the N application. ROI was greatest at low N rates, decreasing with increasing rates of N application at all sites. For all N application rates of 50 kg/ha or less, the average ROI was 93 % (Table 6). For N application rates of 80-100 kg/ha ROI was on average 48 %. While this may seem an acceptable ROI depending on your attitude to risk, it contrasts with an estimated ROI of fallow spraying at Dubbo of 876 % (Hunt and Kirkegaard 2011).
Table 6: Return on investment (%) of nitrogen application in six trials in the northern grains region in 2012
| R.O.I. (%) | ||
|---|---|---|---|
N rate | 25 kg/ha | 50 kg/ha | 100 kg/ha |
Trangie | 302 | 188 | 128 |
Coonamble | -159 | -144 | -95 |
N rate | 40 kg/ha | 80 kg/ha | |
Gilgandra | 208 | 82 | |
Wongarbon | 116 | 26 | |
N rate | 40 kg/ha | 80 kg/ha | 160 kg/ha |
Moree | 151 | 80 | 35 |
Spring Ridge | 69 | 69 | -5 |
Variety choice for grain protein concentration
The effect of legumes and fertiliser are the two most important factors in N management for grain protein; however there does appear to be some difference among common wheat varieties for grain protein concentration for a given yield level.
There were four common wheat varieties planted in each of the six VSAP nitrogen trials; EGA Gregory, Suntop, Longreach Spitfire and Livingston. Averaged across all nitrogen rates, EGA Gregory and Suntop were the highest yielding varieties and Longreach Spitfire had the highest grain protein concentration (Table 7). This higher grain protein concentration of Longreach Spitfire is partly due to the negative correlation between grain yield and grain protein concentration; however where Longreach Spitfire had similar yield levels as EGA Gregory (Coonamble and Moree) it also had a grain protein concentration of at least 1 % more than EGA Gregory. Suntop performed relatively well for grain yield, but did not display a grain protein advantage over EGA Gregory.
The protein advantage of Longreach Spitfire on average was 1% greater than the other varieties, which is consistent with previous findings. The expression of this protein advantage appeared to be greater under high N conditions where the difference between Longreach Spitfire and EGA Gregory was 2.3%, whereas at the low soil mineral N site, Wongarbon the protein advantage was 1.1 % over EGA Gregory.
Table 7: Grain yield (t/ha) and grain protein concentration (%) of four wheat varieties averaged across varying nitrogen rates in six VSAP nitrogen trials in 2012
EGA Gregory | Suntop | LR Spitfire | Livingston | |||||
Grain yield (t/ha) | Grain protein (%) | Grain yield (t/ha) | Grain protein (%) | Grain yield (t/ha) | Grain protein (%) | Grain yield (t/ha) | Grain protein (%) | |
Trangie | 2.6 | 8.8 | 2.3 | 9.2 | 2.3 | 9.6 | 2.3 | 9.5 |
Coonamble | 3.9 | 9.4 | 4.4 | 9.7 | 3.9 | 10.9 | 3.7 | 9.2 |
Gilgandra | 4.4 | 10.0 | 3.6 | 10.3 | 3.7 | 11.4 | 3.7 | 10.7 |
Wongarbon | 2.7 | 8.0 | 2.6 | 8.7 | 2.3 | 9.1 | 2.5 | 9.0 |
Moree | 3.7 | 9.0 | 3.8 | 9.2 | 3.7 | 10.0 | 3.6 | 9.4 |
Spring Ridge | 4.6 | 14.0 | 4.7 | 14.2 | 4.3 | 16.3 | 4.6 | 14.6 |
Average | 3.7 | 9.9 | 3.6 | 10.2 | 3.4 | 11.2 | 3.4 | 10.4 |
Conclusion
The 2010, 2011 and 2012 wheat crops as a whole have all been considered low protein years much to the frustration of growers. These low protein concentrations have occurred in conjunction with declining soil mineral N contents, where for the north-central region in 2012 nearly two thirds of soil had a mineral N content less than 60 kg N/ha in the 0-60 cm depth interval. This trend of low soil mineral N contents extends beyond the local region to along the entire eastern grains belt, where the number of soil tests with <30 kg N/ha in the 0-60 cm zone has increased from 20 to 40%. There are a number of possible reasons for the decline in soil mineral N contents; however, without periodic or strategic soil testing it is difficult to make economic decisions on crop nutrition. Enhancing soil nitrogen levels in order to increase grain yield and grain protein concentration can be done through growing leguminous crops or pastures, or through the application of nitrogenous fertilisers. The N recovery in the grain of wheat as a proportion of the amount of N applied may be low in the northern region as in-crop rainfall is often low. Increasing N rates reduces N use efficiency further. The tactical use of N fertilisers will continue to supplement the supply of N from the soil; however the most sustainable and low risk way of increasing soil N appears to be through planting leguminous crops and pastures.
There may be a small protein advantage in planting varieties that achieve higher grain protein concentrations for a given yield level; such as has been shown with Longreach Spitfire![]() . However variety choice only plays a small part in long term management of soil N.
. However variety choice only plays a small part in long term management of soil N.
References
Hunt J and Kirkegaard J (2011) Re-evaluating the contribution of summer fallow rain to wheat yield in southern Australia. Crop and Pasture Science 62, 915-929.
Schwenke G, People M, Turner G and Herridge D (1998) Dows nitrogen fixation of commercial, dryland chickpea and faba bean crops in north-west New South Wales maintain or enhance soil nitrogen? Australian Journal of Experimental Agriculture 38, 61-70.
Schwenke, G, Herridge, D, McMullen, K and Haigh, B (2012) Legumes in crop rotations reduce nitrous oxide emissions compared to fertilised non-legume rotations. Conference Proceedings ‘International Symposium on Managing Soils for Food Security and Climate Change Adaptation and Mitigation’, Vienna, 23-27 July.
Weier K, McEwan C, Vallis I, Catchpoole V, Myers R (1996) Potential for biological denitrification of fertiliser nitrogen in sugarcane soils. Australian Journal of Agricultural Research 47, 67-79.
Acknowledgements
All growers that provided trial sites and assistance throughout the season are much acknowledged. The technical assistance of Jayne Jenkins, Robert Pither, Rod Bambach, Stephen Morphett, Jim Perfrement, Patrick Mortell, Jan Hosking, Nick Moody and Katrina McDougall in the conduct of these trials is gratefully appreciated.
Thanks also to GrainCorp and Incitec Pivot for supply of information to support this paper.
Contact details
Rohan Brill
NSW Department of Primary Industries
Ph: 02 68 221000
Email: rohan.brill@dpi.nsw.gov.au
![]() Varieties displaying this symbol beside them are protected under the Plant Breeders Rights Act 1994.
Varieties displaying this symbol beside them are protected under the Plant Breeders Rights Act 1994.
GRDC Project Code: DAN00169; DAN00138,
Was this page helpful?
YOUR FEEDBACK