Sulfur strategy to improve profitability in canola in the central west of NSW
Author: Maurie Street, Grain Orana Alliance (GOA) | Date: 26 Feb 2013
Maurie Street
Grain Orana Alliance (GOA)
Take home message
- Three years of trialling by GOA has failed to consistently demonstrate a response to the addition of sulfur in yield or oil
- Numerous recent trials by other organisations have also failed to demonstrate responses to sulfur in canola
- Sulfur deficiency occurs in canola, it can be quite severe but the frequency of such is most likely lower than thought and can be rectified early in crop without ongoing penalty
- Unwarranted applications of 20kg/ha of S is reducing the profitability of some canola crops and rates should be reviewed to maintenance levels of 4 kg/t of grain removed. If soil levels are adequate this may be reduced even further
- Canola is more frequently responsive to nitrogen applications and at least some expenditure on fertiliser may be better redirected from sulfur to nitrogen applications
- Soil test critical levels are un-calibrated, are most likely too high and should be reviewed
Introduction
Canola has been generally accepted as having high requirements for sulfur (S), much higher than that of wheat. S deficiency was first identified in 1988 and 1989 but was only noted as a significant problem in 1990 (Coulton & Sykes, 1992). Deficient situations lead to significant yield and oil penalties where it occurred.
In 2010 Grain Orana Alliance (GOA) established four trial sites investigating the effect of S fertiliser forms and timing on canola performance. In particular, final seed oil % was of interest. None of these trials resulted in any response to S fertiliser in yield or oil % regardless of form or timing.
Following from this result GOA questioned why responses were not seen despite prediction that three of the sites would respond. Was it because of changes in our farming systems, a vagary of the particular season as one of the wettest on record or because our understanding of S nutrition of canola and its occurrence was incorrect?
In 2011 and 2012 GOA established eight and four trials respectively to improve our understanding and better identify situations where S deficiency or responses will occur, yet none of these trials responded to S in yield or oil % either.
During this period a number of other agencies also conducted trials investigating S nutrition in canola. The results of these will be discussed in this paper and these too have not realised any S responses.
The results from these recent trials should challenge our understanding and approach to S nutrition in canola and a number of specifics listed below will be discussed in this paper such as;
- The frequency and likelihood of deficiencies in the CW of NSW
- Critical soil test levels
- Grain removal rates and nutrient budgeting
- New approaches to S nutrition in canola
Background
Unreliable yields and crop failures of canola in the late 80’s and early 90’s were suspected of being due to S deficiency. With the identification of these deficiencies, a series of 14 trials were established in 1992 in collaboration with CSIRO, UNE, Incitec and NSW DPI. These trials investigated the interaction of N and S and if higher N rates were exacerbating S deficiency (Sykes, 1990).
It was quoted in a report by ACIL consulting (1998) that the trials’ responses in 1992/3 were “dramatic”, particularly when following pasture. It also states that the trial collaborators, reported from the series of trials that “applying 20-30kg/ha is sufficient to achieve maximum yields” and “the best practice for maximising yield with the least risk versus cost trade off”. It is probable that all subsequent recommendations for S application in canola in most industry resources to current date are originally sourced from this one statement.
This recommendation was widely adopted and still accepted today as quoted in the 2009 BMP guide for canola;
“All paddocks sown to canola should receive 20kg/ha of sulfur in the form of available sulphate. On lighter soil with a history of deficiency symptoms increase rates to 30kg/ha.”
This practice will be referred to as Current Recommended Practice (CRP).
The adoption of this recommendation was rapid; it was estimated that even before the completion of the trials, 90% of canola was receiving the additional levels of S recommended. One of the key factors that supported this rate of adoption was the relatively low cost of S fertilisers at the time was outweighed by the risk of penalty in deficient situations (ACIL, 1998).
During the same period in the early 90’s the KCl-40 soil test for S was introduced and gained adoption as a more appropriate test method than the existing MCP method, however this superiority was demonstrated primarily on pasture sites. (ACIL, 1998)
The KCl-40 test was then widely used for estimating soil S levels particularly for canola. However there is very little literature for NSW, until recently with Anderson et al. (2013) reviewing past trial yield performance against soil tests. Assumedly, soil critical levels were based upon values extrapolated from critical levels for pasture situations and/or simply on the base blanket recommendations of 20-30 kg/ha of S.
Local trial work by Mullen and Druce between 1993 and 1998, demonstrated that responses to S were not common on heavy grey soils of the region due to S contained in the subsoil. Through this work, S fertiliser applied on these soil types is not common but all other soils in the GOA region commonly still receive the standard 20kg/ha of S.
More recently, trial work by Khan et al. (2011) has questioned the suitability of gypsum as a S source for growing of canola compared to sulphate of ammonia (SOA). Gypsum is a commonly used fertiliser in the GOA region and it was questioned if this was contributing to lower oil % in our crops and/or suppressing yields due to S deficiencies.
This was the basis of four trials run by GOA in 2010 investigating S sources and application timings. None of the trials responded to S in any form or timing despite predictions by soil analysis and experience to the contrary. This work is briefed in “Sulfur Nutrition in Canola - Gypsum vs. SOA and Application Timings” (Street, 2011).
Following this outcome and other questions raised in above mentioned paper, GOA continued this work. Trial design was revised to better mimic the original trial work with the simple aim to quantify a response and also help build on the predictability of response.
Recent findings
Summarised below are the findings from recent trial work investigating S responses in canola. For specific trial detail, please refer to individual trial reports. Unless otherwise stated all statistics are analysed at the 95% confidence level.
GOA trials
2010[1]
Four sites were selected in winter 2010 across the GOA region. Three sites were identified through recent KCl-40 soil tests as being low- moderate in S. The fourth site was deemed adequate in S by way of KCl-40 soil tests.
Table 1: Canola yield and oil % performance to applied S fertiliser, GOA 2010
| Site |
Total S 0-60cm kg/ha # |
Site Av. yield t/ha | Yield response to S | Oil % response to S |
|---|---|---|---|---|
| Nyngan | 1.4kg | 2.5 | n.s.d | |
| Narromine | 85kg | 2.2 | n.s.d | |
| Curban | 39kg | 2.8 | n.s.d | |
| Wellington | 23kg | 2.2 | n.s.d | |
# calculated S total = (KCl40 * bulk density * depth)
Treatments addressed three rates of S applied - 0, 15 or 30kg/ha, in two forms (gypsum or SOA), applied at five different timings from pre seeding to early flowering.
There was no significant difference between any treatment and UTC at 95% confidence levels in yield or oil % as assessed by ANOVA.
2011 [2][3]
Four plot sown sites and four farmer sown replicated trials were established in 2011. All sites were selected for low soil S with the details below.
The small plot sown trial protocol was changed in 2011 to a full factorial trial design with two nitrogen (N) rates (50 & 100kg N/ha) and five S rates (0, 5, 10, 20 & 30kg S/ha). All fertiliser treatments were predrilled immediately prior to sowing. S was supplied in the form of granular SOA (20% N, 24% S) and the N rates adjusted using urea (46% N).
Yield results were analysed by factorial analysis (ANOVA) with the outcome listed in the table below.
Table 2: Canola yield performance to increasing applied S or N fertiliser, GOA 2011
| Site |
Total N 0-70cm kg/ha # |
Total S 0-70cm kg/ha# |
Trial av. Yield | Yield response | |
|---|---|---|---|---|---|
| Nitrogen | Sulfur | ||||
| Geurie | 62 | 35 | 1.68 | +0.28 t/ha | n.s.d |
| Curban | 37 | 40.4 | 0.84 | +0.3t/Ha | n.s.d |
| Warren | 39 | 30.1 | 0.97 | +0.26 t/ha | n.s.d |
| Narromine | 44 | 42 | 2.03 | n.s.d | |
# calculated N/S total = (soil test value * bulk density * depth), NB- Oil % was not available for this set of trials
There was no response to added S in yield or oil %. Three of the sites demonstrated strong positive and statistically significant responses to increased N rates from 50kg/ha of N to 100kg/ha. Yield responses were 18% increase at Geurie, 32% at Warren and 42% at Curban.
The four farmer sown trials were small plot replicated trials. The trials were established on farmer sown paddocks on soils of low S backgrounds. These trials were only designed to provide further support to the more comprehensive plot sown trials and treatments were reduced to basic plus and minus S.
The treatments were broadcast ahead of rain during the vegetative stage and were:
- No N or S added or UTC
- S added in the form of SOA at 100kg/ha (21kg/ha N & 24 kg/ha S)
- N added as urea at 45kg/ha (21kg/ha N) to supply the equivalent amount of N contained in the SOA treatment
The outcomes analysed by ANOVA are listed in the table below.
Table 3: Canola yield and oil % performance to applied S or N fertiliser, GOA 2011
| Site | Total Soil S kg/ha # | Trial average Yield t/ha | Yield Effect | Oil Effect |
|---|---|---|---|---|
| Wongarbon | No S applied in 14 years | 1.7 | n.s.d | n.s.d |
| Coolah Black | 33 | 0.9 | Urea or SOA suppressed yield over UTC | n.s.d |
| Coolah Red | 31 | 1.06 | n.s.d | n.s.d |
| Arthurville | 24 | 2.3 | n.s.d | n.s.d |
# calculated S total = (soil test value * bulk density * depth)
As shown above, the only interaction achieved in these trials was a reduction in yield to applied S at Coolah. This reduction however was achieved with both urea and SOA which could indicate this was due primarily to the added N in both treatments, not the S. The resulting reduction in yield could be attributed to the dry conditions in late winter and spring experienced in 2011 at this site and over fertilisation with N, supported by the low average trial yield.
2012[4]
GOA repeated the same plot sown protocol employed in 2011 on a further four sites in 2012.
Yield and oil % results were analysed by factorial analysis (ANOVA) with the outcome listed in the table below.
Table 4: yield and oil % performance to increasing applied S or N fertiliser, GOA 2012
| Site |
Total N 0-70cm kg/ha# |
Total S 0-70cm kg/ha# |
Trial average Yield t/ha | Yield response | Oil % response | ||
|---|---|---|---|---|---|---|---|
| Nitrogen | Sulfur | Nitrogen | Sulfur | ||||
| Narromine | 75 | 18.3 | 2.79 | n.s.d | n.s.d | ||
| Curban | 88 | 33.8 | 1.27 | n.s.d | n.s.d | ||
| Wellington N | 32 | 37 | 0.61 | + 0.13t/ha | n.s.d | n.s.d | |
| Wellington S | 71 | 50 | 1.4 | + 0.1 t/ha | n.s.d | n.s.d | |
# calculated N/S total = (soil test value * bulk density * depth)
In 2012 there was no response to added S in yield or oil %. In two of the trials there was a significant response to increasing the N from 50kg/ha to 100kg/ha in yield. At the Wellington N site yield was increased by 24% with the increased N rate, the second site was 7%.
DPI collaborative trials 2012[5]
In 2012, in collaboration with the NSW DPI, two trials were undertaken at Trangie and Coonamble. The trials were a factorial design with four N rates (0, 25, 50 & 100kg/ha) and four S rates (0, 10, 20 & 30kg/ha) and two canola varieties in Pioneer 43C80 & Pioneer 44Y84 sown at the Trangie site but only Pioneer 44Y84 sown at the Coonamble site.
Yield and oil % results were analysed by factorial analysis (ANOVA) with the outcome listed in the table below.
Table 5: Canola yield and oil % performance to increasing applied S or N fertiliser, DPI/GOA 2012
| Site | Total N 0-90cm kg/ha # | Total S 0-90cm kg/ha # | Trial average yield t/ha | Yield response | Oil % response | ||
|---|---|---|---|---|---|---|---|
| Nitrogen | Sulfur | Nitrogen | Sulfur | ||||
| Coonamble | 73 | 20 | 2.56 | n.s.d | n.s.d | ||
| Trangie | 113 | 141 | 1.81 | + 0.35 t/ha | n.s.d | -1.60% | n.s.d |
#calculated N/S total = (soil test value * bulk density * depth)
At the Coonamble site there was no response to the addition of N or S in either yield or oil %.
The Trangie site resulted in no significant response to S in yield or oil % but would not be expected given soil S levels. There were significant responses to N in yield and oil %. Increasing N rates increased yields but decreased oil %. There was a significant response to variety with 44Y84 outperforming 43C80 in both yield and oil % (data not presented).
DPI northern region trials 2012[6]
DPI established two trials in Northern NSW investigating N and S interactions.
The trials were a factorial design with four N rates of 0, 40, 80 and 120kg/ha at Moree and 0, 50, 100 and 200 kg/ha at Blackville both with four S rates of 0, 11, 21 & 41kg/ha and two canola varieties. Nitrogen was applied as urea with sulphur applied as granulated gypsum applied pre sowing.
Yield and oil % results were analysed by factorial analysis (ANOVA) with the outcome listed in the table below.
Table 6: Canola yield and oil % performance to increasing applied S or N fertiliser, DPI 2012
| Site | Total N 0-90cm kg/ha# | Total S 0-90cm kg/ha# | Trial Av. Yield t/ha | Yield response | Oil % response | ||
|---|---|---|---|---|---|---|---|
| Nitrogen | Sulfur | Nitrogen | Sulfur | ||||
| Blackville | 28 | 130 | 1.54 | + 1 t/ha | n.s.d | -0.79% | n.s.d |
| Moree | 46 | 94 | 1.15 | + 0.74 t/ha | n.s.d | -1.60% | n.s.d |
#calculated N/S total = (soil test value * bulk density * depth)
There was no response to added S at either site in yield or oil % as would be expected with such high levels of soil S. Both sites responded strongly to the addition of N, in yield the response was positive but both negative in oil %.
NGA trials 2012[7]
NGA established two trials in 2012 investigating nutrition of canola in the northern region. The trials investigated the interaction of N and S as well as phosphorus (P).
The trials were a factorial design with three N rates of 34, 84 and 134kg/ha with three S rates of 1, 16 and 31kg/ha. Nitrogen was applied as urea with sulphur applied as Gran Am (SOA) applied pre sowing.
Yield and oil % results were analysed by factorial analysis (ANOVA) with the outcome listed in the table below.
Table 7: Canola yield and oil % performance to increasing applied S or N fertiliser, NGA 2012
| Site | Total N 0-90cm kg/ha # | Total S 0-90cm kg/ha # | Trial Av. Yield t/ha | Yield response | Oil % response | ||
|---|---|---|---|---|---|---|---|
| Nitrogen | Sulfur | Nitrogen | Sulfur | ||||
| Bellata | 69 | 164 | 1.37 | + 0.15 t/ha | n.s.d | -2.80% | n.s.d |
| Yallaroi | 30 | NA | 1.79 | + 0.31 t/ha | n.s.d | n.s.d | |
#calculated N/S total = (soil test value * bulk density * depth)
There was no response to added S at either site in yield or oil %. At both sites there was a positive response to increasing N rates, 13% at Bellata and 20% at Yallaroi. At Bellata there was a negative response in oil % to increased N rates. The Bellata site responded to added P, at the Yallaroi site there was a trend to increase with added P but was not significant (not in the table).
Central West Farming Systems (CWFS)[8]
CWFS have undertaken a number of trials at their regional sites investigating canola S nutrition over a number of seasons. Unfortunately individual trial data was not available at the time of writing this paper but personal comments regarding the trials by John Small of CWFS, regarding their trials over recent seasons are below.
“There has been no clear or statistically significant response to the addition of S in terms of yield or oil performance in canola over a number of trials by CWFS over recent seasons.”
Readers should seek further clarification and data from CWFS concerning these trials before finalising one’s conclusion. The outcomes of these trials will however be valuable in the sense that they would generally be undertaken on red soils of our region, more likely to respond than the heavier soils of the northern regions.
Discussion
As indicated above there has been no response to S in terms of yield or oil % in recent trial work. This work has been undertaken by a number of agencies across a range of soil types and three seasons. It should also be noted that all but one of GOA’s trial sites were selected specifically for low soil S levels and were predicted to be responsive.
Why have responses not been achieved?
As stated above, CRP is that all canola paddocks should receive S fertiliser. However of the original trial work that formed this recommendation only six of the fourteen sites detailed responded to S in yield and only three in oil % (Sykes, 1990). Many of these sites did not respond despite prediction by soil tests.
The most commonly reported trial was at the Wellington site where yields increased from 1t/ha to 4t/ha with the addition of S. At this site 75% of the site maximum yield was achieved at 10kg of S/ha, and 92% at 20kg/ha of S applied. A similar result was demonstrated at Baradine, but these could be described as the two worst documented cases of S deficiency.
Many of the other responsive sites did not realise such magnitude of improvement. At the Gollan site at the 40kg N/ha rate- increasing S from 0 to 20kg/ha only increased yields by 590kg. At 80 kg N/ha rate- there was a 325 kg/ha improvement by increasing S from 0 to 20 kg/ha. At the Junee Reefs and Tamworth sites a maximum response was achieved of approximately 400 kg/ha. These were then and would still be worthy and economic responses on today’s fertiliser prices but the penalties nowhere close to the extent that is often promoted.
The ACIL report also mentions other previous work in 1990 commenting, “A major field study of canola in NSW reported significant grain yield increases from the addition of N but no significant responses to S (Sykes and Coulton, 1990)”.
More recent work as detailed above shows no response to the addition of S over three years and a range of soils predicted to respond.
In summary, the frequency of response to added S is quite low, considering the detailed trials in this paper less than 14% of trial sites were responsive (excluding the field study of 1990 and those of CWFS).
Industry accepted grain removal rates used in nutrient budgets may also lend support to the CRP. Current industry references suggest that removal rates are 10kg S/ t of grain and that crop requirements of canola are much higher than that of wheat (Coulton et al, 1992).
Analysis of grain samples from GOA’s and NGA’s trial work have shown that grain removal is much lower than these levels. Published data by Janzen and Bettany (1994), Pinkerton et al. (1993) and Hocking et al. (1996) all measured grain S contents in their range of experiments. Grain S levels no greater than that of ~0.5 % or 5kg S/t of grain was measured even in treatments with adequate S. In many cases the S levels were even lower resulting in them being less than half the industry benchmarks.
When considering this for formulating crop requirements and fertiliser programs there may be little difference between the requirements for wheat or canola. For example an average wheat yield for the GOA region may be 3 t/ha, removing approximately 1.8 kg/t of S or 5.4 kg/ha of S. Canola will generally perform at 50% of comparable wheat yields so 1.5t/ha removing 3.6 kg/t (critical threshold) Hocking et al.(1996) will remove only 5.4 kg/ha of S or similar amounts to the wheat crop.
So in possible explanation of the lack of responsiveness in all these trials, the sites were simply predicted to respond when they were not likely; there was adequate S contained in the soil profile and subsequent mineralisation to satisfy crop demands, a demand much lower than previously understood to be.
For example, using the highest achieved yield in the GOA trials of ~ 2.8t/ha the crop removal rate would be 9.8 kg/ha. If we assumed an arbitrary uptake or transfer efficiency of 50%, the crop would only have a growing requirement of 20 kg/ha. All of the sites detailed in this paper would have satisfied this requirement with starting soil levels and only a minimal amount of mineralisation; no additional fertiliser would be required.
So what is the critical soil level to indicate when S may be required to be added? To supply this requirement of 20kg/ha of S a soil KCl-40 test would have a critical level of ~2.3 mg/kg averaged in the top 60cm of soil depth[9]. If this is indeed the soil critical level, few cropping soils would be lower.
The new paradigm in canola nutrition
Reducing Sulfur fertiliser rates
When considering the fertilising of canola, its S requirement is a distinguishing difference from most other field crops. As such, it is often the first nutrient addressed after that of starter P fertiliser applications in fertiliser programs and its requirement of N then follows.
More than 20 trials run over the past three seasons that have been briefed above have failed to demonstrate responses to added S in either yield or oil %. Average crop removal rates do not support the requirement of 20kg S/ha universally.
Given this scenario, reducing the CRP of 20kg/ha of S to rates which more closely match crop yields and subsequent removal rates would certainly be a more economic approach whilst being sustainable in the longer term.
However the complete lack of S response in recent trials raises the possibility of completely removing intended S applications as it is done in wheat. Given there is often no yield or oil % response, profitability in the short term will only decline with any additions of S.
However if growers are to take this this approach, soil tests may be still useful to predict potential responsiveness if using removal rates. If soil levels concentrations and subsequent calculations of soil available S outstrip the predicted conservative crop requirements at 4-5 kg of S/t of crop potential, the likelihood of crop responses or a deficient situation developing is unlikely.
In these situations of no S applications, growers do risk that deficiencies may develop despite prediction to the contrary. If this deficiency is identified prior to stem elongation and S applied, trial work by Hocking et al. (1996) showed that both final yield and oil % will not be penalised. But remember the frequency of such a deficiency on the basis of recent trial work is low but not zero.
Re-focus investment on nitrogen instead of sulfur.
In contrast, the majority of all trials have demonstrated response to N.
Twelve of the fourteen trials undertaken in 1992 resulted in significant and economical responses with an average increase to 80 Kg of N of 600kg/ha (Sykes, 1990). Of the two that did not, one of the trials was following five years of grass free legume based pasture, the other was compromised by frost resulting in a high CV.
Three of four trials of GOA’s in 2011 responded significantly to increasing N from 50kg/ha of N to 100kg/ha. The average yield increase over the three sites was 280kg/ha returning around 200% ROI[10]. Two of GOA’s trials in 2012 returned a significant yield response to increasing N as well. Returns were much lower with the dry spring conditions with the yield increases only breaking even after additional costs.
Trials by NGA in 2012 demonstrated a 13% yield increase or about 150kg/ha (break-even) by increasing N from 34 kg/ha to 84 kg/ha in one trial. The second site saw an increase yield of 20% or ~310kg/ha, resulting in approximately a 200% ROI.
It should be noted that GOA’s and NGA’s trials did not have zero N treatments but they were all clearly N responsive sites.
In the DPI/GOA trials in 2012 treatments of 0 N were included and this allows a response curves to be generated. The Trangie site showed strong responses to N with yield increasing by 0.35t/ha or 21% by increasing N from zero to 100kg/ha. The economics of such applications are demonstrated below.
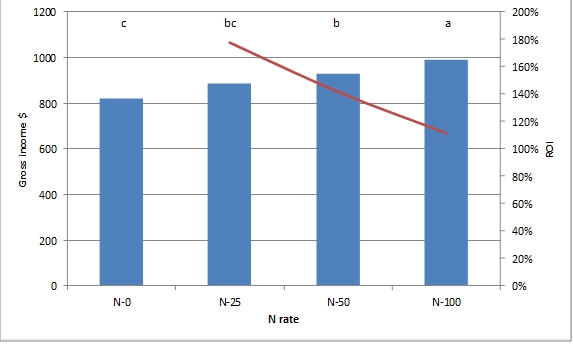
Columns headed by the same letter denotes no significant difference
Figure 1: Canola yield performance in relation to applied N rate and the corresponding return on investment (ROI), Trangie.
Source: - DPI/GOA (2012)
Although the starting soil N at this site was high at 113kgha, yield and resultant gross income has increased almost in a linear response and the treatments have not demonstrated a clear upper limit. The responsiveness of canola to high rates is reinforced at three other sites detailed in Figure 2; again there was no clear indication of a yield plateau even up to 200 kg N/ha.
So although canola will tend to respond to increasing N, the ROI has declined beyond the 25kg/N rate but still remained positive. This is only one trial in a dry spring but it demonstrates the most economical rate is not necessarily the point of yield maximisation. The economically optimum level for N rates may be different for each situation.
Determining the optimal N rate for canola through deep soil tests coupled with yield forecasting may be one approach and probably the most reliable.
It is worth noting that increasing N rates may have the effect of reducing oil % as demonstrated in the Trangie, Bellata, Blackville and the Moree trials (Figure 2). Many of the trials from 1992 also showed statistically significant reductions in oil content from increased N rates. Increased N can lead to increased protein. Protein’s relationship to oil % is inverse so this can lead to depressed levels of oil. However in all cases the increased yield more than adequately offset this loss.
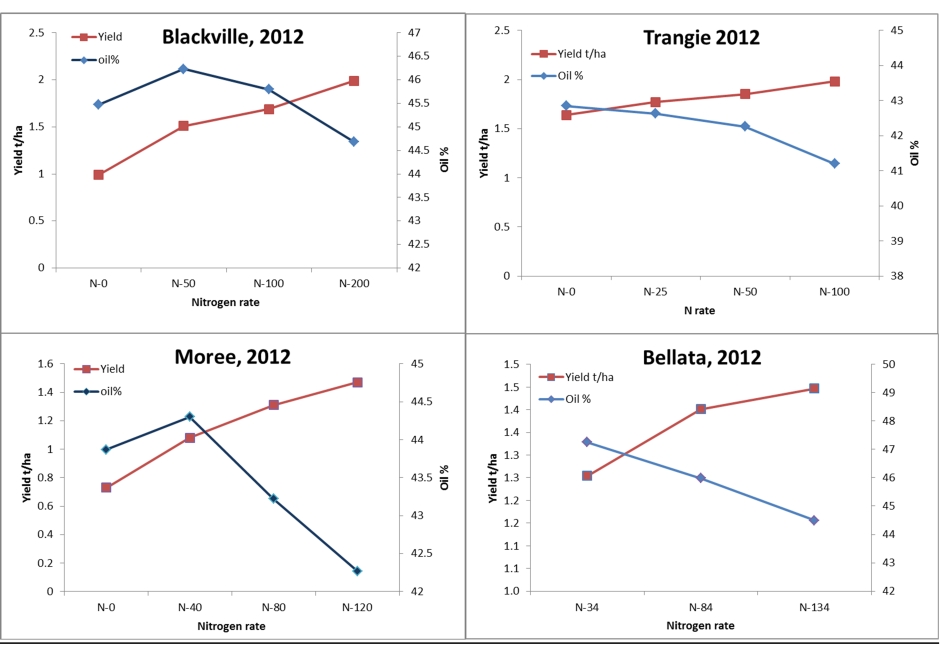
Figure 2: Canola yield and oil % performance demonstrating the inverse relationship to applied N.
Source: - DPI/NGA/GOA (2012)
Summary
In summary, 20 trials have now recently been undertaken across a number of seasons and locations in NSW. None of them have demonstrated S responses in yield or oil %. This does not exclude deficiency and yield penalties from occurring but does highlight that the frequency and the likelihood is not high.
The results and the ensuing extension message regarding the need for S from the trial work in 1992 may have lost its original perspective. Within the original reports the data suggested that N was paramount to achieve maximum profitability for canola is nearly all cases. The data also suggested that in only some cases canola responded to S as well.
The one extension message that resulted and stuck was that all canola crops needed 20 kg/ha of S and sometimes more, needed to be applied. The then lower cost of S fertiliser and the significant penalties seen in deficient situations, saw this recommendation adopted rapidly, needed or not.
Declining terms of trade over the last 20 years now does not allow for such a luxurious approach particularly if not warranted.
Through GOA’s efforts a number of shortcomings in the understanding of canola agronomy have been highlighted. Removal rates are over-estimated and the lack of calibrated soil critical levels is a major problem. Improvement in both of these may improve the predictability of S responsiveness.
With the reduced frequency of response and considering the reviewed S demand of canola, the CRP may need revision to closer match S removal rates. This will result in increased profitability and sustainability for growers.
Complete removal of S from fertiliser programs may risky but will prove to be the most profitable in many cases. However wheat has a similar requirement per hectare, and whose predominant fertiliser is MAP/DAP containing only minimal S is not noted to suffer yield impacts through deficiencies. And it should be remembered deficient situation can be easily rectified by in crop applications.
There is a good case for the savings in expenditure on S to be redirected to N where the response is much more common. But determination of the optimal rate of N may need to be revisited or targeted through soil tests and nutrient budgets to ensure the return on investment is maximised not simply the yield.
“Current recommendations consider S to be non-negotiable and N applications more seasonally dependent. This approach needs to be reversed; S application need to be more prescriptive in it use and refocus our attentions and redirect our expenditure on getting our N rates right.”
References
ACIL Consulting (1998). Sulfur test KCl40 and the growth of the Australian canola industry. Arawang Communication Group, Canberra.
Anderson, Geoffrey C., Peverill, Ken I. and Brennan, Ross F.(under review - to be published 2013) Soil sulfur – crop response calibration relationships and criteria for field crops grown in Australia
Coulton, R and Sykes, J.(1992) Canola Agfact P5.2.1 fourth Ed. NSW Agriculture.
Good, A.J. , Pinkerton, A. , Hocking, P. , Blair, g. , Sykes, J (1993). Nitrogen and sulfur affect canola seed yield and oil percentage. Retrieved- www.regional.org.au/asa/1993/poster/grain-legumes-oilseed/1993pgs342-pos 7th Feb. 2011.
Good, A.J and Glendinning, J. S. (1998) Canola Needs Sulfur. Better Crops International, Vol 12, No 2, November 1998. Retrieved from http://anz.ipni.net/ipniweb/regions/anz/regionalPortalANZ.nsf/4d69fbe2e4abc746852574ce005c0150/d6dd95ec92bd94de852576ff0082d61c/$FILE/BC%20sulfur%20and%20canola.pdf
McCaffery, D., Potter, T. Marcroft, S. and Pritchard, F. (2009). - Canola Best Practice Management Guide for South-Eastern Australia- GRDC Coretext
Hocking, P.J. , Pinkerton, A. , Good, A. (1996) Recovery of field grown canola from sulfur deficiency. Australian Journal of Experimental Agriculture, 36, p79-85
Janzen, H.H. and Bettany, J.R. (1984). Sulfur nutrition of rapeseed. Influence of fertiliser nitrogen and sulfur rates. Journal of the soil Science Society of America 48, 100-7
Khan, T., Norton, R., Edis,. Walker, C. and Chen, D. (2011) Comparing N and S sources to improve yield and nutrient efficiencies in canola cropping systems is south eastern Australia. 17th Australian Research Assembly on Brassicas, Wagga Wagga 2011.
Mullens, C and Druce, S J.(no date) Variable canola performance on heavy grey clay soils of upper central New South Wales. Retrieved from http:/regional.org.au.au.gcirc/2/504.htm?PO_0&print=1
Pinkerton, A., Hocking, P. J., Good, A., Sykes, J., Lefroy, R. D. B. and Blair, G. J. (1993)A preliminary assessment of plant analysis for diagnosing sulfur deficiency in canola.'Proceedings of the 9th Australian Research Assembly on Brassicas'. Wagga Wagga, NSW. (Eds N. Wratten and R. J. Mailer.) pp. 21-8.
Street, M. (2011) Sulfur Nutrition in Canola- Gypsum vs. SOA and Application Timings. GRDC Update proceedings, Dubbo 2011. Retrieved from http://www.grdc.com.au/Research-and-Development/GRDC-Update-Papers/2011/04/Sulfur-nutrition-in-canola-gypsum-vs-sulphate-of-ammonia-and-application-timing
Sykes, J (1990) Sulfur removes variability from nitrogen applications. Retrieved from http://trials.incitecpivotfertilisers.com.au/document/trial/12abdad4c6b3f705b48d5f7e8660a270.pdf
Useful links and access to detailed trial reports
www.nga.org.au
www.grainorana.com.au
www.dpi.nsw.gov.au/agriculture
www.cwfs.org.au
Contact details
Maurie Street
Grain Orana Alliance Inc. (GOA)
Ph: 0400 066 201
Email: maurie.street@grainorana.com.au
[2] GOA1101-1104 (plot sown trials)
[3] GOA1110-1113 (farmer sown trials)
[5] GOA1206 & 1207 or NSW DPI site
[6] NSW DPI Northern trials booklet
[8] www.cwfs.org.au
[9] 2.8t/ha * 3.5kg/t / 50% = crop requirement/1.4 (soil bulk density) / 6 (10 cm soil segments)
GRDC Project Code: GOA00001: GRDC Grower Solutions for Central West NSW, DAN00129: VSAP Variety Specific Agronomy Packages, NGA00003: GRDC Grower Solutions for Northern NSW and Southern Qld,
Was this page helpful?
YOUR FEEDBACK