Doing the numbers: The role and contributions of break crops in cropping systems
Author: Mark Peoples, James Hunt, Tony Swan, Laura Watson, Guangdi Li, Richard Lowrie, Paul Breust, Claire Browne and Simon Craig | Date: 26 Feb 2013
Mark Peoples1, James Hunt1, Tony Swan1, Laura Watson1, Guangdi Li2, Richard Lowrie2, Paul Breust3, Claire Browne4, Simon Craig4
1CSIRO Sustainable Agriculture Flagship, CSIRO Plant Industry, Canberra ACT; 2 EH Graham Centre, Wagga Wagga, NSW; 3FarmLink, Junee, NSW; 4Birchip Cropping Group, Birchip, Vic
GRDC project code: CSP000146; BWD00012; CSP00111
Keywords: pulses, canola, wheat, profit
Take home messages
- Results from experimentation undertaken in southern NSW in 2011 and 2012, and since 2009 in the Victorian Mallee, have demonstrated that crop sequences which include a brassica or legume break crop can be as profitable as, and in many instances more profitable than, continuous wheat.
- Canola was consistently the most profitable break crop option. However, the rotational benefits of canola were usually restricted to just the first subsequent wheat crop, whereas additional wheat yields can occur for 2 years after a legume.
- Growing pulses for grain maximises profit, particularly in favourable seasons, but compromises grass weed control and, depending upon species, reduces N available to subsequent crops compared to brown manuring.
- Growing pulses for hay was found to be profitable across a range of season types; achieves excellent grass weed control; and provides greater nitrogen (N) inputs and higher carry-over of soil water than when the same crop is grown for grain.
- Growing pulses for brown manure loses money in the year they are grown; but achieves excellent grass weed control, high N inputs, residual carry-over of soil water, provides more ground cover, and requires less labour than when grown for hay.
Background
Most grain growers recognise that they should include broadleaf species in their cropping program to reduce disease incidence for cereals and to improve soil N fertility. However, the area sown to legume pulse crops or canola declined dramatically between 1999 and 2009. There were many good reasons why growers reduced the frequency of broadleaf species during that time which were related to late starts to the growing season, drought and risk aversion. Yet it appears that much of the decline can also be attributed to the wide-spread perception that broadleaf options are higher risk and not as profitable as cereals. The aim of the work described here was to challenge this notion, and to examine the potential beneficial impacts of break crops on the longer-term financial performance of following wheat crops.
The benefits of break crops
Data collated from many research experiments indicate average yield improvements equivalent to 0.6-0.8 t wheat grain/ha when wheat is grown after canola or mustard compared to wheat on wheat (Fig. 1), and between 1.1-1.8 t/ha by wheat grown following a grain legume compared to the yield of wheat on wheat in the absence of N fertiliser (Fig. 2). Some of this increase in wheat yield can be derived from (Kirkegaard et al., 2008; Peoples et al., 2009; Kirkegaard and Hunt, 2010): (i) breaking of cereal disease cycles, (ii) changes in soil structural characteristics that encourage a deeper rooting depth, (iii) carry-over of residual soil water, or (iv) providing a range of weed contol options. In the case of legumes rotational benefits can also be derived from specific affects on: (v) the composition of soil microbial populations, (vi) increased availability of soil N, and/or (vii) increased availability of phosphorus.
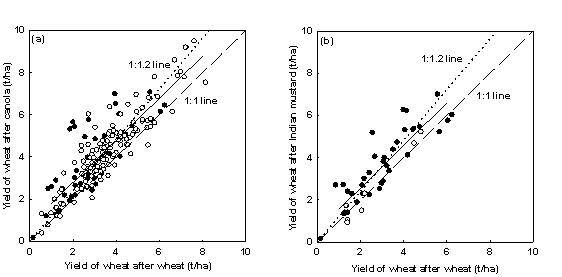
Figure 1. Effect on wheat grain yield of a previous crop of (a) canola or (b) Indian mustard compared to yields achieved where wheat was grown after wheat. Solid points refer to experiments in Australia and open points to experiments elsewhere. The solid line represents fitted regression equations, the dotted line represents a 20% yield increase and the dashed line represents equal yields (Angus et al. 2011).
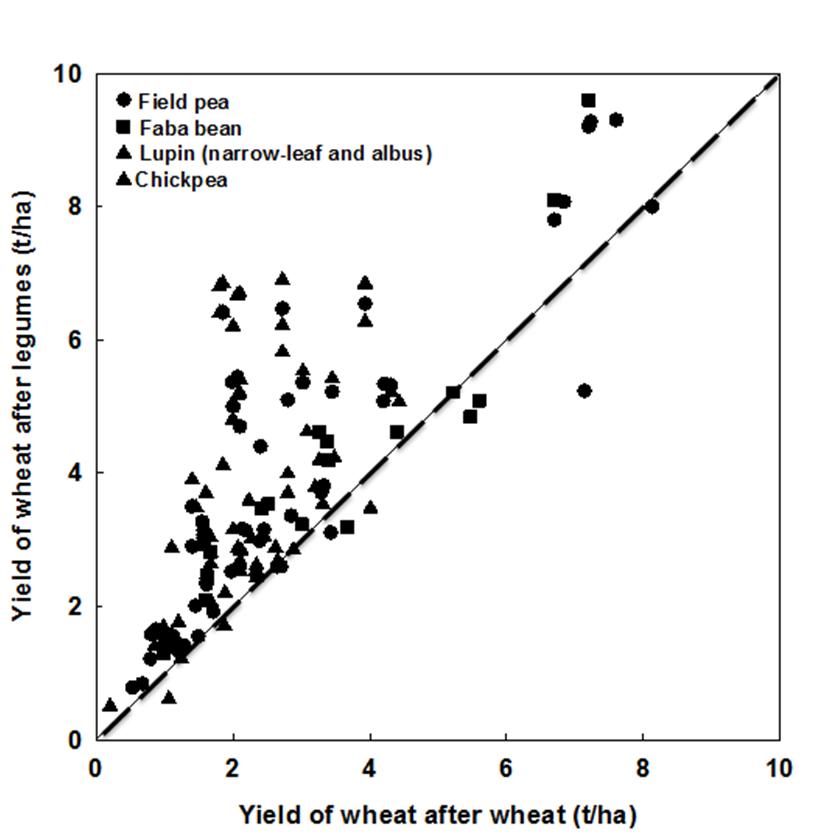
Figure 2. Comparison of yield of wheat growing after grain legumes, with wheat after wheat in absence of additional fertiliser N. The dashed line represents equal yields (Angus et al., 2008).
The present paper focuses on break crop effects on grain yield and profit derived from data generated from GRDC project CSP000146, experimentation undertaken in association with FarmLink in southern NSW, and from joint Birchip Cropping Group (BCG)-CSIRO trials from the Victorian Mallee arising from GRDC projects BWD00012 and CSP00111.
Three key research questions are addressed:
- Can a brassica or legume break crop be as profitable as a cereal in its own right?
- What are the trade-offs between the cost of production (risk) and potential profit (reward) of different break crop options and end-uses?
- Do the rotational benefits of break crops allow lower inputs and reduced production risk in subsequent cereal crops that result in more profit?
Comparing the profitability of break crops with cereals
Southern NSW
Junee Reefs, NSW 2011
Aim: To compare the productivity and relative profitability of various low input/low risk cropping options with alternative high input/high risk, but potentially higher return crops.
Experimental details: Soil pH (0-10 cm in CaCl2) was 5.50. Treatments and relative input cost (risk) category were as follows:
- Canola (Low: Crusher TT
 open pollinated variety) + (Jockey® + Gaucho®) + 25 kg/ha MAP (3 kg N/ha) + 100 kg/ha urea (46 kg N/ha) and 80 kg/ha ammonium sulphate (17 kg N/ha) in-crop.
 - Canola (High: Hyola 505 RR hybrid) + (Jockey® + Gaucho®) +100 kg/ha ammonium sulphate (21 kg N/ha) + 75 kg/ha MAP (8 kg N/ha) + 500 g/l flutriafol (Impact® Endure) @ 200 ml/ha + 100 kg/ha urea in-crop (46 kg N/ha).
- Lentil (Medium: Flash) + N-Prove® inoculant + 25 kg/ha MAP (3 kg N/ha).
- Chickpeas (High: PBA Slasher) + P Pickel-T® + Biostacked® inoculum + 75 kg kg/ha MAP (8 kg N/ha)
- Lupins (Medium: Mandelup for grain) + Biostacked® inoculum + 75 kg kg/ha MAP(8 kg N/ha)
- Lupins (Low: Mandelup for brown manure) + Nodulaid inoculant + 25 kg/ha MAP(3 kg N/ha)
- Field peas (Low: Morgan for brown manure) + P Pickel-T® + Nodulaid® inoculant + 25 kg/ha MAP (3 kg N/ha)
- Barley (Low: Hindmarsh) + Raxil® + 25 kg/ha MAP (3 kg N/ha) + 100 kg/ha urea (46 kg N/ha) in-crop
- Wheat (Low: Lincoln) + Raxil® + 25 kg/ha MAP (3 kg N/ha) + 100 kg/ha urea (46 kg N/ha) in-crop
- Wheat (High: Lincoln) + Dividend® + 75 kg/ha MAP (8kg N/ha) + 500 g/l flutriafol (Impact® Endure) @ 200 ml/ha + 200 kg/ha urea (92 kg N/ha) in-crop
There were two sowing times in 2011: late April (canola and lupins), mid May (lentil, chickpeas, peas, barley and wheat). Treatments were replicated four times and were sown in a randomized design. Trifluralin was used as a pre-emergent for all treatments except the TT canola (low) which also had atrazine, and wheat (high) which used Boxer Gold®. Chickpea had a particularly expensive PSPE application of terbuthylazine (Terbyne®), isoxaflutole (Balance®) metribuzin. There were two in-crop glyphosate applications to the RR canola (high) and a single in-crop atrazine applied to TT canola (low). Foliar fungicides were applied as Prosaro® + Hasten® to wheat (high), Tilt® to barley, and two applications of Barrack® to lentils and chickpea.
Results: Shoot dry matter (DM) accumulation over the 2011 growing season, grain yield, the amounts of N removed in grain at harvest, and estimates of the total inputs of fixed N by the legume treatments are presented in Table 1.
Table 1. Measures of shoot dry matter (DM) accumulation, grain yield, and net N-balance of cereals and various break crops grown for grain or brown manure (BM) at Junee Reefs, NSW in 2011. Crops are arranged in order of descending net N balance.
|
Crop & input |
Peak biomass |
Grain yield |
N removed in grain |
Total inputs of N fixeda |
Net N balanceb |
|
|
(t DM/ha) |
(t/ha) |
(kg N/ha) |
(kg N/ha) |
(kg N/ha) |
|
Lupin BM - low |
8.4 |
0 |
0 |
246 |
+246 |
|
Pea BM - low |
6.3 |
0 |
0 |
113 |
+113 |
|
Lupin - medium |
9.9 |
3.5 |
210 |
310 |
+100 |
|
Chickpeas - high |
6.4 |
1.8 |
77 |
140 |
+63 |
|
Lentils - medium |
5.7 |
3.2 |
139 |
136 |
-3 |
|
Wheat - low |
11.1 |
4.8 |
87 |
0 |
-87 |
|
Barley - low |
12.1 |
6.3 |
98 |
0 |
-98 |
|
Canola - low |
10.6 |
3.2 |
112 |
0 |
-112 |
|
Wheat - high |
12.8 |
5.2 |
114 |
0 |
-114 |
|
Canola - high |
12.6 |
3.3 |
116 |
0 |
-116 |
|
LSD (P<0.05) |
1.3 |
0.5 |
- |
- |
- |
a Includes an estimate for contributions of fixed N by the nodulated roots as described by Unkovich et al (2010).
b Net N balance = (total inputs of fixed N) – (N removed in grain).
Growing season rainfall (GSR) was 216mm which was somewhat lower than the long-term average GSR of 300mm, but heavy rainfall in February 2011 (226mm) resulted an annual total of 639mm which was approximately 130mm wetter than the long-term average (508mm). The full soil water profile at the beginning of the growing season contributed to large amounts of shoot DM and resulted in respectable grain yields for the various break crops and cereals grown at Junee Reefs (Table 1). Net N balances were calculated for each treatment by comparing inputs of fixed N with grain N removal. The data indicated that canola and wheat cropping represented the greatest losses of N from the system while the largest net returns of N were derived from the brown manured legume treatments and lupin grain crop (Table 1).
Table 2. Comparisons of grain yield, income, variable costs and gross margins of cereals and various break crops grown for grain or brown manure (BM) at Junee Reefs, NSW in 2011. Values in parenthese represent the contribution of input costs to total variable costs. Crops arranged in order of descending gross margin.
|
Crop & input |
Grain yield |
Gross incomea |
Total variable costs |
Gross margin |
Profit/cost ratio |
|
|
(t/ha) |
($/ha) |
($/ha) |
($/ha) |
|
|
Canola - low |
3.2 |
$1,581 |
$381 ($181) |
$1,199 |
3.1 |
|
Canola - high |
3.3 |
$1,604 |
$571($334) |
$1,033 |
1.8 |
|
Lentils - medium |
3.2 |
$1,165 |
$455 ($172) |
$710 |
1.6 |
|
Barley - low |
6.3 |
$945 |
$386 ($130) |
$559 |
1.4 |
|
Wheat - high |
5.2 |
$1,056 |
$544 ($324) |
$511 |
0.9 |
|
Lupin - medium |
3.5 |
$770 |
$315 ($164) |
$455 |
1.4 |
|
Wheat - low |
4.8 |
$744 |
$319 ($117) |
$425 |
1.3 |
|
Chickpeas - high |
1.8 |
$792 |
$406 ($296) |
$386 |
1.0 |
|
Pea BM - low |
0 |
$0 |
$139 ($104) |
-$139 |
-1.0 |
|
Lupin BM - low |
0 |
$0 |
$150 ($115) |
-$150 |
-1.0 |
aGrain prices used in the calculations were current at the around the time of harvest and assumed delivery to Junee except RR canola to Stockinbingal (extra freight cost = $5/t) and lentils to Victoria (extra freight cost = $53/t).
Canola yields were 3.2-3.3 t/ha with an oil content on 46-49%. The N fertilizer applied to wheat (low input = 48 kg N/ha and high input = 100 kg N/ha) had little effect on yield (4.8 cf 5.2 t/ha; respectively), but did have a large impact on grain protein (low input 10.4% and high input 12.5%). Low grain prices received for wheat in 2011 ($155/t for ASW and $203/t for AH2) resulted in canola and lentil being more profitable than both wheat and barley, and lupin to be more profitable than the low input wheat treatment (Table 2). However, it should be noted that >150mm rainfall fell across large areas of southern NSW in November and December 2011 which delayed the harvest of many farmers’ crops and resulted in the down-grading of much of the grain. As a consequence, gross margins achieved on-farm for wheat in 2011 may have been lower than shown in Table 2.
No income was generated by the brown manure treatments, but potentially they will contribute in future years through additional N supply and/or carry-over of residual soil water for the benefit of following wheat crops. The favourable gross margins received for canola and lentil relative to cereals were reflected in profit : input cost ratios of between 1.6:1 and 3:1 compared to 0.9-1.3 for wheat (Table 2). In other words, $1.60-$3 profit was recieved for every $1 spent when growing these particular break crops in 2011, but $1.30 profit or less was achieved for every $1 invested on wheat.
Wagga Wagga, NSW 2011
Aim: To compare the productivity and relative profitability of continuous wheat with wheat grown after one or two years of various break crop options in different sequences.
Experimental details: This experiment aims to compare the effects of one and two year breaks with a range of broadleaf species on wheat productivity (see Table 3). In addition to grain crops, high-density clover forage and vetch treatments grown for hay or brown manure were included in the experimental design, but only data from canola, pulses and wheat will be presented here. Results reported in this section come from the first year of the trial as indicated in Table 3.
Table 3. Treatments at the Wagga Wagga site.
|
|
2011 |
2012 |
2013 |
|
Single break |
Canola Lupin Pea (Harvest for grain) Pea (Brown manure) |
Wheat |
Wheat |
|
Double breaks |
Pulses (Lupin or Pea) |
Canola |
Wheat |
|
Canola |
Pulses (Lupin or Pea) |
Wheat |
|
|
Continous wheat |
Wheat |
Wheat |
Wheat |
|
|
Wheat |
Wheat + N |
Wheat + N |
Results: The GSR in 2011 at the Wagga trial site was 318mm which represented a decile 4 growing season (long-term average GSR = 342mm). However, the total annual rainfall of 664mm was above-average (long-term = 553mm) due to 158mm in February and 148mm in November 2011. The net result was wheat yields (5.1 t/ha) and biomass production by the pea brown manure (7.6 t/ha) that were quite acceptable (Table 4). However, despite canola yields being less than 50% of wheat, the gross margin for canola still proved to be $200/ha higher than wheat (Table 4). This in part reflected the low grain price received for wheat in 2011 as discussed above in relation to the Junee Reefs trial.
Table 4. Comparisons of grain yield and brown manured (BM) pea herbage dry matter (DM) production, income, variable costs and gross margins at Wagga Wagga, NSW in 2011. Crops arranged in order of descending gross margin.
|
Crop |
Grain or DM yield |
Gross incomea |
Total variable costs |
Gross margin |
Profit/cost ratio |
|
|
(t/ha) |
($/ha) |
($/ha) |
($/ha) |
|
|
Canola |
2.2 |
$1,089 |
$439 |
$649 |
1.5 |
|
Wheat |
5.1 |
$790 |
$343 |
$447 |
1.3 |
|
Pea |
2.5 |
$554 |
$297 |
$257 |
0.9 |
|
Lupin |
2.0 |
$493 |
$261 |
$232 |
0.9 |
|
Pea BM |
7.6 |
0 |
$235 |
-$235 |
-1.0 |
aGrain prices used in the calculations were current at the around the time of harvest and assumed local delivery. Variable costs were derived from NSW DPI farm budget book published in 2012 (Dryland south-east winter crop gross margins: http://www.dpi.nsw.gov.au/agriculture/farm)
Eurongilly, NSW 2012
Aim: To compare the productivity and profitability of cropping in the presence of a background of herbicide-resistant ryegrass, and to assess the implications of various low or high input grass control options applied to wheat and break crops on production costs and ryegrass management.
Experimental details: The sensitivity/resistance of the ryegrass population present at the trial site was tested by Plant Science Consulting SA in March 2012. The results of the analysis presented in Table 5 indicate some degree of resistance to a range of grass-selective herbicides, but suggested that ryegrass may still be susceptible to Factor (butroxydim) and glyphosate. This information was used to determine the research herbicide treatments for experimental purposes.
Table 5. Herbicide resistance assessments determined in March 2012 for resident ryegrass population at the trial site near Eurongilly, NSW
|
Herbicide |
Herbicide group |
Survival (%) Rating |
|
Verdict® + 1% Hasten® 75 A |
Fops |
70 RR |
|
Select® + 1% Hasten® 300 A |
Dims |
55 R |
|
Axial® + 0.5% Adigor® 300 A |
Den |
65 RR |
|
Factor® + 1% Supercharge® 180A |
Dims |
0 S |
|
Hussar® + 1% Hasten® 200 B |
Sulfonylureas |
95 RRR |
Resistance rating: RRR - indicates plants tested have strong resistance; RR- indicates medium- level resistance; R - indicates low- level but detectable resistance; S - indicates no detection of resistance.
Soil pH was 4.5 (0-10 cm and 10-20 cm in CaCl2) prior to applying lime in April 2012. Colwell available P (0-10 cm) was 29 mg/kg, and soil mineral N (0-150 cm) was 87 kg N/ha just before sowing.
The treatments and the relative input cost (risk) categories were as follows:
- Canola (Low: Crusher TT open pollinated variety) target density 40 plants/m2 + (Jockey® + Gaucho®) + 25 kg/ha MAP deep-banded; initial knock-down with 450 g/L glyphosate (Roundup CT®) @ 1.6 L/ha; pre-emergent of 480g/L trifluralin (TriflurX®) @ 2 L/ha; 900g/kg atrazine @ 1.1kg/ha; in-crop herbicide 250 g/kg butroxydim (Factor®) @ 80 g/ha + 900g/kg atrazine @ 0.9kg/ha + Supercharge® @ 1% v/v; insecticide 500 g/kg primicarb (Pirimor®) @ 150 g/ha; top-dressing in-crop = 100 kg/ha ammonium sulphate and 100 kg/ha urea.
- Canola (High: Hyola 505 RR hybrid) target density 40 plants/m2 + (Jockey® + Gaucho®) +100 kg/ha ammonium sulphate + 75 kg/ha MAP + 500 g/l flutriafol (Impact® Endure); initial knock-down with 450 g/L glyphosate (Roundup CT®) @ 1.6 L/ha ; pre-emergent of 480g/L trifluralin (TriflurX®) @ 2L/ha; in-crop herbicide glyphosate (Round-Up Ready®) @ 0.9 kg/ha at 2-3 leaf and 6 leaf stage; insecticide 500 g/kg primicarb (Pirimor®) @ 150 g/ha; top-dressing in-crop = 200 kg/ha urea.
- Lentil (Low: PBA Herald XT) target density 120 plants/m2 + Nodulaid® inoculant + 25 kg/ha MAP deep-banded; initial knock-down with 450 g/L glyphosate (Roundup CT®) @ 1.6 L/ha; pre-emergent 480 g/L trifluralin (TriflurX®) @ 2 L/ha; 900 g/kg simazine @ 0.5 kg/ha; 500 g/L diuron @ 0.6 L/ha; in-crop herbicide 250 g/kg butroxydim (Factor®) @ 180 g/ha + Supercharge® @ 1% v/v; 240 g/L clethodim (Select®) @ 500 ml/ha + Uptake® @ 0.5% v/v; 250 g/L paraquat (Gramoxone®) @ 400 ml/ha + non-ionic surfactant @ 0.1% v/v.
- Lupins (High: Mandelup for grain) target density 40 plants/m2 + Biostacked® inoculum + 75 kg kg/ha MAP deep-banded; initial knock-down with 450 g/L glyphosate (Roundup CT®) @ 1.6 L/ha ; pre-emergent 480g/L trifluralin (TriflurX®) @ 2L/ha; 900 g/kg simazine @ 2.2 kg/ha; in-crop herbicide 250 g/kg butroxydim (Factor®) @ 180 g/ha + Supercharge @ 1% v/v; 250 g/L paraquat (Gramoxone®) @ 400 ml/ha + non-ionic surfactant @ 0.1% v/v.
- Lupins (Low: Mandelup for brown manure) target density 40 plants/m2 + Nodulaid® inoculant + 25 kg/ha MAP deep-banded; initial knock-down with 450 g/L glyphosate (Roundup CT®) @ 1.6 L/ha ; pre-emergent 480g/L trifluralin (TriflurX®) @ 2 L/ha; 900 g/kg simazine @ 1.3 kg/ha; brown-manure herbicide 450 g/L glyphosate (Roundup CT®) @ 2 L/ha + 300 g/L clopyralid (Lontrel®) @ 150 ml/ha + 240 g/L carfentrazone-ethyl (Hammer®) @ 25 ml/ha; fallow maintenance 450 g/L glyphosate (Roundup CT®) @ 2.5L/ha + non-ionic surfactant @ 0.1% v/v.
- Field peas (Low: Morgan for brown manure) target density 40 plants/m2 + Nodulaid® inoculant + 25 kg/ha MAP deep-banded; initial knock-down with 450 g/L glyphosate (Roundup CT®) @ 2.5 L/ha +; pre-emergent 480g/L trifluralin (TriflurX®) @ 2L/ha; 900 g/kg simazine @ 1.0 kg/ha; brown manure herbicide 450 g/L glyphosate (Roundup CT®) @ 2 L/ha + 300 g/L clopyralid (Lontrel®) @ 150 ml/ha + 240 g/L carfentrazone-ethyl (Hammer®) @ 25 ml/ha; fallow maintenance 450 g/L glyphosate (Roundup CT®) @ 2.5L/ha + non-ionic surfactant @ 0.1% v/v.
- Fallow (Low) initial knock-down with 450 g/L glyphosate (Roundup CT®) @ 1.6 L/ha; fallow established September 2012 with an application of 450 g/L glyphosate (Roundup CT®) @ 2 L/ha + metsulfuron-methyl (Ally®) @ 5 g/ha + non-ionic wetting surfactant @ 0.1% v/v, then follow-up with 250 g/L paraquat (Gramoxone®) @ 2 L/ha + non-ionic wetting surfactant @ 0.1% v/v.
- Wheat (Low: Longreach Spitfire) target density 75 plants/m2 + Raxil® + 25 kg/ha MAP (6 kg N/ha) deep-banded; initial knock-down with 450 g/L glyphosate (Roundup CT®) @ 1.6 L/ha ; pre-emergent 480g/L trifluralin (TriflurX®) @ 2L/ha + diuron 500 g/L @ 1 L/ha; in-crop herbicide 800 g/L prosulfocarb +120 g/L s-metalochlor (Boxer Gold®) @ 1.5 L/ha; foliar fungicide 430 g/L tebuconazole (Folicur®) @ 145 ml/ha; top-dressing in-crop 100 kg/ha urea (47 kg N/ha).
- Wheat (High: Longreach Spitfire) target density 150 plants/m2 + Dividend® @ 260 ml/100 kg seed + activist zinc @ 8 L/tonne of seed + 75 kg/ha MAP (16 kg N/ha) deep-banded; initial knock-down with 450 g/L glyphosate (Roundup CT®) @ 1.6 L/ha ; pre-emergent 850 g/kg pyroxasulfone (Sakura® 850WG) @ 118 g/ha + 500 g/L tri-allate (Avadex Xtra®) @ 2 L/ha; in-crop herbicide 800 g/L prosulfocarb +120 g/L s-metalochlor (Boxer Gold®) @ 2.5 L/ha + 100 g/L pinoxaden 25 g/L cloquintocet (Axial®) @ 150ml/ha + adjuvant (Adigor®) @ 0.5% v/v; foliar fungicide 85 g/L pyraclastrobin 62.5 g/L epoxiconazole (Opera®) @ 1 L/ha + non-ionic surfactant @ 0.25% v/v; top-dressing in-crop 200 kg/ha urea (94 kg N/ha).
There were two sowing times in 2012: late April (canola and lupins), mid May (lentil, peas and wheat), the weed-free fallow was commenced in early September.
Results: The efficacy of the various research herbicide treatments used in the Eurongilly experiment (see details described above) are presented in Table 6.
Table 6. Measures of peak shoot dry matter (DM) accumulation of wheat and various break crops grown for grain or brown manure (BM) and other treatments at Eurongilly, NSW in 2012, the cost of ryegrass control measures, and ryegrass DM and panicle numbers. Crops arranged in order of descending ryegrass panicle numbers.
|
Crop & input |
Crop shoot DM |
Costs of grass herbicides |
Ryegrass DM |
Ryegrass panicle number |
|
|
(t/ha) |
($/ha) |
(t/ha) |
(no./m2) |
|
Untreated area |
0 |
0 |
Not available |
1,042 |
|
Wheat - low |
5.0 |
$56 |
1.6 |
504 |
|
Lentils - low |
1.4 |
$67 |
0.6 |
215 |
|
Wheat - high |
8.4 |
$142 |
0.3 |
78 |
|
Lupin - high |
6.5 |
$65 |
0.1 |
43 |
|
Canola - low |
8.3 |
$62 |
Not available |
32 |
|
Canola - high |
12.0 |
$46 |
0 |
0 |
|
Fallow |
- |
$35 |
0 |
0 |
|
Lupin BM - low |
1.9 |
$68 |
2.4 |
Killed before seed set |
|
Pea BM - low |
4.5 |
$66 |
0.7 |
Killed before seed set |
|
LSD (P<0.05) |
1.3 |
- |
0.8 |
147 |
The number of ryegrass panicles measured in late spring were 1,042 per m2 in untreated areas immediately outside the experimental plots, and ranged from 78-504 per m2 under wheat to zero under the RR canola and bare fallow. No viable ryegrass seed was set in 2012 by the brown manure treatments. So cheaper, more effective ryegrass control was achieved in the break crops and fallow compared to the options available for in-crop grass management within wheat (Table 6). The different levels of control will have implications for ryegrass incidence, crop production and profit in 2013.
The GSR in 2012 at Eurongilly was 179mm compared to a long-term average of 329mm, which resulted in reduced shoot DM accumulation (Table 6) and grain yields (Table 7). Canola and lupin grain were more profitable than both wheat treatments with a profit : cost ratio of between 1.9 and 2.6 compared to 0.4 to 0.9 for wheat (Table 7). In contrast to the results from Junee Reefs in 2011, lentil performed poorly at Eurongilly both in terms of yield and gross margin. This may be the result of the low pHca (4.5) in the surface 0-20cm.
Table 7. Comparisons of grain yield, income, variable costs and gross margins of wheat and various break crops grown for grain or brown manure (BM) or fallow at Eurongilly, NSW in 2012. Values in parenthese represent the contribution of input costs to total variable costs. Crops arranged in order of descending gross margin.
|
Crop & input |
Grain yield |
Gross incomea |
Total variable costs |
Gross margin |
Profit/cost ratio |
|
|
(t/ha) |
($/ha) |
($/ha) |
($/ha) |
|
|
Canola - low |
3.0 |
$1,642 |
$450 ($249) |
$1,192 |
2.6 |
|
Canola - high |
3.5 |
$1,947 |
$666 ($427) |
$1,281 |
1.9 |
|
Lupin - high |
3.1 |
$1,011 |
$284 ($168) |
$727 |
2.6 |
|
Wheat - high |
3.2 |
$843 |
$586 ($430) |
$257 |
0.4 |
|
Wheat - low |
2.0 |
$532 |
$283 ($169) |
$250 |
0.9 |
|
Lentils - low |
0.7 |
$297 |
$229 ($132) |
$68 |
0.3 |
|
Fallow |
0 |
0 |
$45 ($35) |
-$45 |
-1.0 |
|
Pea BM - low |
0 |
0 |
$160 ($120) |
-$160 |
-1.0 |
|
Lupin BM - low |
0 |
0 |
$168 ($129) |
-$168 |
-1.0 |
aGrain prices used in the calculations were current at the around the time of harvest and assumed delivery to Junee except RR canola to Stockinbingal (extra freight cost = $5/t) and lentils to Victoria (extra freight cost = $53/t).
Victorian Mallee
Hopetoun, Vic 2009-2011
Aim: To identify low-risk, profitable break crops for the Mallee region and to quantify their benefits to subsequent wheat crops across contrasting soil types and different seasonal rainfall conditions.
Experimental details: The break crop experiment was established on Warrakirri’s ‘Bullarto Downs’ property about 13 km from Hopetoun in 2009 on two different soil types (sand and clay), typical to the region, that were located 2.3km apart. The sand site was located on top of an east-west dune with sandy topsoil and clay subsoil and had grown wheat in 2008 and 2007, and chickpeas in 2006. The clay site was located on a low-lying flat with clay loam topsoil and moderate subsoil constraints, had grown wheat in 2008, chemical fallow in 2007 and barley in 2006.
In December 2008, plots (2.1 x 28m) were pegged out in three separate areas using a split block randomised design with four replicates. The first area (block A) was planted to break crops in 2009, followed by wheat in 2010, 2011 and 2012. The second area (block B) was sown to wheat in 2009, to break crops in 2010 and wheat in 2011 and 2012. The third area (block C) was sown to wheat in 2009 and 2010, to break crops in 2011 and to wheat in 2012 (Table 8).
Table 8. Growing season rainfall (GSR) and crops grown on the three blocks at the sand and clay sites near Hopetoun, Vic. Long-term GSR = 251mm. Values in parentheses represent estimates of GSR as decile equivalents.
Year |
GSR (mm) |
Block A |
Block B |
Block C |
|
2009 |
208 (decile 3) |
Break crops, fallow, or wheat |
Wheat |
Wheat |
|
2010 |
264 (decile 5-6) |
Wheat |
Break crops, fallow, or wheat |
Wheat |
|
2011 |
198 (decile 2-3) |
Wheat |
Wheat |
Break crops, fallow, or wheat |
|
2012 |
150 (decile 1-2) |
Wheat |
Wheat |
Wheat |
Treatments included canola (also mustard in some years, but data is not presented here), field peas, or wheat whose plots were split for grain or hay, vetch plots split for hay or brown manure, and fallow treatments imposed from July (long) or September (short).
Gross margins were calculated for each crop and end-use using the following grain and hay prices:
- 2009: canola = $380/t grain and $200/t hay ; field peas = $264/t grain and $200/t for pea hay ; wheat = $195/t and $150/t for wheaten hay ; vetch hay = $200/t.
- 2010: canola = $514/t grain and $100/t hay ; field peas = $245/t grain and $135/t for pea hay ; wheat = $222/t and $125/t for wheaten hay ; vetch hay = $130/t.
- 2011: canola = $438/t grain and $100/t hay ; field peas = $271/t grain and $150/t for pea hay ; wheat = $144/t for AGP, $153/t for ASW and $150/t for wheaten hay ; vetch hay = $200/t.
- The variable costs used to calculate gross margins included cutting $25-$40/bale; bailing $24-$30/t, urea $530-$650/t, and MAP $780-$905/t depending upon the year.
Results: Mean grain yields and hay production data for each of the three break crop years are presented for both the sand and clay sites in Tables 9 and 10, and gross margins are shown in Figures 3 and 4.
Table 9. Mean grain yield (t/ha) for break crops and wheat grown at sand and clay sites near Hopetoun, Victoria between 2009 and 2011.
Crop |
2009 |
2010 |
2011 |
||||
Sand(t/ha) |
Clay(t/ha) |
Sand(t/ha) |
Clay(t/ha) |
Sand(t/ha) |
Clay(t/ha) |
||
|
Canola |
1.9 |
1.2 |
3.3 |
2.7 |
2.2 |
nda |
|
|
Pea |
0.9 |
0.4 |
3.4 |
1.4 |
2.3 |
2.3 |
|
|
Wheat |
1.8 |
1.5 |
4.4 |
4.9 |
5.4 |
3.2 |
|
|
LSD (P<0.05) |
0.35 |
0.25 |
NS |
1.0 |
0.7 |
0.2 |
|
a Canola grain was unharvestable at clay site due to severe hare damage in 2011.
Table 10. Mean hay production for break crops and wheat grown at sand and clay sites near Hopetoun, Victoria between 2009 and 2011.
Crop |
2009 |
2010 |
2011 |
||||
Sand(t/ha) |
Clay(t/ha) |
Sand(t/ha) |
Clay(t/ha) |
Sand(t/ha) |
Clay(t/ha) |
||
|
Canola |
1.4 |
1.6 |
3.7 |
2.7 |
3.5 |
nda |
|
|
Pea |
2.0 |
2.0 |
5.1 |
2.4 |
3.0 |
3.2 |
|
|
Vetch |
2.4 |
2.3 |
5.9 |
3.9 |
2.5 |
1.0a |
|
|
Wheat |
0.8 |
1.5 |
6.8 |
6.0 |
5.0 |
4.6 |
|
|
LSD (P<0.05) |
0.46 |
0.36 |
1.1 |
2.7 |
1.1 |
1.1 |
|
a Damaged by hares.
Gross margins calculated for all the break crops grown for either grain or hay from 2009-2011 have been profitable at the sand site (Fig. 3). The data indicated that profitable break crop options were still possible in 2009 even though it was a lower yielding season (Tables 9 and 10). Canola gross margins were considerably higher than wheat in 2009 and 2010 which were characterised by having stored soil water, early autumn breaks and high canola prices. Even though vetch brown manure and fallow were not profitable both of these provide exceptionally good non-selective grass weed control.
The clay site also grew profitable break crops between 2009 and 2011 (Fig. 4). Both canola and pea harvested for grain or hay were more profitable than wheat in 2009, gross margins for canola and wheat grain were similar in 2010, and pea grain proved to be more profitable than wheat in 2011. The poor gross margins reported for canola and vetch hay in 2011 at the clay site reflected severe damage of the canola and vetch trial plots by hares.
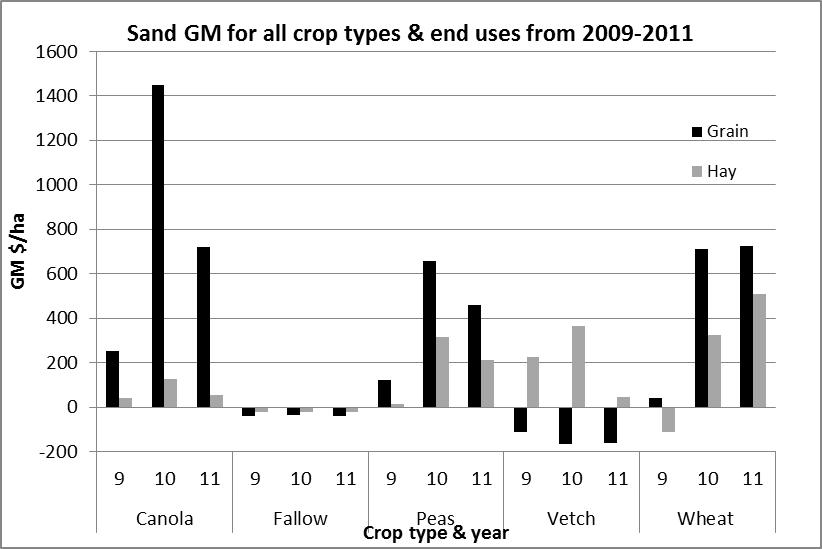
Figure 3. Sand site mean gross margin for each year (2009, 2010 and 2011) for each crop type and end-use. Please note: black columns for the vetch treatment represent brown manure and the grey columns are vetch hay, black columns for fallow represent long fallow [from July] while the grey columns are short fallow [from September].
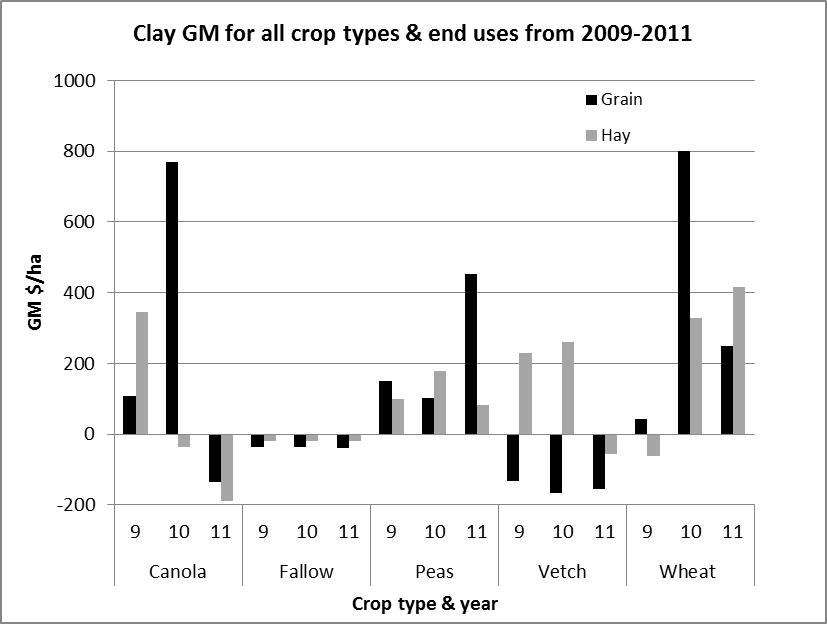
Figure 4. Clay site mean gross margin for each year (2009, 2010 and 2011) for each crop type and end use. Please note: black columns for the vetch treatment represent brown manure and the grey columns are vetch hay, black columns for fallow represent long fallow [from July] while the grey columns are short fallow [from September]). Poor gross margins reported for canola and vetch in 2011 at the clay site reflected severe damage of the trial plots by hares.
Quantifying the effect of break crops on wheat yield and profitability
Southern NSW
Junee Reefs, NSW 2012
First wheat after break crops
Experimental details: Each replicated plot of all the break crop and cereal treatments from 2012 were split and sown to Spitfire wheat mid-May 2012 under either a low or high input regime.
Low input wheat: target density of 75 plants/m2, seed-dressing of Raxil® and a starter fertilizer of 25 kg/ha MAP (3 kg N/ha) deep-banded. The initial knock-down consisted of 450 g/L glyphosate (Roundup CT®) @ 1.6 L/ha + 240 g/L oxyflurofen (Goal®) @ 75 ml/ha + LI700 0.25% v/v and 100 g/L bifentherin (Talstar®) @ 200 ml/ha. In-crop herbicides included 500 g/L terbutryn (Igran®) @ 550 ml/ha, 750 g/L MCPA amine (Agritone 750®) @ 220 ml/ha, and 600 g/kg metsulfuron (Ally®) @ 5 g/ha. Foliar fungicide was 430 g/L tebuconazole (Folicur®) @ 145 ml/ha. The crop was top-dressed with 100 kg/ha urea (46 kg N/ha). Total input cost was $143/ha.
High input wheat : target density of 150 plants/m2, seed-dressing of Dividend® @ 260 ml/100 kg seed + activist zinc @ 8 L/t of seed and a starter fertilizer of 75 kg/ha MAP (8 kg N/ha) + 500g/L fluriafol (Impact® Endure) @ 200 ml/ha deep-banded. The initial knock-down consisted of 450 g/L glyphosate (Roundup CT®) @ 1.6 L/ha + 240 g/L oxyflurofen (Goal®) @ 75ml/ha + LI700 0.25% v/v and 100 g/L bifentherin (Talstar®) @ 200 ml/ha. Pre-emergent IBS was 850 g/kg pyroxasulfone (Sakura® 850WG) @ 118 g/ha. In-crop herbicides included 210 g/L bromoxynil 37.5 g/L pyrasulfotole (Velocity®) @ 1 L/ha and Hasten® @ 1% v/v. Foliar fungicide was 85 g/L pyraclastrobin 62.5 g/L epoxiconazole (Opera®) @ 1 L/ha + non-ionic surfactant @ 0.25% v/v. The crop was top-dressed with 200 kg/ha urea (94 kg N/ha). Total input cost was $379/ha.
Rationale for inclusion of the choice of various inputs in the high input treatment was:
- Higher seeding rates for greater competition with weeds.
- Flutriafol (Impact®) for take-all.
- Difenoconazole + metalaxyl-M (Dividend®) and zinc seed dressing for rhizoctonia.
- More starter fertilizer for early vigour for competition with weeds and root diseases.
- Use of new pre-emergent grass herbicide chemistry.
- Use of new post-emergent broadleaf herbicide chemistry with greater crop safety to maintain competition.
Results: Despite 115mm of rainfall in March 2012, residual effects of some 2011 treatments on soil water reserves were still measured when wheat was sown in May 2012. The stand out break crop treatments were chickpea, the brown-manured field peas, and lupin which had between 40-65mm more soil water (0-160mm) than where wheat had been grown in 2011 (data not shown).
The concentrations of soil mineral N measured in Autumn 2012 were all significantly higher after the 2011 legume treatments than following canola or cereals (Table 11). Trends in soil mineral N were related to, but were not exactly aligned with, net N balances determined in 2011 (Table 1). The enhanced availability of soil N after chickpea may have been related to the high proportion of chickpea N partitioned below-ground in nodules (Khan et al. 2003). In other words, a higher proportion of the chickpea N in residues would have been located below-ground in a form which had high N concentrations (6%N) and low C:N ratio that is conjucive to more rapid decomposition and mineralisation compared to other legume species.
Table 11. Concentrations of soil mineral N (0-160cm) measured just prior to sowing wheat in 2012 at Junee Reefs, NSW following cereals and various break crops grown for grain or brown manure (BM) in 2011. Crops are arranged in order of descending soil mineral N.
|
Crop & relative input cost in 2011 |
Soil mineral N in autumn 2012 (kg N/ha) |
|
Chickpeas - high |
172 |
|
Lupin BM - low |
169 |
|
Pea BM - low |
126 |
|
Lentils - medium |
122 |
|
Lupin - medium |
119 |
|
Wheat - low |
77 |
|
Canola - low |
76 |
|
Canola - high |
69 |
|
Wheat - high |
69 |
|
Barley - low |
59 |
|
LSD (P<0.05) |
35 |
The relative impact of the different 2011 crop treatments on wheat shoot DM accumulation by August 2012 (GS30; stem elongation) was very similar at both input levels applied to wheat; however, the amounts of DM produced were greater for the high input wheat than the low input wheat (Table 12).
The 2011 crop effects on early wheat DM production in 2012 (Table 12) reflected the trends in concentrations of soil mineral N at sowing (Table 11). However, since GSR in 2012 (169mm) was well below the long-term average (300mm), the higher soil water availability after chickpea and the brown-manured legumes could also have contributed to the enhanced DM production in these treatments.
Table 12. Impact of various break crops grown for grain or brown manure (BM) at Junee Reefs, NSW in 2011 on wheat shoot dry matter (DM) at GS30 (stem elongation) in August 2012. Treatments from 2011 are arranged in order of descending shoot DM observed for low input wheat in 2012.
|
Crop & input in 2011 |
Wheat GS30 shoot DM with low input |
Wheat GS30 shoot DM with high input |
|
|
(kg/ha) |
(kg/ha) |
|
Lupin BM - low |
951 |
1558 |
|
Chickpeas - high |
863 |
1386 |
|
Pea BM - low |
860 |
1201 |
|
Lentils - medium |
771 |
1114 |
|
Lupin - medium |
737 |
1195 |
|
Canola - low |
666 |
903 |
|
Wheat - low |
614 |
827 |
|
Barley - low |
495 |
803 |
|
Wheat - high |
439 |
813 |
|
Canola - high |
432 |
1013 |
|
LSD (P<0.05) Same crop in 2011 2011 crop x 2012 input |
149 206 |
|
Although the same general trends observed at GS30 were also apparent in shoot DM measurements at maturity for the low input wheat, the DM difference between the low and high input wheat crops did not persist (Table 13). Given the 1-2 decile GRS, this lack of difference between low and high input treatments in 2012 in maturity DM (Table 13), and grain yields (Tables 14 and 15), combined with the high grain protein contents for most of the 2011 pre-treatments strongly suggest that the higher N fertiliser applications to the high input wheat resulted in ‘haying-off’ primarily following the pulse treatments (van Herwaarden et al.1998).
Table 13. Impact of various break crops grown for grain or brown manure (BM) at Junee Reefs, NSW in 2011 on wheat shoot dry matter (DM) measured at maturity in November 2012. Treatments from 2011 are arranged in order of descending shoot DM observed for low input wheat in 2012.
|
Crop & input in 2011 |
Wheat maturity shoot DM with low input |
Wheat maturity shoot DM with high input |
|
|
(t/ha) |
(t/ha) |
|
Chickpeas - high |
12.2 |
10.7 |
|
Lupin BM - low |
11.2 |
11.1 |
|
Lentils - medium |
11.2 |
10.9 |
|
Pea BM - low |
11.0 |
11.1 |
|
Lupin - medium |
10.8 |
10.9 |
|
Canola - low |
10.3 |
10.2 |
|
Wheat - high |
10.0 |
10.4 |
|
Wheat - low |
9.4 |
9.9 |
|
Canola - high |
9.2 |
10.6 |
|
Barley - low |
8.7 |
10.4 |
|
LSD (P<0.05) Same crop in 2011 2011 crop x 2012 input |
1.0 1.1 |
|
Table 14. Comparisons of grain yields and protein content, income, gross margins and production costs for wheat grown with low input costs ($143/ha) and total variable costs ($315) at Junee Reefs, NSW in 2012 following cereals and various break crops grown for grain or brown manure (BM) in 2011. Values in parentheses represent grain %protein. Crop 2011 pre-treatments are arranged in order of descending 2012 gross margin.
|
Crop & input in 2011 |
Grain yield and protein |
Gross incomea |
Gross margin |
Profit/cost ratio |
Production costs |
|
|
(t/ha) or (%) |
($/ha) |
($/ha) |
|
($/t) |
|
Lupin BM - low |
4.0 (13.6%) |
$1,218 |
$902 |
2.9 |
$79/t |
|
Pea BM - low |
4.1 (12.3%) |
$1,176 |
$861 |
2.7 |
$77/t |
|
Chickpeas - high |
4.0 (12.4%) |
$1,166 |
$851 |
2.7 |
$78/t |
|
Lupin - medium |
3.9 (12.4%) |
$1,136 |
$821 |
2.6 |
$80/t |
|
Lentils - medium |
4.0 (11.2%) |
$1,079 |
$764 |
2.4 |
$78/t |
|
Wheat - high |
3.5 (11.0%) |
$933 |
$617 |
2.0 |
$91/t |
|
Canola - high |
3.6 (9.8%) |
$896 |
$581 |
1.8 |
$88/t |
|
Canola - low |
3.4 (9.8%) |
$861 |
$545 |
1.7 |
$92/t |
|
Wheat - low |
3.4 (9.9%) |
$855 |
$540 |
1.7 |
$92/t |
|
Barley - low |
3.4 (10.3%) |
$852 |
$537 |
1.7 |
$93/t |
|
LSD (P<0.05) Grain yield Grain % protein |
0.3 0.8 |
- |
- |
- |
- |
Table 15. Comparisons of grain yields and protein content, income, gross margins and production costs for wheat grown with high input costs ($379/ha) and total variable costs ($556) at Junee Reefs, NSW in 2012 following cereals and various break crops grown for grain or brown manure (BM) in 2011. Values in parentheses represent grain %protein. Crop 2011 pre-treatments are arranged in order of descending 2012 gross margin.
|
Crop & input in 2011 |
Grain yield and protein |
Gross incomea |
Gross margin |
Profit/cost ratio |
Production costs |
|
|
(t/ha) or (%) |
($/ha) |
($/ha) |
|
($/t) |
|
Pea BM - low |
3.8 (14.1%) |
$1,155 |
$598 |
1.1 |
$147/t |
|
Chickpeas - high |
3.7 (13.9%) |
$1,139 |
$583 |
1.0 |
$149/t |
|
Lupin BM - low |
3.7 (15.1%) |
$1,127 |
$571 |
1.0 |
$151/t |
|
Lupin - medium |
3.7 (13.7%) |
$1,117 |
$561 |
1.0 |
$152/t |
|
Lentils - medium |
3.8 (12.9%) |
$1,114 |
$558 |
1.0 |
$144/t |
|
Wheat - low |
3.8 (11.7%) |
$1,083 |
$527 |
0.9 |
$148/t |
|
Canola - high |
3.9 (9.8%) |
$1,054 |
$498 |
0.9 |
$142/t |
|
Canola - low |
3.8 (11.3%) |
$1,013 |
$456 |
0.8 |
$147/t |
|
Barley - low |
3.7 (11.0%) |
$1,004 |
$448 |
0.8 |
$149/t |
|
Wheat - high |
3.7 (11.2%) |
$998 |
$442 |
0.8 |
$150/t |
|
LSD (P<0.05) Grain yield Grain % protein |
NS 1.3 |
- |
- |
- |
- |
The gross margins and profit:cost ratios calculated for the low input wheat in 2012 were greater than that achieved by the high input wheat for the same 2011 pre-crop treatments, reflecting the lower production costs in a dry cropping year (compare Tables 14 and 15).
Calculations across the 2 years of the experiment indicated that the average annual gross margins fell into three distinct groups (Table 16). The sequences with the highest average annual gross margins (all >$600/ha per year) involved break crops in 2011. These break crop-wheat sequences generally had higher profit:cost ratios than the second cohort (average annual gross margins between $450-$600/ha per year) which was dominated by cereal-wheat sequences. The final group (average annual gross margins between <$400/ha per year) were the brown manure legumes-wheat sequences despite these treatments exhibiting some of the highest wheat gross margins in 2012 (Table 16).
Table 16. Comparisons of the mean annual gross margins ($/ha) calculated for different crop sequences from two years of experimental data from Junee Reefs, NSW in 2011 and 2012. Crop sequences are arranged in order of descending average annual gross margin.
|
Crop & input in 2011 |
Crop & input in 2012 |
Gross margin in 2011a |
Gross margin in 2012b |
Average annual gross margin |
2 year Profit/cost ratio |
|
|
|
($/ha) |
($/ha) |
($/ha) |
|
|
|
|
|
|
>$600/ha |
|
|
Canola - low |
Wheat - low |
$1,199 |
$545 |
$872 |
2.5 |
|
Canola - low |
Wheat - high |
$1,199 |
$456 |
$828 |
1.8 |
|
Canola - high |
Wheat - low |
$1,033 |
$581 |
$807 |
1.8 |
|
Canola - high |
Wheat - high |
$1,033 |
$498 |
$766 |
1.4 |
|
Lentils - medium |
Wheat - low |
$710 |
$764 |
$737 |
2.3 |
|
Lupin - medium |
Wheat - low |
$455 |
$821 |
$638 |
2.0 |
|
Lentils - medium |
Wheat - high |
$710 |
$558 |
$634 |
1.5 |
|
Chickpeas - high |
Wheat - low |
$386 |
$851 |
$619 |
1.7 |
|
|
|
|
|
$450-$600/ha |
|
|
Wheat - high |
Wheat - low |
$511 |
$617 |
$564 |
1.0 |
|
Barley - low |
Wheat - low |
$559 |
$537 |
$548 |
1.6 |
|
Lupin - medium |
Wheat - high |
$455 |
$561 |
$508 |
1.2 |
|
Barley - low |
Wheat - high |
$559 |
$448 |
$503 |
1.1 |
|
Chickpeas - high |
Wheat - high |
$386 |
$583 |
$485 |
1.0 |
|
Wheat - low |
Wheat - low |
$425 |
$540 |
$482 |
1.5 |
|
Wheat - high |
Wheat - high |
$511 |
$442 |
$476 |
0.6 |
|
Wheat - low |
Wheat - high |
$425 |
$527 |
$476 |
1.1 |
|
|
|
|
|
<$400/ha |
|
|
Lupin BM - low |
Wheat - low |
-$150 |
$902 |
$376 |
1.6 |
|
Pea BM - low |
Wheat - low |
-$139 |
$861 |
$361 |
1.6 |
|
Pea BM - low |
Wheat - high |
-$139 |
$598 |
$229 |
0.7 |
|
Lupin BM - low |
Wheat - high |
-$150 |
$571 |
$211 |
0.6 |
a Derived from Table 2
b Derived from Tables 14 and 15
Wagga Wagga, NSW 2012
First wheat after break crops
Experimental details: Each replicate plot of each 2011 treatment was sown to wheat in 2012. Supplementary N fertilizer was only applied to one of the wheat on wheat treatments (Table 3). This consisted of 50 kg/ha of urea (23 kg N/ha) applied at sowing, with another 100 kg/ha of urea (46 kg N/ha) top-dressed in-crop at tillering. This represented the total application of 69 kg N/ha which contributed an additional $98/ha to the total variable costs of $343/ha to grow wheat at the trial site.
Results: The GSR in 2012 at the Wagga trial site was 188mm which represented a decile 1 growing season, although total annual rainfall of 561mm was close to average due to 193mm of rain in March. The application of additional fertiliser N significantly increased wheat on wheat grain yields from 2.4 t/ha to 3.5 t/ha, but there were no significant difference between the yield achieved by the N fertilised treatment and any of the sequences where break crops had been grown in 2011 (Table 17). Gross margins of all break crop-wheat sequences were higher (from ~$60/ha up to $370/ha), and costs of production markedly lower (by $24-$34/t), than both wheat on wheat treatments (Table 17).
Calculations across the 2 years of the experiment indicated that only the average annual gross margins for canola-wheat exceeded that of the N-fertilised wheat on wheat, but all break crops options except the brown manure pea in 2011 were determined to have higher average annual gross margins than the unfertilised wheat on wheat (Table 18).
Table 17. Comparisons of gain yield, income, gross margins, and production costs for wheat grown at Wagga Wagga, NSW in 2012 following different crops in 2011. Crop sequences are arranged in order of descending 2012 gross margin.
|
Crop sequence 2011 - 2012 |
Wheat yield |
Gross incomea |
Gross marginb |
Profit/cost ratio |
Production costs |
|
|
(t/ha) |
($/ha) |
($/ha) |
|
($/t) |
|
Pea brown manure - Wheat |
3.7 |
$1,010 |
$667 |
1.9 |
$92/t |
|
Canola - Wheat |
3.5 |
$942 |
$599 |
1.7 |
$98/t |
|
Pea - Wheat |
3.5 |
$942 |
$599 |
1.7 |
$98/t |
|
Lupin - Wheat |
3.4 |
$905 |
$562 |
1.6 |
$102/t |
|
Wheat - Wheat (+70kgN/ha) |
3.5 |
$945 |
$504 |
1.1 |
$126/t |
|
Wheat - Wheat (nil N) |
2.4 |
$640 |
$297 |
0.9 |
$145/t |
|
LSD (P<0.05) |
0.40 |
- |
- |
- |
- |
a Grain prices were current at the around the time of harvest and assumed local delivery.
bVariable costs used to calculate gross margins were derived from NSW DPI farm budget book published in 2012 (Dryland south-east winter crop gross margins: http://www.dpi.nsw.gov.au/agriculture/farm-).
Table 18. Comparisons of the mean annual gross margins ($/ha) calculated for different crop sequences from two years of experimental data from Wagga Wagga, NSW in 2011 and 2012. Crop sequences are arranged in order of descending average annual gross margin.
|
Crop sequence |
Gross margin in 2011a |
Gross margin in 2012b |
Average annual gross margin |
2 year Profit/cost ratio |
|
|
($/ha) |
($/ha) |
($/ha) |
|
|
Canola - Wheat |
$649 |
$599 |
$624 |
1.6 |
|
Wheat - Wheat (+70kgN/ha) |
$447 |
$504 |
$476 |
1.2 |
|
Pea - Wheat |
$257 |
$599 |
$428 |
1.3 |
|
Lupin - Wheat |
$232 |
$562 |
$397 |
0.7 |
|
Wheat - Wheat (nil N) |
$447 |
$297 |
$372 |
1.1 |
|
Pea brown manure - Wheat |
-$235 |
$667 |
$216 |
0.7 |
a Derived from Table 4
b Derived from Table 17
Victorian Mallee
Hopetoun, Vic 2010-2012
A summary of yields and gross margins are provided below for all wheat treatments grown following break crops in 2010 and 2011, but detailed data are presented in tabular form or as figures only for wheat grown in 2012 one or two years after break crop treatments.
First wheat after break crops
2010: Because root diseases and water availability did not limit growth in 2010, differences in soil N created by the different crops were the major determinant of yield and protein responses. The grain yields of wheat in vetch-wheat (5.5 t/ha) and pea-wheat (5.4 t/ha) sequences yielded significantly more than canola-wheat (4.8 t/ha) or wheat-wheat (4.7 t/ha; LSD = 0.3 t/ha at P< 0.05) at the sand site. There was no significant effect of previous crop type on wheat yield at the clay site (5.6-6.0 t/ha) and no significant effect of end-use of the break crop on wheat yield at either site. Wheat grain protein was highest following peas at both sites (10.0% cf 9.4% wheat on wheat at the sand site,11.5% cf 10.7% wheat on wheat at the clay site) reflecting the higher levels of mineral N. The average annual gross margins for wheat grain grown after canola grain ($747/ha), pea hay ($707/ha), vetch hay ($726/ha), vetch brown manure ($622/ha), or pea grain ($619/ha) were all higher than wheat-wheat ($505/ha) or fallow-wheat (average $525/ha) at the sand site. At the clay site wheat grain after pea hay was the sequence with the highest average annual gross margin ($932/ha) followed by wheat after canola grain ($783/ha), pea grain ($768/ha), or fallow ($745/ha), compared to wheat on wheat ($704/ha).
2011: At the sand site, wheat grown in 2011 yielded more where brassica or legume break crops had been grown in 2010 (3.0-3.4 t/ha) than wheat-wheat or fallow-wheat (2.5 t/ha; LSD = 0.4 t/ha at P<0.05), but there was no significant effect of any treatment on grain protein (11.5-12.0%). At the clay site, wheat following vetch and peas (4.0 t/ha) yielded more than wheat following canola (3.3 t/ha), wheat-wheat (3.6 t/ha), or fallow-wheat (3.1 t/ha; LSD = 0.4 t/ha at P<0.05). However, grain protein after fallow (13.2%) was significantly higher than wheat grown after break crops (12.7-12.8%) and wheat on wheat (12.4%; LSD = 0.4% at P<0.05). There was no significant effect of break crop end-use (hay, grain, brown manure) at either site. A combination of the high gross margins achieved by canola and pea grain in 2010 (Fig. 3), and the rotational benefits of canola and peas described above meant that the average annual gross margins for canola-wheat and field pea-wheat sequences were higher than wheat-wheat at the sand site. Since the gross margins for canola and wheat grain crops were similar in 2010 at the clay site (Fig. 4), the average annual gross margins achieved by canola-wheat and wheat-wheat sequences were also calculated to be similar.
2012: Break crop type and end-use in 2011 both had a large effect on wheat grain yield in 2012. Wheat yield increased when grown following the vetch brown manure, fallow, or pea and canola grain crops at the sand site; and following brown-manured vetch, fallow and the pea grain crop at the clay site (Table 19). Wheat also yielded more following pea, canola, vetch and wheaten hays at both the sand and clay sites, which was likely to be due to carry-over of residual plant-available soil water from earlier termination of these crops in 2011 into the dry 2012 growing season (Table 8).
Table 19. Mean 2012 wheat grain yield when grown following various crops and end-uses in 2011.
2011 Crop |
Sand |
Clay |
||
Grain(t/ha) |
Hay(t/ha) |
Grain(t/ha) |
Hay(t/ha) |
|
|
Canola |
4.5 |
5.4 |
1.9 |
3.4 |
|
Fallow |
5.2* |
5.4** |
4.2* |
4.2** |
|
Peas |
4.9 |
5.6 |
3.1 |
4.0 |
|
Vetch |
5.3^ |
5.4 |
4.0^ |
4.4 |
|
Wheat |
3.9 |
5.2 |
2.4 |
3.8 |
|
LSD (P<0.05) Crop type x end-use |
0.6 |
0.6 |
||
* Long fallow, ** Short fallow, ^Vetch brown manure
At the sand site canola grain, vetch hay and pea hay followed by wheat were as profitable as continuous wheat (Fig. 5). A break in the rotation using these crop types was more sustainable in terms of root and foliar diseases and herbicide resistance than continuous wheat. Wheaten hay followed by wheat grain was a profitable crop sequence at both sites. This was largely due to good hay prices in 2011, above average grain yields (thanks to extra plant-available soil water) and strong grain prices in 2012. At the clay site, the 2011 canola was badly damaged by hares and was not harvestable. As a consequence, the gross margin calculations depicted in Figure 5 assumed that canola yielded 50 % of wheat at that site in that year. The result was that all sequences involving break crops or fallow were at least as profitable as wheat on wheat grain production (Fig. 5).
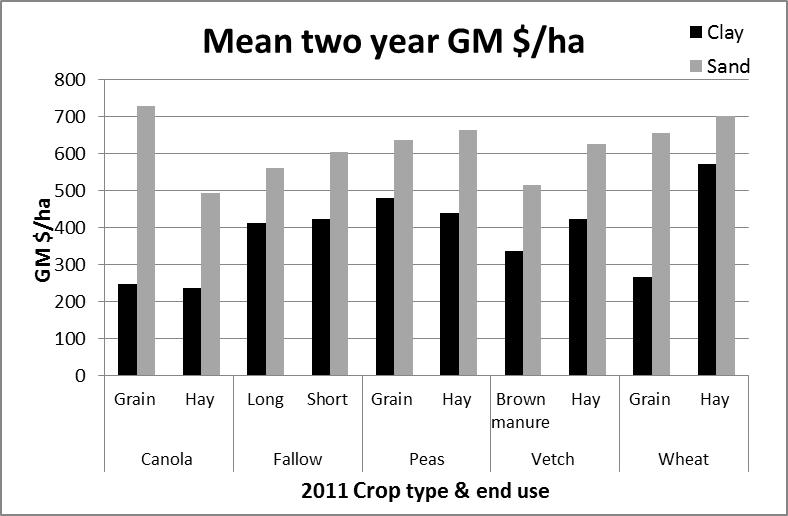
Figure 5. The sand and clay site mean annual gross margins ($/ha) calculated from two years of experimental data representing fallow or crop type and end-use in 2011 followed by wheat in 2012.
Wheat two years after break crop
2011: Wheat grown two years after vetch (3.0 t/ha) yielded more than wheat grown two years after peas (2.5 t/ha), canola (2.4 t/ha), wheat or fallow (2.3 t/ha) at the sand site (LSD = 0.2 t/ha at P<0.05), which reflected the greater N inputs by vetch in 2009. At the clay site, there were no significant differences in yield or protein between break crop treatments (2.7-3.0 t/ha) and continuous wheat (2.8 t/ha), possibly reflecting the higher N fertility at that site.
At the sand site, the average annual gross margins for two wheat grain crops following canola grain, pea hay or vetch hay were between $145-$170/ha higher, and two wheat grain crops following pea grain or vetch brown manure were $80-$90/ha higher, than continuous wheat ($350/ha). At the clay site average annual gross margins calculated for all break crop options and end-uses except vetch brown manure were between $40-$220/ha higher than three years of continuous wheat ($500/ha).
2012: At the sand site, wheat yielded up to 0.7 t/ha higher following canola, peas, vetch and fallow than continuous wheat, but there was no effect of crop end-use on subsequent wheat yield. There was no effect of 2010 break crops or end-use on 2012 wheat yield at the clay site (Table 20).
Table 20. Mean 2012 wheat grain yield (averaged for end-use) when grown after various crops in 2010.
2010 Crop |
Sand(t/ha) |
Clay(t/ha) |
|
Canola |
3.1 |
2.4 |
|
Fallow |
3.1 |
2.5 |
|
Peas |
3.4 |
2.3 |
|
Vetch |
3.3 |
2.3 |
|
Wheat |
2.6 |
2.4 |
|
LSD (P<0.05) |
0.4 |
NS |
The average annual gross margins calculated from three years of experimentation showed that canola grain followed by two wheat crops was substantially more profitable at both sites (by ~$100-$200/ha per year) than continuous wheat grain crops (Fig. 6). This was driven by strong canola prices and yields in 2010. The only other sequence to have a higher mean annual gross margin than continuous wheat was pea grown for grain -wheat -wheat at the clay site (Fig. 6).
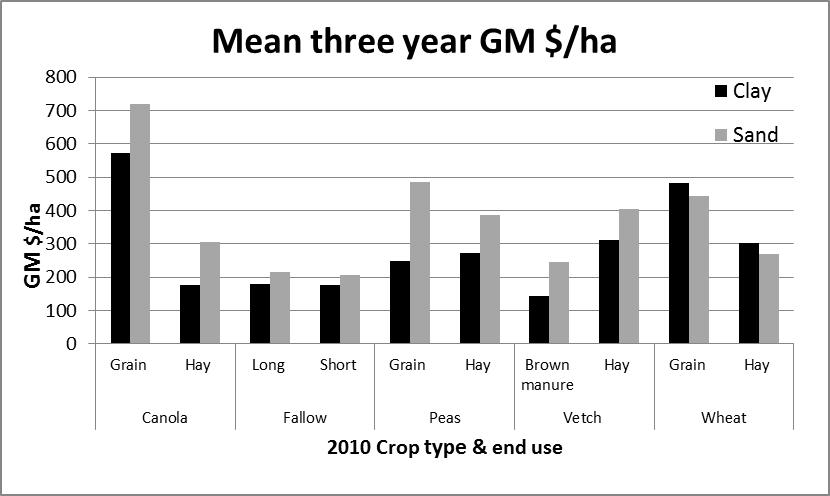
Figure 6. The sand and clay site mean annual gross margins ($/ha) based on three years of experimental data representing crop type and end-use grown in 2010 followed by wheat in 2011 and wheat in 2012.
Conclusions
Research trials in southern NSW and the Victorian Mallee indicate that brassica and legume break crops were frequently as profitable, and in a number of instances considerably more profitable, than wheat. Sequences with canola were largely profitable due to the high returns from canola itself, while crop sequences involving legume hay in the Mallee largely more profitable due to increased subsequent wheat yields.
Wheat following break crops had lower costs of production and was consistently more profitable than wheat on wheat. Crop sequences with a break crop were more sustainable in terms of root diseases and N inputs than continuous wheat, and provided cheaper, more effective strategies for controlling herbicide resistant ryegrass. Brown manured legumes achieved excellent grass weed control, provided high N inputs and residual carry-over of soil water which greatly enhanced the yield of following wheat crops, but the increased yields were insufficient to fully compensate for the loss of income in the first year.
Break crop choice and selection should be based on individual farm management and ability to manage the various break crops options in the rotation. If growers remain flexible in break crop and end-use decisions, and make suitable choices, risks associated with producing them can be greatly reduced.
Acknowledgements
We thank the GRDC for financial support. We are also indebted to Bernard and Rob Hart at Junee Reefs, Tom, Simon, Angus and Emma Brabin at Eurongilly, the Graham Centre, and the Warrakirri Group for allowing us access to their land to establish on-farm experimental trials.
References
Angus JF, Peoples MB, Kirkegaard JA, Ryan MH, Ohlander L (2008) The value of break crops for wheat. Proc. 14th Australian Agronomy Conference, 21-25 September, Adelaide. www.agronomy.org.au
Angus J, Kirkegaard J, Peoples M, Ryan M, Ohlander L and Hufton L (2011) A review of break-crop benefits of brassicas. In: Proc. 17th Australian Research Assembly on Brassicas, Wagga Wagga, NSW, Australia, pp. 123-127.
Khan DF, Peoples MB, Schwenke GD, Felton WL, Chen D, Herridge DF (2003) Effects of below-ground nitrogen on N balances of field-grown fababean, chickpea and barley. Australian Journal of Agricultural Research 54, 333-340.
Kirkegaard JA, Hunt JR (2010) Increasing productivity by matching farming system management and genotype in water-limited environments. Journal of Experimental Botany 61, 4129-4143.
Kirkegaard JA, Christen O, Krupinsky J, Layzell D (2008) Break crop benefits in temperate wheat production. Field Crops Res. 107, 185-195.
Peoples MB, Brockwell J, Herridge DF, Rochester IJ, Alves BJR, Urquiaga S, Boddey RM, Dakora FD, Bhattarai S, Maskey SL, Sampet C, Rerkasem B, Khan DF, Hauggaard-Nielsen H, Jensen ES (2009) The contributions of nitrogen-fixing crop legumes to the productivity of agricultural systems. Symbiosis 48, 1–17.
Unkovich MJ, Baldock J, Peoples MB (2010) Prospects and problems of simple linear models for estimating symbiotic N2 fixation by crop and pasture legumes. Plant and Soil 329, 75-89.
van Herwaarden AF, Farquhar GD, Angus JF, Richards RA, Howe GN (1998) ‘‘Haying-off’’, the negative grain yield response of dryland wheat to nitrogen fertilizer. I. Biomass, grain yield and water use. Australian Journal of Agricultural Research 49, 1067–1081.
Contact details
Mark Peoples
CSIRO Plant Industry, GPO Box 1600 Canberra ACT 2601
mark.peoples@csiro.au
Was this page helpful?
YOUR FEEDBACK