Changing my livestock cropping mix
Author: Cam Nicholson | Date: 31 Jul 2012
Cam Nicholson
Nicon Rural Services
GRDC Code: Grain and Graze 2
Keywords: risk, mixed farming, whole farm analysis
Take home messages
- Cropping and livestock enterprises have different risk profiles
- Successful integration of livestock and cropping can decrease the probability of downside risk but often comes at the expense of larger profits.
- There is no reward without taking some risk, but the level of risk is a personal choice by the farmer
Introduction
Mixed farming can be a useful way of changing the risk profile of a farming business. Intuitively we would believe that cropping has greater risk and potentially greater returns in the long run compared to livestock enterprises. Analysis using averages for prices, yields and costs generally supports this conclusion. However such analysis tells us nothing about the risk contained in each enterprise, or when combined.
One component of the Grain and Graze 2 program is to support farmers, advisers and consultants in understanding the income volatility and risk profile of their farming business. The activity is intended to help explore your current level of risk and what impact changes to enterprise mix or improvements within an enterprise may have on this risk.
The analysis conducted is not intended to determine the optimum crop and livestock mix. This is an individual decision based on many things including soils and climatic conditions, your skills, personal preference, stage in life, debt levels, succession and importantly the amount of risk you wish to take on. What we want to do is to explore the implications of major enterprise changes to help inform some big picture questions. The answer to these questions will be unique – different for every individual.
A few concepts related to risk
Risk is a natural and accepted part of farming. When we talk about risk most of us immediately think about the negative consequences if an action goes bad. This is only one aspect of risk. The other side is the opportunities that taking a risk offers.
The word risk is derived from Italian word risicare, which means 'to dare'. This implies there is opportunity. It also implies a choice. As individuals we decide how much risk we expose ourselves to by making choices.
The most common definition of risk is likelihood by consequence. In other words risk is how often an event happens (the frequency) and what is the impact (the value) when it does happen.
There are two broad types of risk in farming that we need to consider, business risk (which includes a full range of production, weather, price and human risks) and financial risk (gearing, debt/equity). Financial risk can exacerbate business risk. The analysis presented in this paper is focussed on part of the business risk (price, yield and costs).
There is no reward without risk. Risk is a necessary part of making returns. You can make decisions to reduce risk, but it usually comes at a price, namely lower returns. Managing risk is about making decisions that trade some risk for some return. The challenge is that human beings usually want both – high returns and low risk. This is not easy to achieve.
Remember everyone has a different position on risk and this position will constantly change. Importantly no position is right or wrong, it is what you, the farmer, is prepared to live with. The right level of risk is when the head, heart and gut are comfortable.
Finally when we take a position on risk it may not turn out as we expected. In hindsight you might think it was the wrong decision. In reality the best you can do is make sure the decision you make is a good decision. A good decision is right for you, your business, your family and your stage in life given the information at hand. It is an informed decision where you appreciate the consequences and will have the least regret if it goes bad. Whether it is the ‘right’ decision is a matter of time (in hindsight). To be seen as a good decision, we need to increase our chances of a favourable outcome, that improves our options and provides pleasure or reward. Good analysis and good discussion helps to make a good decision.
Quantifying the production and price risks
The risk analysis in the Grain and Graze 2 program helps to quantify the risk in the business. Historically when we wanted to compared different options we would conduct analysis using average values, such as the average price of grain, the average expected yield and the average expected costs. So to work out our expected profit we would use the average yield by the average price less the average costs. This type of analysis is OK if we get the average values, but in agriculture we rarely do!
If we are uncertain of a value or a result, we can test the calculation with a couple of values either higher or lower than the average (scenario analysis). The problem with most scenario analysis is the values do not have a frequency with them (how often this value happens) and when we change a value, we assume all other variables remain the same.
The key drivers in agriculture, namely yield, prices and some costs have a range of values over time. If we use the average method, it usually over estimates the profits and hides the volatility in those profits.
Managing risk is not about the middle or the expected, it is the opposite - it's what happens at the extremes that's important. This includes managing for the inevitable poor results but equally important is what we do when we get a good result.
The analysis in Grain and Graze 2 uses ranges and probabilities for prices, yields and some costs to calculate the range in profits for a farm. It shows
- how big or small the profit is when the extremes in yields, prices and costs occur
- how often it occurs
- which of these variables is contributing the most to the volatility and the extremes
This makes the analysis more realistic because it combines a value (how big or small) with a likelihood (how often). This builds context and helps us understand exposure and risk. With this information we can then start the conversation.
An example
Consider a 1070 ha farm in South West Victoria running meat sheep and cropping (wheat, barley, canola). They crop 430 ha, but consider 210 ha 'marginal' cropping country. Using average Figures for livestock production, grain yield, price and costs, the average profitability is $258/ha. Cropping makes a higher average profit than the sheep operation. But this analysis tells us nothing about risk.
Intuitively we would think the cropping operation is more risky than the other enterprises. But how much more risky?
The analysis shows there is a big expected range in profit around the average $258/ha (Figure 1). The odds are that one year in 10 the farm will make at least $490/ha and that one year in 10 it will make $33/ha or less.
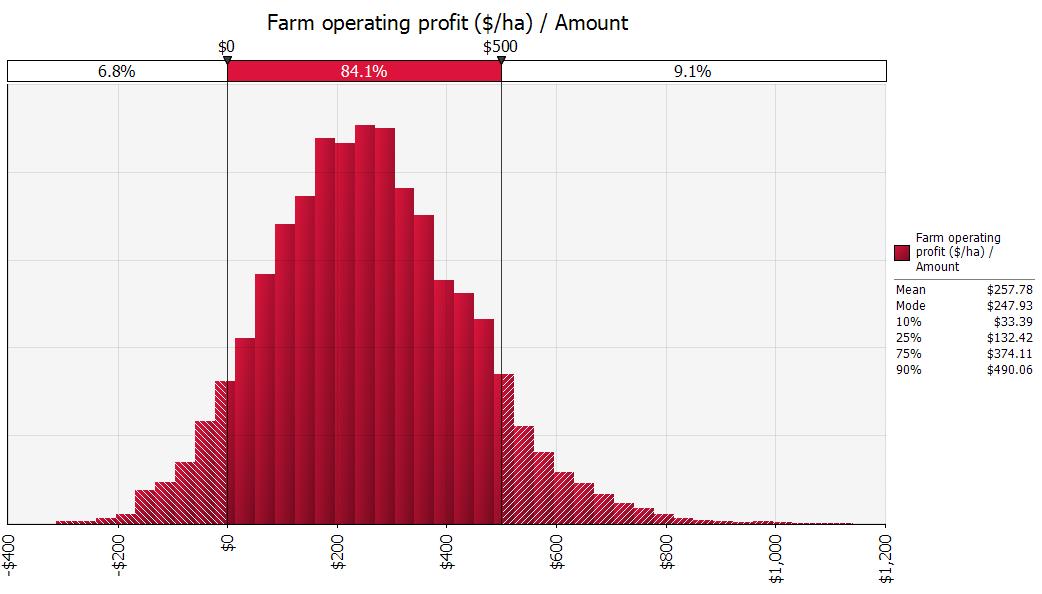
Figure 1: Distribution of farm profit ($/ha).
This information allows us to have an informed discussion about profit, the ranges in profits and what contingency plans we have in place to cope with this variability. We are in a better position to manage the risks (both good and bad) if we chose to do so. It also puts previous profits into perspective e.g. we have just had a run of three above average years so the odds of a poor year have increased. Importantly we can talk about whether these possible outcomes are going to meet your business and personal goals and whether you can sleep at night!
There is a 6.8% chance (one year in 15) that a profit will not be achieved. It doesn't mean every 15 years we will have a loss. We could get a run of poor years and multiple losses in a row, but at least it enables us to frame the odds of these poor years occurring.
When the two enterprises are analysed separately, the volatility of income between enterprises becomes apparent (Figure 2).
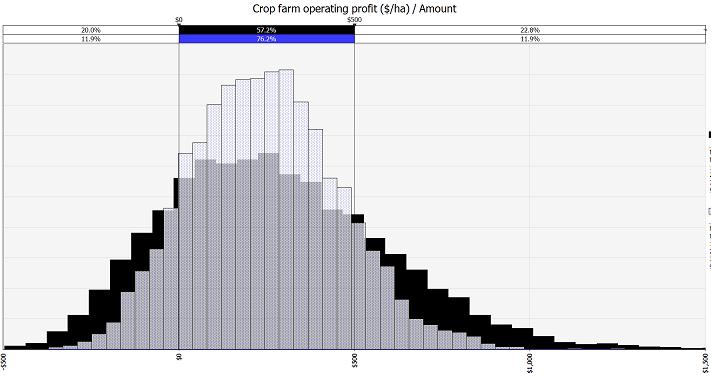
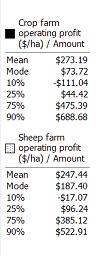
Figure 2 Distribution of enterprise profit for cropping and sheep ($/ha).
The analysis shows the cropping profit distribution is more variable or volatile than the sheep profit distribution (as expected). One year in 10 we could expect the cropping enterprise to achieve at least $689/ha but only $523/ha with the sheep enterprise. On the flip side we could expect a poor one year in 10 result to make a loss of $111/ha for the cropping enterprise but a loss of only $17/ha for the sheep enterprise. There is a one year in five chance of not making any profit with the cropping, but a one year in eight chance with the sheep.
The importance of diversity is evident in these Figures. By combining the two enterprises we have reduced our chances of not making a loss. The odds have reduced from one year in five (if we were all crop) and one year in seven (if we were all sheep) to one year in 15 when combined. The odds are one enterprise will be doing OK when the other falters. But we have achieved this by reducing our chances of making big profits.
Choosing to 'take the punt' and go all cropping hoping the big returns are realised is a valid choice. So is choosing to go for more sheep.
The analysis also enables us to examine what are the key drivers that influence the range (volatility) in profits and which are causing the downside and upside risk. In the above analysis there are many distributions, but some are more influential than others. The number of lambs weaned for ewes joined in having the greatest influence on the volatility in income and downside risk, followed by the grain yields on the 'marginal' cropping country.
We can examine scenarios to improve the lambs weaned for ewes joined, say by increasing the 'poor' lambing results by 20% (Figure 3). We can also examine what would happen if we put the 'marginal' cropping country into sheep (Figure 4).
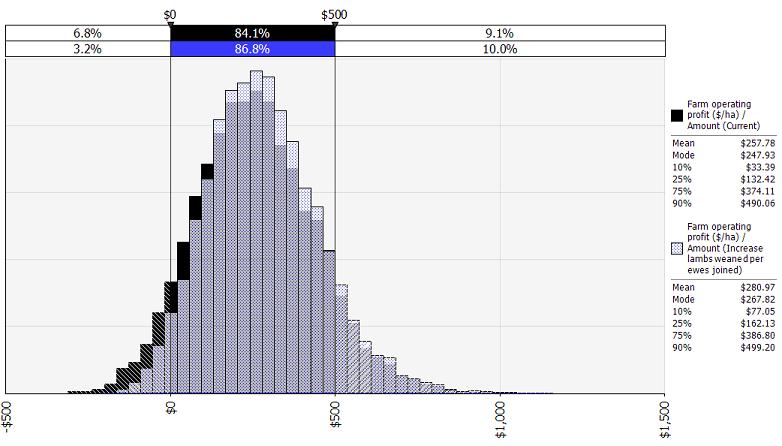
Figure 3: Distribution of enterprise profit by increasing lambs weaned for ewes joined in 'poor' years by 20% ($/ha).
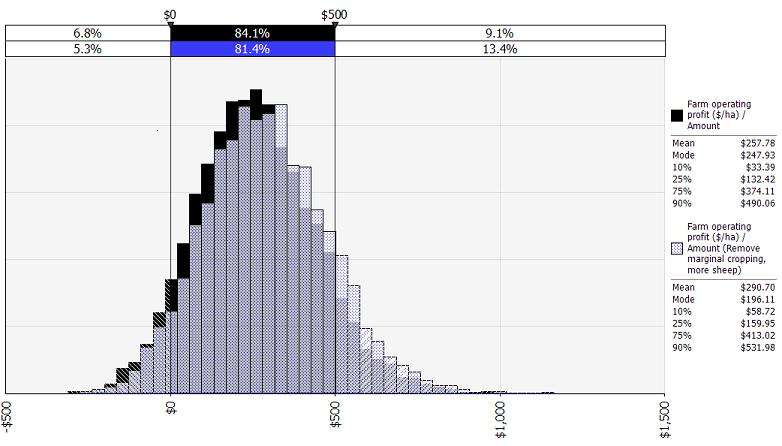
Figure 4: Distribution of enterprise profit by replacing 'marginal' cropping country with sheep ($/ha).
The analysis shows spending effort on improving lamb losses does not affect the overall profit distribution as much as putting the marginal cropping land under grazing. But it does halve the chances of making a loss. Running livestock on the cropping country doesn't greatly affect the probability of a loss but it does increase the chances of bigger profits.
It is critical to realise the analysis does not suggest how you make this transition or even if the transition is achievable. Cash flow implications, machinery that may be under-utilised, purchase of livestock, pasture re-sowing, time frames, etc. all need to be worked out. However we are now in a position to understand the long term implications of change to the business so you can decide what you are comfortable to live with.
The GRDC are developing a range of farm business management activities, including the use of whole farm risk analysis as part of the Advancing Profitable Farming Systems investment theme (2012-2017). These activities will be available to consultants and advisers in the near future.
A final word
Arguably the most important part of risk in farming is the human side. My experience would suggest the emotions, aspirations, goals, preferences and fears of individuals are more important in influencing an individual's position on risk than any economic analysis. Your consultant, adviser and banker need to understand and appreciate this and conduct conversations at this level.
Contact details
Cam Nicholson,
Nicon Rural Services
nicon@pipeline.com.au0417 311 098
GRDC Project Code: Grain and Graze 2,
Was this page helpful?
YOUR FEEDBACK