COST EFFECTIVE P AND ZN NUTRITION
| Date: 16 Sep 2009
Managing phosphorus (P) nutrition is a bit like managing financial resources; there is a difference between cash on hand and assets held, as farmers are all too aware. The soluble P that young plants draw on is like cash on hand, while Colwell P is like assets held. The relationship between soluble P and Colwell P varies with soil type and is called ‘P buffering capacity’. This is not cheap and simple to measure in the lab so we use the now commonly available PBI test as a guide to how much P is likely to be readily available. The practical consequence for farmers is that the soil test P level that gives maximum yields will vary between soil types, probably in the range of Colwell P from 25 to 50 ppm.
Under conventional microeconomics, maximum profit should occur when the marginal cost of P fertiliser equals the marginal return from grain. There are two reasons why life is not so simple. Firstly the response to P fertiliser varies with season, so the soil test - P response curve is not stable. For example, the later the break of season, the more reliant plants are on fertiliser P, since root growth and mineralisation of P from organic matter in the soil both slow down in colder weather. Secondly, there is the issue of whole farm budgeting over the longer term. Up to 60% of a farm’s 10 year income is earned in 3 of those 10 seasons. Therefore we have to maximise income when those 3 good seasons happen. Fertiliser is about 15-25% of the cost of putting in a crop (feel free to argue). We don’t know in advance if the season will be a good one. However if you limit potential yield because of that 15-25% cost input, you lose the potential return from your investment in weed control, insect control, seed, fuel, time and overheads that you have also invested. Hence consultants in southern NSW tend to aim for maximum yields with their advice on P rates.
We conducted P rate trials (0, 10, 20 and 30 kg P/ha) at 4 locations (Culcairn, Temora, Yarrawonga, Balranald) with Colwell P ranging from 24-42 ppm and PBI<120. We measured dry matter production during the season as well as grain yield, and P uptake in crop dry matter and in grain. This provided data for an evaluation of the effectiveness of P application (in what turned out to be a dry year).
A simple marginal cost analysis (table 1) showed that even in the drought year of 2006, the lower P rate of 10 kg P/ha paid its way (i.e. was cost neutral or profitable) at 3 of the 4 sites. At the Temora site no rate of P was profitable despite this being the site of lowest Colwell P (24 ppm). However if we consider the fallback option of cutting the wheat for hay, our dry matter data at anthesis (figure 1, table 2) shows that P application was profitable at all 4 sites. We conclude that application of 10 kg P/ha is a low risk strategy for generating maximum profit, even in a ‘bad’ year.
Table 1. Raw data and $ returns for grain response to P application in 2006.
|
|
Temora
|
Culcairn
|
Yarrawonga
|
Balranald
|
||||
|
|
grain kg/ha
|
grain kg/ha
|
grain kg/ha
|
grain kg/ha
|
||||
|
P rate(kg/ha)
|
|
|
|
|
|
|
|
|
|
0
|
171
|
|
211
|
|
150
|
|
431
|
|
|
10
|
166
|
|
403
|
|
338
|
|
558
|
|
|
20
|
129
|
|
450
|
|
404
|
|
604
|
|
|
30
|
79
|
|
493
|
|
403
|
|
639
|
|
|
|
|
|
|
|
|
|
|
|
|
$/ kg P
|
4.35
|
i.e. cost
|
|
|
|
|
|
|
|
$/ t grain
|
350
|
i.e. return
|
|
maximum profit
|
|
|
||
|
|
|
|
|
|
||||
|
P cost
|
return
|
net
|
return
|
net
|
return
|
net
|
return
|
net
|
|
0.00
|
60
|
60
|
74
|
74
|
53
|
53
|
151
|
151
|
|
43.50
|
58
|
15
|
141
|
98
|
118
|
75
|
195
|
152
|
|
87.00
|
45
|
-42
|
158
|
71
|
141
|
54
|
211
|
124
|
|
130.50
|
28
|
-103
|
173
|
42
|
141
|
11
|
224
|
93
|
Table 2. Raw data and $ returns for dry matter (hay) response to P application in 2006
|
|
Temora
|
Culcairn
|
Yarrawonga
|
Balranald
|
||||
|
|
hay kg/ha
|
hay kg/ha
|
hay kg/ha
|
hay kg/ha
|
||||
|
P rate(kg/ha)
|
|
|
|
|
|
|
|
|
|
0
|
1297
|
|
1164
|
|
627
|
|
867
|
|
|
10
|
1800
|
|
1768
|
|
1289
|
|
1114
|
|
|
20
|
1939
|
|
1880
|
|
1497
|
|
1199
|
|
|
30
|
1990
|
|
2149
|
|
1711
|
|
1383
|
|
|
|
|
|
|
|
|
|
|
|
|
$/ kg P
|
4.35
|
i.e. cost
|
|
|
|
|
|
|
|
$/ t hay
|
220
|
i.e. return
|
|
maximum profit
|
|
|
||
|
|
|
|
|
|
||||
|
P cost
|
return
|
net
|
return
|
net
|
return
|
net
|
return
|
net
|
|
0.00
|
285
|
285
|
256
|
256
|
138
|
138
|
191
|
191
|
|
43.50
|
396
|
353
|
389
|
345
|
284
|
240
|
245
|
202
|
|
87.00
|
427
|
340
|
414
|
327
|
329
|
242
|
264
|
177
|
|
130.50
|
438
|
307
|
473
|
342
|
376
|
246
|
304
|
174
|
Unfortunately, we never know in advance what the season will bring. Table 3 offers a means to assist with thinking through the issue of seasonal risk for grain production. An equivalent table is available for the fallback position of hay from wheat crops. The table offers a simple 2 by 2 classification of seasonal circumstance and fertiliser management decision. The division of the circumstance in which a farmer finds himself is expressed simply: “average” year or “drought” year. The second division is based on the farmer’s action: low P (10 kg/ha) and average P (20 kg/ha) application. We explored the economic consequences of these 4 combinations of action and circumstance. The data in grey cells can be varied for local circumstances.
Table 3. Decision support tool for risk associated with P application after a drought.*
|
P response 10-20kgP/ha (Average years)
|
13%
|
|
|
|
P response 10-20kgP/ha (Drought years)
|
8%
|
|
|
|
MAP price ($/t)
|
$1,100
|
|
|
|
Phosphorus price ($/kg)
|
$4.35
|
|
|
|
|
|
Season
|
|
|
20 kg P/ha - Phosphorus rate
|
Average
|
|
Drought
|
|
Grain yield (t/ha)
|
4.00
|
|
0.80
|
|
Grain price ($/t)
|
$320
|
|
$420
|
|
Phosphorus expenses ($/ha)
|
$87
|
|
$87
|
|
Marginal income ($/ha)
|
$1,193
|
|
$249
|
|
|
|
|
|
|
10 kg P/ha - Phosphorus rate
|
Average
|
|
Drought
|
|
Grain yield (t/ha)
|
3.48
|
|
0.74
|
|
Grain price ($/t)
|
$320
|
|
$420
|
|
Phosphorus expenses ($/ha)
|
$43
|
|
$43
|
|
Marginal income($/ha)
|
$1,070
|
|
$266
|
|
Area (ha)
|
1
|
|
|
|
|
|
|
|
|
|
Average
|
|
Drought
|
|
Marginal income
|
Cost/benefit
|
Cost/benefit
|
|
|
20 kg P/ha - Phosphorus rate
|
$123
|
|
-$17
|
|
10 kg P/ha - Phosphorus rate
|
-$123
|
|
$17
|
* The Decision Support Tool is the property of Holmes Sackett.
The spreadsheet model shows that a decision to decrease the phosphorus rate from 20 to10 kg/ha results in an opportunity cost of income foregone ($123/ha) in an average season and a cost benefit ($17/ha) in a drought. Because the chance of a drought is low relative to the chance of an average season, the cost of conservative behaviour (a low P rate) is, on average, greater than the benefit. That is, we should err toward the decision to earn income rather than toward saving costs.
So what are the relative chances of a good or bad year in 2009? There is one last variable: what is your attitude to risk? Are you a Hanrahan or an Alan Bond, an Eeyore or a Tigger? This is a personal characteristic with no right or wrong answer. You have to be able to sleep at night after making a decision about your circumstances. The aim of this data and the economic + risk analysis is to provide you with a framework to assist you thinking through your circumstances: soil test P on each paddock, cash available to be used across all paddocks, and your attitude to risk. If droughts are going to increase in frequency and severity, we need such a template for considering risk associated with P fertiliser application.
Zinc
Factors contributing to crop responses:
• Alkaline soils - zinc is required on a regular basis when cropping alkaline soils (>7.0 to 7.5 pH CaCl2).
• Land forming that removes organic matter and topsoil exposing alkaline subsoil
• “Puff banks” on gilgai country
• Lack of root extension eg compaction, cold wet soils, application of sulfonylurea herbicides.
• Disruption of Vesicular Arbuscular Mycorrihizas (eg wheat following canola, long fallow)
• Liming of acid soils
• Increased zinc demand through higher yield targets
• Low soil and plant tissue test results from a NATA & ASPAC accredited laboratory
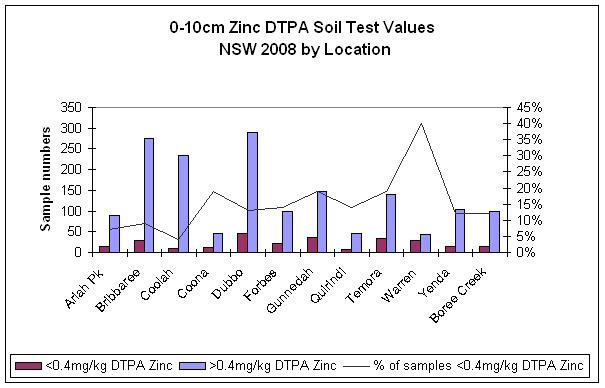
The most useful set of tools for determining zinc requirements is a topsoil test as an initial indicator followed by plant tissue test during mid tillering. This combination of tests will identify if a crop has access to adequate levels of zinc initially and if the crop has been able to extract sufficient zinc from the soil.
Figure 1. 0-10 cm Zinc DTPA soil test values NSW 2008 by location.
(Data set 1615 samples for winter crop 2008)
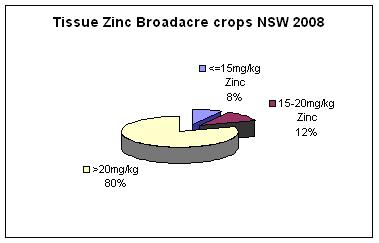
Figure 2. Tissue Zinc in broadacre crops, NSW 2008
(small data set, only 164 cereal tissue samples in 2008)
In cases where a deficiency is identified with a tissue test it is important to apply an application of foliar zinc as early as possible to prevent yield loss.
Responses in cereals
No significant grain yield response to soil applied zinc in 2008 trials at Greenethorpe, Werris Creek, Spring Ridge, Temora.
Significant grain yield responses to zinc application at planting have been recorded at Junee 2003, Alectown 2003, Morven 2004, Tanimbla 2003, Spring Ridge 2000. Long term trial site Tulloona (see below) 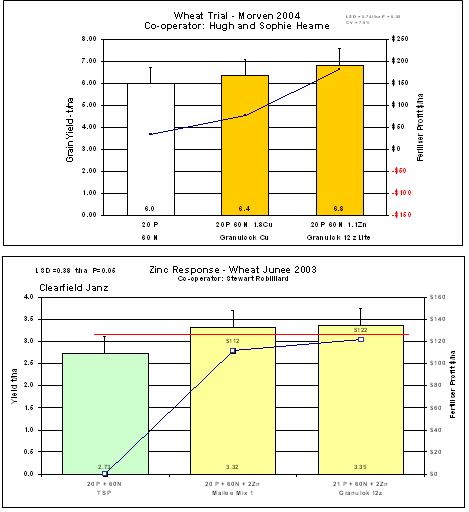
Figure 3. Long term responses to zinc application on a vertisol in northern NSW
Table 4. Average grain yield t/ha (sorghum and wheat) 1996 – 2005
|
Nitrogen kgs/ha
|
Phosphorus kgs/ha
|
Nil Zinc
|
Zinc Monohydrate @ 10kgs/ha 2001 & 2006
|
Granulock Starter Z with crop
|
|
60
|
0
|
3.75
|
|
|
|
60
|
10
|
4.08
|
4.29
|
4.45 (1.25kgs/ha)
|
|
60
|
20
|
3.95
|
4.65
|
4.46 (2.5kgs/ha)
|
|
|
Average
|
3.93
|
4.47
|
4.45
|
At this long term trial site the annual application of zinc applied with the starter fertiliser is as effective as higher rates applied less frequently.
Contact details
Mark Conyers
NSW DPI
EH Graham Centre
Wagg Wagga
Ph: 02 6938 1999
email: mark.conyers@dpi.nsw.gov.au
Jim Laycock
Incitec Pivot Ltd
Cowra
Mb: 0427 006 047
email: jim.laycock@incitecpivot.com.au
Was this page helpful?
YOUR FEEDBACK