TACTICAL N MANAGEMENT IN SORGHUM
| Date: 10 Sep 2008
Written by Guy McMullen, Anthony Mitchell, Giles Butler & Ron Southwell, NSW DPI
Take home message
· There were limited yield responses to topdressing N in 2005 and 2006 (1/11 sites)
· Top-dressing resulted in increases in grain protein rather then grain yield indicating that N application needs to occur before the 8 leaf stage to maximise yield responses.
· Tactically splitting or delaying N applications did maintain grain yields when applications occurred at the 7 leaf stage (30 DAP) in 2007.
· Delaying some, or all, of the budgeted fertiliser N may have significant risk management benefits in poor seasons.
Aim (What was the research question?)
The aim of this research was to determine whether in-crop N application is a useful practice in wheat and sorghum for farmers in the northern cropping zone.
This research addressed the following questions:
- When is in-crop N application applicable?
- How often does in-crop N application provide a benefit?
- How does in-crop N application compare to alternative N strategies?
Method (How was it done?)
2005 and 2006
Trials were randomised block designs overlaid on commercial sorghum paddocks. Each trial consisted of 4 replicates with plots 8 m x 10 m in dimension. Nitrogen was applied as urea when the crop had reached 6-8 leaves with rainfall expected soon after application.
Table 1: Outline of the sorghum top-dressing trials in northern NSW during 2005/06
|
Region
|
Site
|
Starting water (mm)
|
Starting soil Nitrogen
(kg N/ha) †
|
Soil N at Z31
(kg N/ha)
|
Rainfall after in-crop N††
|
|
Moree
|
Tulloona
|
165
|
99
|
94
|
42 (10)
|
|
Warialda
|
201
|
66
|
66
|
89 (10)
|
|
|
Croppa Ck
|
135
|
36
|
35
|
23 (3)
|
|
|
Milguy
|
167
|
148
|
130
|
27 (3)
|
|
|
Liverpool Pl.
|
Blackville
|
287
|
61
|
21
|
14 (7)
|
|
Pine Ridge*
|
347
|
158
|
84
|
0 (7)
|
|
|
Spring Ridge
|
356
|
271
|
482
|
16 (5)
|
|
|
Caroona
|
169
|
120
|
269
|
40 (5)
|
†Total for soil profile to 1.2 m includes fertiliser applied at sowing.
†† Number in brackets indicates time to rainfall
*Site affected by Cl-
Tables 1 and 2 outline the site details for each experimental season. In the 2005 season N treatments were consistent across all 8 sites (0, 30, 60 and 90 kg N/ha) while in 2006 the Liverpool Plains received higher in-crop N rates due to higher yield potentials (0, 40, 80, 120 kg N/ha). In 2006 4 trial sites were established across the Moree and Liverpool Plains area with only 3 harvested due to assistance from a commercial harvesting contractor.
Table 2: Outline of the sorghum top-dressing trials in NSW during 2006/07
|
Region
|
Site
|
Starting water (mm)
|
Urea @ sowing (kg N/ha)
|
Starting soil Nitrogen
(kg N/ha) †
|
Soil N at Z39
(kg N/ha)
|
Rainfall after in-crop N††
|
|
|
|
|
|
|
|
|
|
Liverpool Plains
|
Pine Ridge
|
310
|
200
|
112
|
163
|
47 (28)
|
|
Caroona
|
228
|
0
|
190
|
79
|
30 (10)
|
|
|
Moree
|
Tulloona
|
214
|
|
184
|
89
|
|
|
Croppa Ck
|
164
|
0
|
117
|
98
|
46 (3d)
|
Total for soil profile to 1.2 m includes fertiliser applied at sowing.
†† Number in brackets indicates time to rainfall
Prior to N application crop biomass was determined and crop growth stage was recorded and tillers counted. Crop biomass was also determined at anthesis and also at physiological maturity. Hand samples taken at harvest were used to determine grain yield and grain quality (protein, screenings and hectolitre weight).
2007
Two trials, tactical N application and N response trial, were located near Premer on the Liverpool Plains. The tactical N trial was a spit-plot design with 4 replications. Starting N was the main plot treatment with N timing as sub-plots. The N rate trial was a completely randomised design with 5 N rates and 4 replicates.
Table 3: 2007 trial site details
|
|
Details
|
|
Previous Crop
|
2006 Wheat
|
|
Planting Date
|
17/11/2007
|
|
Starting N†
|
85 kg N/ha
|
|
Starter fertiliser
|
35 kg MAP + 2.5% Zn
|
|
Variety
|
MR Buster
|
|
Plant Population (plants/ha)
|
57,000
|
|
In-crop rainfall
|
399 mm
|
Total for soil profile to 1.2 m excludes fertiliser applied at sowing.
Plots were sown with a small plot planter of 4 rows of 24 m length on 75 cm row spacing with MR Buster targeting 60,000 plants/ha. Nitrogen was applied as urea at sowing and broadcast by hand for later applications. The main plot treatment was 2 starting levels of N. An additional 50 kg N/ha was broadcast prior to sowing for low and high starting N. The sub-plots consisted of all combinations of 3 application timings N (table 4).
Crop growth stage was recorded at each N application timing. Plant population tiller number and head number was determined on each plot. Plots were harvested with a small plot header and sub-samples were used to determine grain yield and grain quality (protein, screenings, grain size and hectolitre weight).
Table 4: N application timings and proportions in 2007
|
|
|
Nitrogen Timings and Proportion
|
||
|
Treatment
|
Upfront
|
7-Leaf
(17/12/2007)
|
Boot
(19/1/2008)
|
|
|
1
|
Nil
|
0
|
0
|
0
|
|
2
|
Upfront
|
100
|
0
|
0
|
|
3
|
7lf
|
0
|
100
|
0
|
|
4
|
Boot
|
0
|
0
|
100
|
|
5
|
UF+7lf
|
50
|
50
|
0
|
|
6
|
7lf+Bt
|
0
|
50
|
50
|
|
7
|
UF+Bt
|
50
|
0
|
50
|
Results (What happened?)
2005 and 2006
Across the 2 seasons of trial work only one significant increase in grain yield was recorded in the 2005/2006 season (Table 5). This site near Croppa Creek had the lowest starting soil N and water levels of all sites (Table 1).
Table 5: Effect of in-crop N management on grain yield in northern NSW in 2005/06
|
Area
|
Site
|
Top-dressed N (kg N/ha)
|
||||
|
0
|
30
|
60
|
90
|
mean
|
||
|
Moree
|
Tulloona
|
4.97
|
5.29
|
5.25
|
4.95
|
5.12
|
|
Warialda
|
5.90
|
5.37
|
6.70
|
5.68
|
5.91
|
|
|
Croppa Ck
|
2.45c
|
2.91b
|
3.30b
|
3.73a
|
3.10
|
|
|
Milguy
|
5.27
|
5.07
|
4.72
|
4.64
|
4.93
|
|
|
Liverpool Plains
|
Blackville
|
4.39
|
4.71
|
5.22
|
4.82
|
4.78
|
|
Pine Ridge
|
1.38
|
0.88
|
0.72
|
0.66
|
0.91
|
|
|
Spring Ridge
|
5.38
|
5.74
|
5.75
|
5.86
|
5.68
|
|
|
Caroona
|
6.13
|
7.31
|
6.39
|
6.82
|
6.66
|
|
In 2006/07 there were no significant yield responses to in-crop N applications at any of the sites with one site unable to be harvested due to contract harvesting intervention.
Table 6: Effect of in-crop N management on grain yield in northern NSW in 2006/07
|
Area
|
Site
|
Top-dressed N (kg N/ha)
|
||||||
|
0
|
30
|
40
|
60
|
80
|
90
|
120
|
||
|
Liverpool
Plains
|
Pine Ridge
|
4.57
|
-
|
4.76
|
-
|
4.79
|
-
|
5.01
|
|
Caroona
|
5.99
|
-
|
6.26
|
-
|
5.94
|
-
|
6.21
|
|
|
Moree
|
Millbrook
|
3.95
|
4.16
|
-
|
4.12
|
-
|
4.39
|
-
|
Unlike grain yield there were several protein responses to in-crop N application in the 2005/06 season (5/8 sites). This suggests that the applied N may have been applied too late in the crop development cycle or that the in-crop N was surplus to plant requirements. There were no significant responses in grain protein to in-crop N in 2006/07.
Table 7: Effect of in-crop N management on sorghum grain protein NSW in 2005/06.
|
Area
|
Site
|
Top-dressed N (kg N/ha)
|
||||
|
0
|
30
|
60
|
90
|
Grand Total
|
||
|
Moree
|
Tulloona
|
10.76b
|
10.71b
|
11.79a
|
11.44a
|
11.18
|
|
Warialda
|
8.53b
|
8.62b
|
8.78b
|
10.28a
|
9.05
|
|
|
Croppa Ck
|
9.78b
|
9.96b
|
10.76a
|
11.61a
|
10.53
|
|
|
Milguy
|
11.99
|
12.03
|
12.42
|
12.50
|
12.24
|
|
|
Liverpool
Plains
|
Blackville
|
7.04b
|
7.12b
|
7.41ab
|
7.60a
|
7.29
|
|
Pine Ridge
|
10.93
|
11.23
|
10.60
|
11.56
|
13.09
|
|
|
Spring Ridge
|
9.97
|
9.68
|
9.75
|
9.89
|
9.82
|
|
|
Caroona
|
8.19c
|
8.36bc
|
9.04a
|
8.97ab
|
8.64
|
|
2007
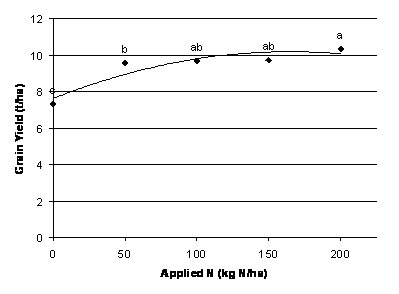
A simple rate response trial showed that the optimal N application rate was between 50 and 100 kg N/ha. Even with no N application sorghum yielded more then 7.5 t/ha (Figure 1).
Figure 1: N rate response curve for 2007 Premer trial site.
All N application treatments yielded significantly more then the untreated control except for the 100% N applied at the booting stage (Table 9). The highest yields were found with earlier application timings either at planting or at the 7 leaf stage. Grain protein was significantly higher in all top-dressed treatments while all other grain quality parameters were unaffected by N timing.
Table 9: Effect of tactical N management (averaged across low and high starting N) on sorghum grain yield at Premer in 2007/08.
|
|
N Treat
|
Tillers
|
Heads
|
Grain Yield
(t/ha)
|
Protein
(%)
|
Hectalitre
(kg/hL)
|
Screenings (%)
|
Grain wt
(g/1000)
|
|
(,000/ha)
|
||||||||
|
1
|
Nil
|
209
|
128
|
7.98 a
|
7.82 b
|
81.9
|
5.7
|
34.1
|
|
2
|
Upfront
|
204
|
144
|
9.07 bc
|
8.63 a
|
80.9
|
7.2
|
33.4
|
|
3
|
7lf
|
215
|
142
|
9.24 c
|
8.66 a
|
81.4
|
5.1
|
33.4
|
|
4
|
Boot
|
228
|
140
|
8.68 ab
|
8.66 a
|
80.9
|
5.5
|
34.3
|
|
5
|
UF+7lf
|
210
|
152
|
9.20 bc
|
8.49 a
|
80.5
|
6.7
|
33.4
|
|
6
|
7lf+Bt
|
218
|
136
|
8.73 bc
|
8.50 a
|
80.8
|
6.7
|
34.4
|
|
7
|
UF+Bt
|
207
|
147
|
9.12 bc
|
8.86 a
|
80.9
|
5.8
|
34.2
|
|
|
5% l.s.d
|
nsd
|
nsd
|
0.61
|
0.47
|
nsd
|
nsd
|
nsd
|
Conclusion
Results from trials in 2005 and 2006 have shown that sorghum responses to top-dressed nitrogen were restricted to 1/11 sites with the responsive site having the lowest starting soil N of all locations. In contrast to grain yield, grain protein showed a more frequent increase with top-dressing indicating that N application may have occurred too late to contribute to yield. The lack of any protein price increments in sorghum means this equates to exporting applied N off-farm without any return on investment.
In 2007 grain yields were maintained at the same level as upfront N application by tactically splitting N prior to booting. This, combined with previous trial work, indicates that there is no yield benefit above upfront N application but that there is potential to maximise yields under improved seasonal conditions with split N applications.
Trials were conducted in 2007 under extremely favourable growing conditions, as seen in trial yields, and the risk management benefits of delaying N application until a better idea of crop yield potential and value is potentially important. It there also be more benefit from delayed N application in moisture limited situations to delay water use until the post-flowering period.
Acknowledgments
Project Support: This work was funded by GRDC and NSW DPI through the Eastern Farming Systems project (DAQ0106) and the Northern Grower Alliance project (NGA0002). Many thanks to all the growers and agronomists who assisted with land and time.
Contact details
Guy McMullen
Ph: 02 6763 1155
Email: guy.mcmullen@dpi.nsw.gov.au
Was this page helpful?
YOUR FEEDBACK
To protect your privacy, please do not include contact information in your feedback. If you would like
a response, please contact us.