OPTIMISING MAIZE YIELD UNDER IRRIGATION
| Date: 09 Sep 2008
Take home message
Optimising maize yield under irrigation
- No irrigation (DRYLAND),
- One irrigation prior to tassel formation (EARLY),
- One irrigation during the silk stage (LATE) and,
- Irrigation following farmer’s practices (FARMER).
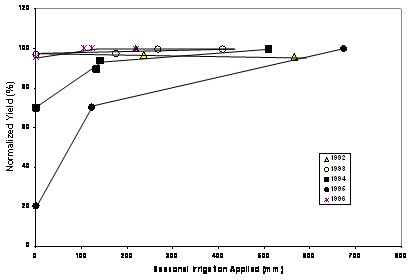
Figure 2: Relationship between seasonal irrigation and normalized yield for surface-irrigated corn in Nebraska (from Payero et al., 2006).
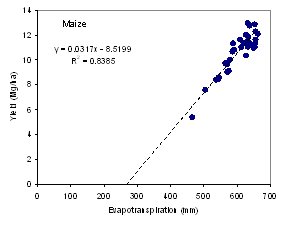
How much water is needed to optimize maize yield?
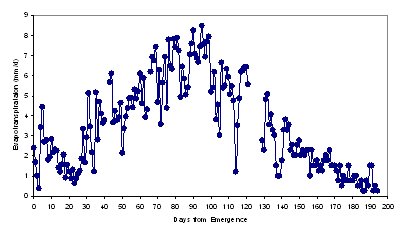
Figure 3: Crop evapotranspiration for maize measured at North Platte, Nebraska, during 2001, using an eddy covariance system (Payero et al. 2008c).
|
Location
|
Maize sowing date
|
|
Brookstead
|
15 Sep
|
|
Dalby
|
15 Sep
|
|
Goondiwindi
|
1 Sep
|
|
St. George
|
20 Aug
|
|
Emerald
|
15 Aug
|
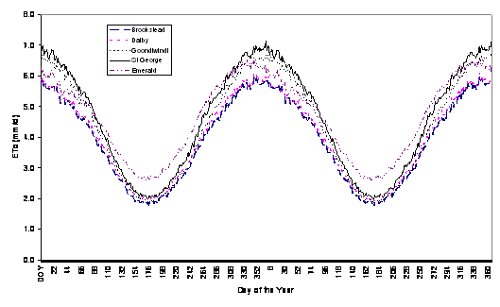
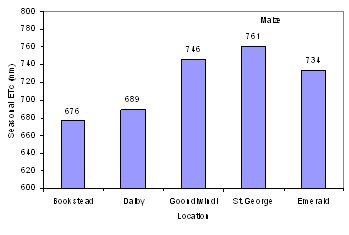
Figure 4: Grass reference evapotranspiration (ETo) for different locations in Australia.
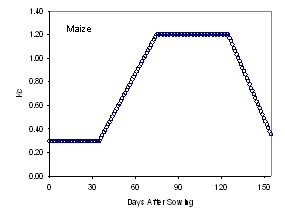
Figure 5: Crop coefficient (Kc) curve for maize (Allen et al., 1998).
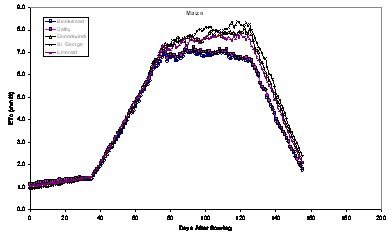
Figure 6: Average daily maize evapotranspiration (ETc) calculated for different locations.
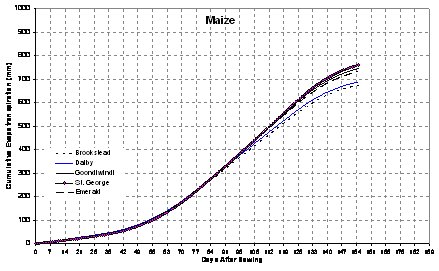
Figure 7: Average daily maize cumulative evapotranspiration (ETc) calculated for different locations.
Some local data
|
|
|
Yield
(Mg/ha)
|
|
Irrig
|
Rain
|
Rain+Irrig
|
Y/Irrig
|
Y/(R+I)
|
|
Year
|
Max
|
Min
|
Avg
|
(mm)
|
(mm)
|
(mm)
|
(kg/ha/mm)
|
(kg/ha/mm)
|
|
1987
|
11.1
|
8.3
|
9.6
|
344
|
452
|
796
|
28.0
|
12.1
|
|
1988
|
13.9
|
8.5
|
11.0
|
343
|
588
|
931
|
32.2
|
11.9
|
|
1989
|
11.0
|
8.5
|
10.0
|
300
|
203
|
503
|
33.4
|
19.9
|
|
1990
|
12.7
|
9.7
|
11.6
|
340
|
543
|
883
|
34.2
|
13.2
|
|
1991
|
11.7
|
8.3
|
10.2
|
427
|
360
|
787
|
23.8
|
12.9
|
|
1992
|
13.4
|
9.1
|
11.3
|
304
|
591
|
895
|
37.0
|
12.6
|
|
1993
|
13.5
|
7.5
|
10.7
|
300
|
248
|
548
|
35.7
|
19.6
|
|
1994
|
11.4
|
8.6
|
9.9
|
358
|
525
|
883
|
27.7
|
11.3
|
|
1995
|
12.0
|
8.7
|
10.4
|
340
|
386
|
726
|
30.5
|
14.3
|
|
1996
|
13.1
|
11.1
|
11.9
|
225
|
672
|
897
|
52.8
|
13.3
|
|
1997
|
14.4
|
11.1
|
12.5
|
283
|
261
|
544
|
44.2
|
23.0
|
|
1998
|
13.2
|
8.5
|
10.4
|
313
|
374
|
686
|
33.2
|
15.1
|
|
1999
|
14.3
|
11.8
|
12.8
|
375
|
517
|
892
|
34.2
|
14.4
|
|
2000
|
15.3
|
10.3
|
12.8
|
256
|
|
|
50.2
|
|
|
2001
|
15.1
|
10.3
|
13.4
|
375
|
|
|
35.6
|
|
|
2002
|
14.4
|
10.4
|
12.7
|
327
|
|
|
38.9
|
|
|
2003
|
13.1
|
11.0
|
12.0
|
337
|
|
|
35.8
|
|
|
2004
|
13.8
|
8.8
|
11.6
|
200
|
|
|
57.8
|
|
|
2005
|
15.6
|
11.9
|
13.3
|
275
|
|
|
48.3
|
|
|
Avg
|
13.3
|
9.6
|
11.5
|
317
|
440
|
767
|
37.6
|
14.9
|
|
Min
|
11.0
|
7.5
|
9.6
|
200
|
203
|
503
|
23.8
|
11.3
|
|
Max
|
15.6
|
11.9
|
13.4
|
427
|
672
|
931
|
57.8
|
23.0
|
References
Contact details
Was this page helpful?
YOUR FEEDBACK