SOIL TEST INTERPRETATION AND P FERTILISER APPLICATION STRATEGIES
| Date: 09 Jul 2008

The recent sharp rises in the costs of artificial fertilisers, especially the ammonium and diammonium P blends used so widely in broadacre cropping, have increased the need to focus clearly on improving the reliability of determining soil P status, likely crop requirements and the most appropriate P application strategies. The uncertainty in prediction of crop P requirements from preplant soil tests is particularly concerning, given that P balances across the northern grains region are already negative – especially in high yielding sorghum crops. Recent work by Wang et al. (2007) on the Colonsay long term fertilizer trial site has shown that (i) without P fertiliser approx. half of the soil P removed by cropping comes from below the top 10cm and about 90% of that removed P comes from forms/pools of P not measured in the Colwell (bicarbonate P) soil test; and (ii) when luxury rates of P are applied annually, >95% of the residual P stays in the top 10cm of the profile and the depletion of the subsoils continued unchanged. The latter reflects the frequency with which crops rely on subsoil moisture (and nutrient) reserves in our rainfed cropping systems. The general observation of strongly stratified Colwell P test results (ie. much higher in the 0-10cm layer than the layers immediately below) across the region is consistent with these combined effects of shallow P fertilizer applications and deeper profile depletion.
The recent northern region Nutrient Management Initiative studies were focussed on determining whether deep banding (at 15-25cm) P fertilisers in addition to normal starter P applications at planting, gave significant crop responses in soils with low subsoil P ie. Was it worth topping up those depleted subsoils? Unfortunately the results of those studies were not clear cut, due in part to the complication that choice of site (based on soil Colwell P in topsoil and subsoils) did not necessarily reflect soils that were P responsive. There were a number of sites in which extra P applied pre-planting (regardless of placement) gave higher yields than starter P alone, but a number of other sites with very low Colwell P that gave no response (Fig. 1a). The response to those P applications in subsequent crops was low but again not clearly related to soil test P. There were some indications that moisture loss during deep placement affected crop performance in the year of application the first crop season (the number of significant negative responses in year 1, Fig. 1b), and while these were no longer evident in the 2nd crop year there was still no clear evidence to warrant deep P placement in subsoils with very low Colwell P (ie. <5 mg/kg). At least part of the reason for these results may lie in other (unmeasured) forms/pools of soil P at some of these sites.
Figure 1: Effects of (a) application of an additional 40-60 kg P/ha to soils prior to planting, relative to normal starter P applications alone; and (b) placing that additional P deeper in the soil profile (15-20cm), compared to surface (5-7cm) bands.
|
(a)
|
|
(b)
|
In order to understand the possible effect of other soil P pools (not measured by the Colwell test) on these results we did some more detailed soil analyses, similar to those used by Wang et al. (2007) on the Colonsay soils, on a subset of soils from these trial sites. In addition, we used a bioassay to assess how much of the P in the various pools was actually available for plant uptake, and how well this correlated with what the Colwell test predicted. The soils showed large variability in the size of the HCl-extractable P pools (one of the backup pools that was run down by long term cropping at Colonsay) that were not necessarily reflected in Colwell P. For example, soils with Colwell P of 20 mg/kg had HCl-extractable P anywhere between an additional 20 mg/kg and 1100 mg/kg (Fig. 2a)! In other words, soils with similar Colwell P appeared to have hugely variable P reserves.
The bioassays have given at least a preliminary indication of the availability of those reserves, and these are shown in Fig. 2b. In this graph the amount of plant available P has been plotted against the Colwell P test, and there are clearly a number of soils with available P reserves much greater than would be expected on the basis of the Colwell P result. Interestingly, when we looked at the change in P reserves after the bioassay, many of those soils with high available P had supplied that P from the acid P pool. Collectively, these results suggest that there are variable (in some cases very large) P reserves that are plant available in some Vertosol soils, and that using Colwell P alone doesn’t provide a useful measure of all available P reserves.
Figure 2: Relationship between Colwell P and (a) soil P reserves determined in the HCl step of a soil P fractionation, and (b) the amount of bioavailable P as indicated by a filter paper bioassay.
|
(a)
 |
|
(b)
|
So what does all this mean for soil test interpretation and crop responses? It is early days in terms of developing improved soil tests to predict where crops will respond to P fertilizers, but there is a clear need to determine the occurrence and size of some of these other P pools in the Vertosols of the northern grains region, and assess their availability as a backup P supply for crops. This is a similar position to where we are with soil potassium status.
The current Colwell test has a clear role in indicating soil P status for the coming crop, and in soils where there is no backup P supplies (or those supplies aren’t sufficiently available to meet crop demand), then the old rules will still apply. However, how do we determine whether your soil is one with backup or not? The only widely available test that currently uses an acid extraction process to measure soil P (albeit with a much weaker acid) is the BSES P test used in the sugar industry. The ratio of the BSES result to the Colwell result in the same soil sample is a possible indicator of the extent of P reserves across a region.Some of the results for Dalby, Pittsworth and Clifton soils are shown in Fig. 3, with what are clearly huge variations in the size of the BSES P result compared to Colwell P within each district. For example, soils with 10 mg/kg Colwell P can have a BSES P result ranging from 10-11 mg P/kg (ie. BSES:Colwell P of approx 1, indicating next to no extra P reserves) to nearly 400 mg P/kg (a ratio of 40:1 and potentially large P reserves).
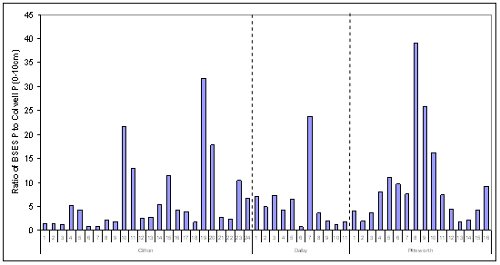
Figure 3: Variation in the ratio between BSES P and Colwell P in soils from the 0-10cm layers in the Dalby, Pittsworth and Clifton districts.
Unfortunately at this stage we don’t know how readily available these extra P reserves being measured by the BSES P are, and this is the subject of further work including trials run as part of the SQ Farming Systems project. However, the better the understanding we have of the relationship between our traditional Colwell P test result, the extent of possible backup P reserves (BSES P results) and crop response to fertiliser P, the more chance we have of providing better guidelines for efficient P fertiliser use.
Contact details
Dr Mike Bell
Plant Sciences/ Delivery
DPI&F
PO Box 23, Kingaroy 4610
Ph: (07) 4160 0730
Fx: (07) 4162 3238
Email: mike.bell@dpi.qld.gov.au
Was this page helpful?
YOUR FEEDBACK
To protect your privacy, please do not include contact information in your feedback. If you would like
a response, please contact us.