Crop Sensors - a tool for better tactical nitrogen management?
| Date: 20 Jun 2008
Nick Poole
Foundation for Arable Research (FAR), New Zealand
Take home messages
• Crop sensors, measuring the reflectance from the cereal crop canopy, may offer a better opportunity of matching crop needs to nitrogen input with the move from strategic “upfront nitrogen” application to tactical “in-crop” applications.
• Early trials in wheat have shown good correlations between crop structure scores, such as tillers, and crop reflectance readings NDVI (normalised difference vegetative index) when assessed at early stem elongation (GS30-31).
• At the same growth stage, initial work, comparing the reflectance of nitrogen rich strips (plots receiving nitrogen at planting) with zero N control plots, has revealed that these reference points could be a guide to the likelihood of a nitrogen response.
• Trial work has also demonstrated that crop sensors (GreenSeeker® in these trials) could have use as a research tool to quantify differences in green leaf retention during flowering and grain fill.
• In one experiment, carried out in northern NSW, NDVI measurements at flowering (GS61), gave a more reliable guide to final yield than dry matter assessment taken at the same time. This result appears to be linked to the ability to differentiate biomass that is actively photosynthesising as opposed to total biomass.
• In thicker crop canopies in southern Victoria, (narrow row spacing 17.5cm) there have also been good correlations between NDVI readings taken during grain fill and final yield.
• There are a number of issues that need to be clarified if NDVI readings are to be used as a basis for nitrogen application, for example the documented lack of correlation to canopy size above a Green Area Index (GAI) of three, the possible need for different NDVI algorithms for different varieties and the ground truthing to ensure that variations in canopy biomass are linked to nitrogen.
• However the use of crop sensor information, such as NDVI, combined with in-crop nitrogen application may be a method of using the crop itself as an indicator to apply variable rate nitrogen rather than depending on soil tests.
The following key points are from a GRDC funded project (SFS 00015) on disease and canopy management in cereals taking place in southern Australia and an agribusiness extension project on canopy management which took place in NSW. These are joint projects linking the Australian farmer groups (lead group Southern Farming Systems) with the New Zealand levy organisation FAR and in northern NSW Agvance Agriculture and the Eastern Farming Systems group.
Using Crop Sensors
In the US, Europe and Australia there is increasing interest in using crop sensors mounted on farm machinery (boom mounted) to monitor crop canopy performance. These sensors, combined with GPS tracking, can give us accurate pictures of both crop health and weed populations in different parts of the paddock. Compared to satellite systems they are cheaper, more flexible and not affected by cloud cover.
The GreenSeeker® (the crop sensor used in this project) comprises a sensor that uses red and infrared light to measure reflectance from the canopy – higher readings correlating to more crop canopy greeness which can in turn be related to crop canopy health, nitrogen status and overall photosynthetic activity.
The readings from the GreenSeeker® are expressed as NDVI (normalised difference vegetative index), which is calculated by reflectance at the red and infrared wavelength.
In essence this is an indicator of biomass greeness. In the US and in Australia some growers have started using this crop sensor in conjunction with an
N-rich green strip (where a luxury amount of N is put on at sowing). In the spring, using the crop sensor, the greeness of this small strip is compared to the surrounding paddock in order to measure the difference in crop canopy greeness.
In the US algorithms have been developed for a range of crops that calculate how much N to apply to maximise yield from the difference between the N-rich green strip and the adjacent crop.
Do crop sensors fit with tactical nitrogen management of the crop canopy?
Yes. In both high and low rainfall environments there is a growing awareness that delaying nitrogen input until stem elongation (GS30 – GS39 start of stem elongation to flag leaf emergence) offers considerable advantages:
• Greater nitrogen efficiency identified through higher protein contents and either the same or higher yields.
• Better match of soil water reserve to canopy size created with applied nitrogen.
• Greater opportunities to assess the seasonal outlook and thus the overall need for nitrogen.
• Better use of yield/nitrogen prediction models such as Yield Prophet.
This tactical nitrogen approach may also be a suitable candidate for a new range of decision support tools that enable the grower to better match crop demand and supply. Where greater emphasis is placed on upfront nitrogen nutrition there is no opportunity to use the crop itself as the indicator for nutrient demand, as a consequence available soil nitrogen and expected yield potential become the primary means of determining nitrogen input. In addition, longer growing season scenarios where winter rainfall can lead to both de-nitrification and leaching means there is still a strong case for soil nitrogen testing at late tillering/early spring in order to re-calculate crop demand. However with in-crop applications during stem elongation the crop itself can produce very visual indications of its nutrient status. Therefore:
• Is it possible to use those visual signals from the crop canopy in order to make better decisions about crop nitrogen input
• Could crop sensors be employed to interpret these signals in order to give us variable rate application when combined with GPS?
Use of the GreenSeeker® for measuring crop canopy reflectance – what results have been achieved?
A part of the GRDC funded project SFS 000015 and a GRDC Agribusiness extension project looking at canopy and disease management in the high rainfall zone have been evaluating different methods to assess the relationship between crop structure, visual appearance and final yield. In the last two seasons the GreenSeeker® has been used in order:
• To establish if there is a correlation between NDVI readings at stem elongation, tiller population and the need for nitrogen.
• To provide a rapid measurement replacing tiller counts, green area index and green leaf retention.
• To assess the relationship between NDVI assessments later in the season and final yield.
Canopy reflectance at stem elongation - its relationship with canopy structure and need for nitrogen against an N rich strip
In work on canopy management carried out on the Liverpool Plains by FAR, NSW DPI and Agvance, canopy biomass and greenness were assessed using the GreenSeeker® at key growth stages in order to ground truth assessments, with tiller counts, dry matter cuts and final grain yield.
Initial results (Table 1) were promising, illustrating that GreenSeeker® measurements at GS31 correlated well to tiller numbers recorded as a result of differences in plant population and nitrogen application. Comparing the seedbed nitrogen plots with the no N control (a comparison analogous to the concept of the N-rich strip) revealed a large difference in NDVI readings, suggesting that the site was strongly nitrogen deficient and would respond to nitrogen input.
Table 1. Influence of plant population, nitrogen timing and rate on tiller/m2 and NDVI (Normalised Difference Vegetative Index) readings from the GreenSeeker® – cv Ventura, Liverpool Plain, NSW 2006
|
Plant Population/m2
|
Untreated
|
Seedbed N (55kg/ha N)
|
Seedbed N (110kg/ha N)
|
|||
|
|
Tillers
/m2
|
NDVI reading
|
Tillers
/m2
|
NDVI reading
|
Tillers
/m2
|
NDVI reading
|
|
68
|
197
|
0.52
|
251
|
0.58
|
235
|
0.61
|
|
127
|
261
|
0.55
|
297
|
0.65
|
326
|
0.7
|
|
173
|
266
|
0.5
|
384
|
0.69
|
443
|
0.74
|
|
223
|
305
|
0.51
|
408
|
0.71
|
482
|
0.73
|
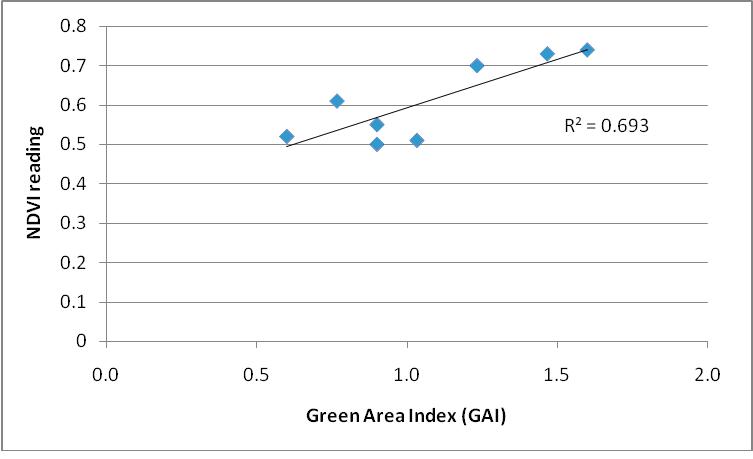
In addition, the work indicated that the NDVI scores recorded at this growth stage gave a correlation of r2 = 0.69 to the green area index (GAI) recorded manually (GAI = m2 of green tissue on 1m2 of soil) (Figure 1).
Figure 1. Correlation between NDVI readings and green area index (GAI) measured at GS31 – cv Ventura.
At this site there was a large and significant response to nitrogen application with the differential NDVI readings which coincided with available soil nitrogen, which measured 25kg/ha N (0-100cm) recorded at sowing (Figure 5).
At Lubeck, in the Victorian Wimmera in 2007, canopy reflectance measurements indicated little difference between the N-rich strips and the zero N control plots when assessed at GS30 (Table 2). There was no indication that tiller number or green area index had been increased by the upfront applications of nitrogen and this was illustrated by the NDVI readings which showed much lower correlation with tiller number. Again the visual appearance of the crop reflected the higher level of available nitrogen within the soil (113kg/ha N – 0-100 cm).
Table 2. Influence of nitrogen timing and rate on tiller/m2 and NDVI (Normalised Difference Vegetative Index) readings from the GreenSeeker® – cv Annuello, Lubeck, Wimmera, Vic 2007
|
Untreated
|
Seedbed N
(25kg/ha N)
|
Seedbed N (50kg/ha N)
|
Seedbed N (100kg/ha N)
|
||||
|
Tillers
/m2
|
NDVI reading
|
Tillers
/m2
|
NDVI reading
|
Tillers
/m2
|
NDVI reading
|
Tillers
/m2
|
NDVI reading
|
|
694
|
0.83
|
660
|
0.84
|
678
|
0.84
|
707
|
0.86
|
Correlation r2 = 0.27
In this trial there was no significant response to nitrogen applied pre-sowing or at GS30-31, but interestingly there was a small but significant response to nitrogen applied at the later timing of GS33 (Figure 2). Unfortunately, NDVI readings were not taken at that timing in order to see if canopy reflectance had changed to indicate deficiency.
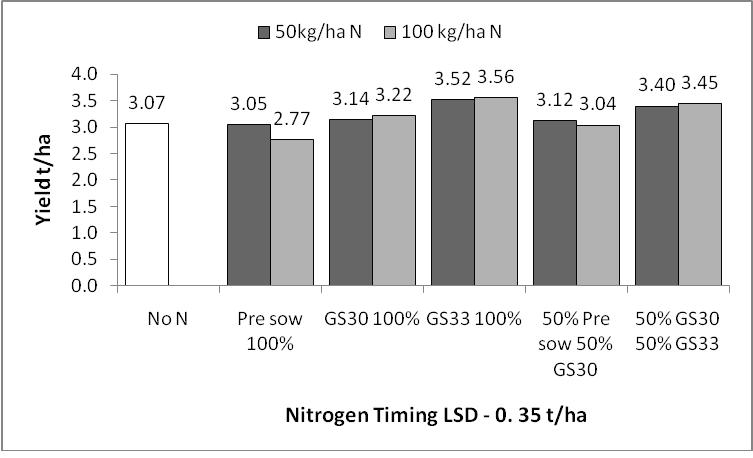
Figure 2. Influence of nitrogen timing and rate on yield t/ha – Lubeck cv Annuello
2007
NDVI correlation with Green Area Index (GAI)
There are, as outlined below, a number of issues that would need to be clarified before NDVI readings could be used to calculate nitrogen inputs for cereal crops. One major issue is that there is evidence that NDVI is not well correlated to green area index when the canopy exceeds a green area index of 3 i.e. 3m2 of green tissue standing on 1m2 of soil. Once wheat crops move into stem elongation growth stages (GS30-39 - the principal period for in crop nitrogen application) particularly in the high rainfall zone, they are likely to exceed a GAI of 3. Interestingly whilst it may not always be possible to correlate NDVI to green area index after canopy closure, there is evidence that the GreenSeeker® can still differentiate nitrogen rates and timings at higher GAI (GAI 4-6) (Figure 3).
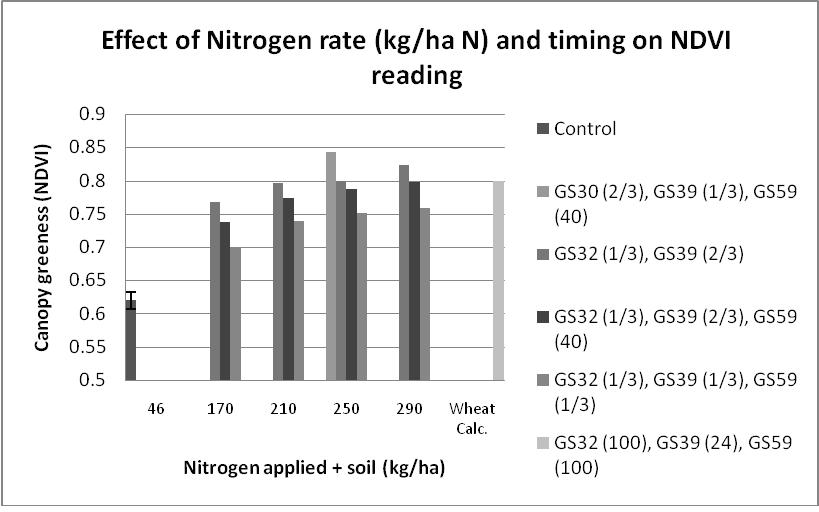
Note: 2/3 = proportion of the N dose applied at that timing, (40) or (100) = dose in kg/ha N applied
Figure 3. Effect of nitrogen rate and timing on NDVI readings in wheat assessed at ear emergence – cv Phoenix South Canterbury, New Zealand 2007
Can we use Crop Sensors to better predict final yield?
The GreenSeeker® has also been evaluated when the crop is senescing, to examine whether it can pick up differences in green leaf retention, even though much of this change occurs from the lower canopy up.
In northern NSW, on wide row spacing (30cm), the 2006 trial produced an excellent correlation between NDVI measurements and final yield when assessed at flowering (GS61). The correlation in this crop was better than the correlation between dry matter at GS61 and final grain yield at harvest (Figure 4 & 5). This appears to be because the dry matter cuts, whilst taking account of the biomass present, do not take account of what proportion of the canopy is green. For example if you look at the flag leaf emergence (GS39) nitrogen timing the dry matter production is little different to the zero nitrogen treatment, however the NDVI readings show that the crop canopy of the later timed nitrogen was retaining significantly greater greenness than the untreated.
In 2007 a trial in southern Victoria produced similar findings, however in these denser longer season crop canopies (cv Mackellar) the correlation between NDVI reading and final yield was strongest when the crop was at the grain fill stage rather than flowering (Figure 6).
Potential drawbacks
At an early stage in evaluation there are number of issues that need to be addressed before the use of crop sensors could be adopted accurately to apply nitrogen. For example:
• How different are the algorithms (the tables that convert a NDVI reading into a nitrogen input for an optimum yield) between different varieties of the same cereal type?
• Is the factor causing a difference in canopy greenness a nitrogen factor, if not then nitrogen input is being based on an erroneous indicator.
Even if crop sensors cannot deliver in this area, visual appearance of the crop is still the primary indicator for many growers when making a decision on nitrogen input, therefore where tactical N management is being pursued perhaps the N-rich strip concept alone gives greater confidence in assessing a crop’s nutritional status.
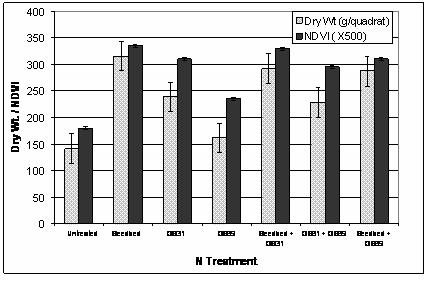
Figure 4. Influence of nitrogen timing (mean of different plant populations) on dry matter production (g/quadrat) and NDVI at flowering (GS61) based on an applied nitrogen rate 110 kg/ha N – cv Ventura, Liverpool Plains, NSW 2006 (FAR/ NSW DPI/Agvance) (Note: Seedbed N treatment dry matter assessment was equivalent to approx 8 t/ha)
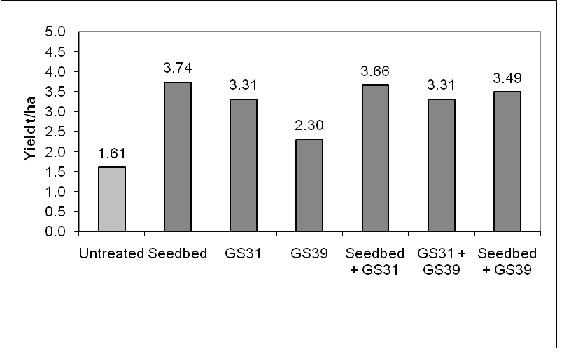
Figure 5. Influence of nitrogen timing (mean of different plant populations) on final grain yield (t/ha) – cv Ventura, Liverpool Plains, NSW 2006 (FAR/ NSW DPI/Agvance) 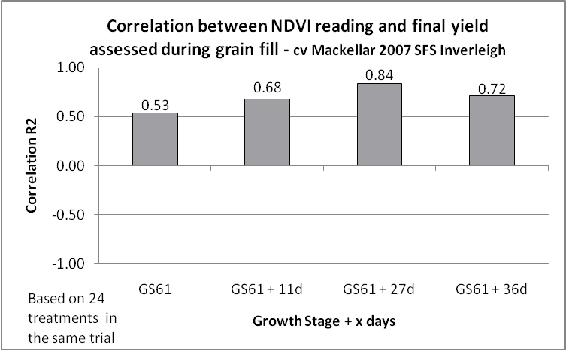
Figure 6. Strength of correlation between growth stage and NDVI readings recorded with the Greenseeker® assessed at the Inverleigh SFS trial site, Southern Victoria in 2007 – cv Mackellar.
Acknowledgements
I would like to acknowledge all the input of my co-workers on these projects at NSW DPI (Mr Ron Southwell and Mr Anthony Mitchell), Agvance Agriculture (Mr Peter Mackenzie and Mr Alan Bowring). Southern Farming Systems (Lou Ferrier) Cropfacts & Birchip Cropping Group/Wimmera Farming Systems (Brooke Thompson & Cherie Bell and the funding of GRDC.
GRDC Project number: SFS 00015
Contact Details
Nick Poole
Foundation for Arable Research,
PO Box 80,
Lincoln, Canterbury
New Zealand
poolen@far.org.nz
Was this page helpful?
YOUR FEEDBACK