An economic analysis of using remote sensing to identify and respond to crop variability A case study in peanuts
| Date: 14 Jun 2008
Andrew Robson1, 2, Graeme Wright1 and Stuart Phinn2.
1 Queensland Department of Primary Industries and Fisheries, Plant Sciences, J. Bjelke Petersen Research Station, Kingaroy, Qld
2 University of Queensland, Centre of Remote Sensing and Spatial Information Science, School of Geography, Planning and Architecture. Brisbane, Qld
Multispectral satellite imagery and field sampling guided by global positioning systems (GPS) has been shown to be an effective technology for predicting the spatial variability of crop vigour, maturation and yield within individual peanut crops. Determining the yield deficit produced by a limiting growth factor, combined with the area of crop affected, allows accurate predictions on total economic losses to be made. Research on three irrigated peanut crops demonstrated how potential loses of $50,000 (21.9ha centre pivot) resulting from an inefficient irrigation system and poor soil type, $20,000 (18.6ha) from a less than optimum harvest timing and $11,790 (15.3ha) from a foliar disease, can be determined. This information allows growers to decide whether to apply remedial action to improve low vigour areas, leave the areas unchanged or remove them from the cropping system altogether.
Background
Up to 60% of infrared (IR) radiation in sunlight is reflected upward (reflected energy) or downwards (transmitted energy) by the growing leaves of non-stressed vegetation. Any limitation on plant health reduces this percentage to a degree that can be measured by a number of remote sensing technologies, including high resolution multi-spectral satellite and aerial infrared (IR) imagery. The spatial variability of plant vigour across individual peanut crops has been identified with satellite imagery, which in turn has been accurately correlated to pod yield and maturity in both dry land and irrigated crops. This information has enabled growers to formulate better harvest regimes in order to maximise quality and yield, whilst minimising the risk of aflatoxin (a toxin produced by soil- borne fungi under end of season drought conditions).
Growers, generally have a good understanding of where consistently under performing regions of a crop occur. However, remotely sensed imagery and GPS can provide an exact location of where agronomists and growers should concentrate their in- field inspections, as well as allowing an assessment of the total area affected. By correlating the area of low production with final yield data, an accurate prediction of lost production and therefore impacts on gross margins can be made. This information can allow growers to make informed decisions on future management practices, as well as identify irregular within- season anomalies which may not be immediately apparent, such as the onset of pest and disease outbreaks.
Materials and Methods
Acquisition and analysis of satellite and aerial imagery
Aerial images of a disease-affected irrigated pivot where taken on 30 April 2003, using a Sony digital camcorder mounted in the door of a Cessna 185. Digital images were geo-referenced using ground control points collected with a handheld Global Positioning System (GPS) at strategic locations around the site. This camera system only outputs one digital reflectance data value for each pixel, so is unable to be used for band ratioing or specific vegetation indices. However, images can be classified into regions of differing IR reflectance.
For high resolution satellite imagery, the American owned QuickBird satellite was selected due to its high pixel resolution of 2.4m and its multi-spectral format (blue 450- 520nm, green 520- 600nm, red 630- 690nm and near infra-red (NIR) 760- 900nm). Imagery of the centre pivot monitored for maturity timing was acquired on 17 Mar 2006 near the S.E. Queensland townships of Wooroolin (151 49’05E, –26 24’24S), whilst the pivot displaying inefficient irrigation was acquired on 20 Feb 2007 near the township of Texas, Queensland (151 16’44E, -28 59’49S). Imagery was used to develop a Normalised Differential Vegetation Index (NDVI) to remove noise errors such as those associated with shading and crop geometry.
Both the aerial IR image and the NDVI transformed satellite images were segregated into five classes of IR reflectance using an unsupervised classification. The classes were then colour coded with Red indicating a high reflectance value and therefore larger crop vigour, followed by Yellow, Green, Blue and then Black indicating low vigour or bare soil.
Field validation of aerial IR and QuickBird satellite images
From the classified images, pod sampling locations were selected to represent each colour class and located on the ground with a non- differential GPS. To compensate for the GPS accuracy of 5 metres, each sample location was selected within a > 20m2 area of homogenous colour zone. Three replicate samples of intact peanut bushes and pods were collected from two adjacent 1m lengths of peanut row (i.e. 1.8m2). For the harvest timing trial the grower left test strip areas unharvested around the sample locations, so that hand samples could be collected after the commercial harvest. The samples were dried and threshed to determine pod yields. A 200g pod sub-sample was shelled and the percentage of pods having a black (i.e. mature) pericarp was used as an index of crop maturity. The maturity and yield values from each sample location were then correlated against the corresponding IR and NDVI values.
Results and discussion
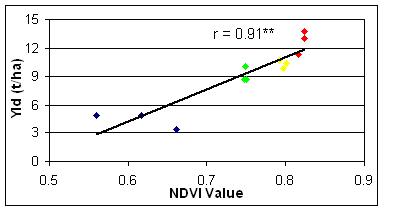
The true colour high resolution satellite image of the Texas pivot (cv. Holt) provided useful paddock information, such as the location of wheel tracks and contours etc. However, the addition of the infrared (IR) spectral band and subsequent vegetation index (NDVI) clearly identified the spatial variation in crop vigour, where high vigour areas (Red colour zones) produced larger and more vigorous plants whilst smaller plants were located in the low vigour (Blue) areas. A clear separation in plant vigour was observed within the area of the second irrigator wheel track where smaller plants were located, compared to those irrigator runs surrounding it that produced predominantly high vigour plants (classified Red colour zone), later identified to be the result of the incorrect installation of irrigator nozzles. Replicated ground sampling of this peanut crop within these classified zones, produced a highly significant correlation between yield and NDVI (Figure 1), with higher IR reflectance or crop vigour (Red) zones producing a higher yield, in this case over 12t/ha compared to 4t/ha in the Blue zones.
By calculating the area encompassed by each classified region as well as the corresponding yield values, as determined by the replicated hand samples, an estimate of total production for each zone as well as for the entire crop was determined (Table 1).
Table 1: Average pod yield (t/ha) measured from the replicated hand samples, the area encompassed by each colour zone and the calculated yield (t/ha) produced by each colour zone. (Black zones weren’t sampled as these mainly represented irrigator wheel tracks).
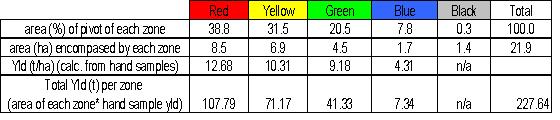
Data in Table 1 shows that only 39% of the crop grew at an optimum level (Red zones) and at an estimated yield of 12.68 t/ha would have produced 107.8 tonnes. This production nearly equalled the sum of the other three zones that encompassed 61% of the pivot and produced 139.8 t. This variation when expressed in monetary terms emphasises the potential loss in production from those regions with less than optimal growth (Table 2).
Table 2: Cost estimate on the potential loss of production by those zones showing less than optimum growth.
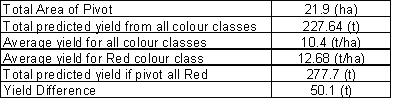
Data in Table 2 show that if the entire crop had optimum growth (Red) then the predicted total pivot yield would have been 278 tonnes, or 50 tonnes more than the total predicted yield based on the measured variation within each colour zone. In monetary terms, this represents a potential loss of $50,000 (at $1000 per tonne) from under-performing regions within the crop. Although impacts resulting from the irrigator are easily corrected, other poor performing regions were likely to be the result of a poorer soil type. By locating, sampling and identifying the soil deficiency with this technology, an agronomist could determine whether remedial action, such as earth works, liming etc., would be a cost effective management option based on the estimate of lost production within this area.
Impacts of harvest timing on peanut yield and lost economic production.
The classified NDVI image of the Wooroolin pivot identified both a large region of low crop vigour, a result of a gravely soil type and a similar area of high vigour that was attributed to a heavier soil. Replicated ground samples were collected within these regions on three separate occasions, the first to correspond with the actual harvest of the crop (20 April 06), the second 13 days later (3May 06) and the last 9 days later again (12 May 06).
A strong relationship between NDVI value and yield was again identified, with larger more vigorous plants (grey bars) producing a greater yield (3.75 t/ha) than the low vigour (black bars) areas (2.28 t/ha) on the first sample date, a trend that continued for two subsequent sampling times (Figure 2a). From Figure 2a it can be seen that yield measured from the high vigour zone increased from 3.75 t/ha to 5.3 t/ha and the low vigour from 2.28 t/ha to 3.11 t/ha over the 22 days following actual harvest time, a result likely to be attributed to pod maturity, with the Red zone (grey bars) in particular demonstrating a large increase in mature pods over that time period (21 – 67%) (Figure 2b).
 b.
b. 
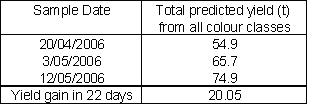
An economic assessment of the less than optimum harvest timing can be identified by applying a monetary estimate of lost production (Table 3). The estimated yield gain of 20.05 t between actual harvest timing to 22 days later, equates to $20,000 (at $1000/ t) and could be further increased by an additional $23,000 if the pivot reached uniform optimum growth (Red zones) rather than displayed regions of reduced growth potential.
Table 3. Predicted total crop yield at each sample date, calculated from the area covered by each colour zone by the estimated yield within each zone.
Impacts of foliar disease on peanut yield and lost economic production.
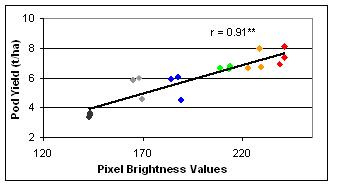
The temporal imaging of a Wooroolin irrigated pivot identified the spread of Net Blotch (Didymosphaeria arachidicola) spores that over a 51 day period resulted in nearly the entire crop being exposed to some level of infection. The IR imagery was able to distinguish the impacts of the foliar fungal disease, by reduced IR reflectance, in some cases when no visible effects could be seen by the grower. Hand samples taken within varying crop vigour regions, resulting from the disease, produced a strong correlation between pod yield and IR reflectance or in this case brightness values (Figure 3), with the worst effected plants yielding less than 4 t/ha in comparison to the optimum Red zones that produced up to 8 t/ha.
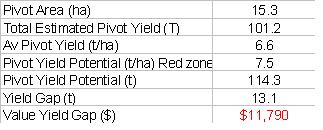
In monetary terms, the lost production resulting from this foliar disease could be estimated at nearly $12,000 (Table 4). By using this technology to determine the potential yield loss, a grower could determine whether the application of additional fungicide treatments at $50/ ha or $750 for the pivot would be a cost effective option.
Conclusion
The results presented in this paper indicate a number of possible applications that remote sensing and subsequent image analysis offers to cropping industries, using peanut crops as an example. These include: the accurate prediction of maturity and yield variability across individual crops, as well as a cost analysis of possible lost production from under performing areas; the in- season identification of irrigation deficiencies; and other limiting constraints such as foliar diseases. This information has been well received by peanut growers, agronomists and agribusiness representatives.
Contact details
Dr Andrew Robson
Bjelke Petersen Research Station
PO Box 23,Kingaroy 4610
Ph: 07 4160 0735
Email: Andrew.Robson@dpi.qld.gov.au
Was this page helpful?
YOUR FEEDBACK